
 Login Sign Up


| |||||
 |  | ||||

| 12Stocks.com Market Intelligence |
Best Tech Stocks
| In a hurry? Tech Stocks Lists: Performance & Trends, Stock Charts, FANG Stocks
Sort Tech stocks: Daily, Weekly, Year-to-Date, Market Cap & Trends. Filter Tech stocks list by size:All Tech Large Mid-Range Small and MicroCap |
| 12Stocks.com Tech Stocks Performances & Trends Daily | |||||||||
|
|  The overall Smart Investing & Trading Score is 100 (0-bearish to 100-bullish) which puts Technology sector in short term bullish trend. The Smart Investing & Trading Score from previous trading session is 90 and an improvement of trend continues.
| ||||||||
Here are the Smart Investing & Trading Scores of the most requested Technology stocks at 12Stocks.com (click stock name for detailed review):
|


| 12Stocks.com: Investing in Technology sector with Stocks | |
|
The following table helps investors and traders sort through current performance and trends (as measured by Smart Investing & Trading Score) of various
stocks in the Tech sector. Quick View: Move mouse or cursor over stock symbol (ticker) to view short-term technical chart and over stock name to view long term chart. Click on  to add stock symbol to your watchlist and to add stock symbol to your watchlist and  to view watchlist. Click on any ticker or stock name for detailed market intelligence report for that stock. to view watchlist. Click on any ticker or stock name for detailed market intelligence report for that stock. |
12Stocks.com Performance of Stocks in Tech Sector
| Ticker | Stock Name | Watchlist | Category | Recent Price | Smart Investing & Trading Score | Change % | YTD Change% |
| TGNA | TEGNA |   | Broadcasting | 20.30 | 50 | 0.00% | 9.72% |
| NXGN | NextGen Healthcare | | Healthcare Information | 23.94 | 50 | 0.00% | 0.00% |
| ZUO | Zuora | | Software | 10.02 | 50 | 0.00% | 1.01% |
| REKR | Rekor Systems | | Software - Infrastructure | 1.62 | 50 | 0.00% | -6.90% |
| SCPL | SciPlay | | Software | 22.94 | 50 | 0.00% | 0.00% |
| AVDX | AvidXchange | | Software - Infrastructure | 9.96 | 50 | 0.00% | -3.95% |
| NVEI | Nuvei | | Software - Infrastructure | 33.99 | 50 | 0.00% | 0.00% |
| SCSC | Scansource | | Electronics & Computer Distribution | 43.81 | 50 | -0.02% | -6.85% |
| CURI | CuriosityStream | | Broadcasting | 5.13 | 50 | -0.10% | 241.61% |
| FOX | Fox | | Entertainment | 55.88 | 50 | -0.13% | 21.47% |
| ITI | Iteris | | Communication | 7.19 | 50 | -0.14% | 0.00% |
| CRCT | Cricut | | Computer Hardware | 6.32 | 50 | -0.16% | 28.76% |
| DLO | DLocal | | Software - Infrastructure | 14.03 | 50 | -0.21% | 26.09% |
| MGIC | Magic Software | | IT | 20.22 | 50 | -0.39% | 74.41% |
| JASO | JA Solar | | Semiconductor | 45.92 | 50 | -0.58% | 0.00% |
| SIFY | Sify | | Telecom | 12.70 | 50 | -0.63% | 315.03% |
| EXLS | ExlService | | IT | 43.43 | 50 | -0.64% | -1.76% |
| CNK | Cinemark | | Entertainment | 27.82 | 50 | -0.71% | -9.66% |
| CNXC | Concentrix Corp | | IT | 47.86 | 50 | -0.75% | 11.95% |
| ASGN | ASGN | | IT | 47.90 | 50 | -0.77% | -42.19% |
| LILA | Liberty Latin | | Telecom | 8.11 | 50 | -0.80% | 26.64% |
| LILAK | Liberty Latin | | Telecom | 8.26 | 50 | -0.90% | 29.59% |
| GCI | Gannett Co | | Publishing | 4.15 | 50 | -0.95% | -18.15% |
| SOHU | Sohu.com . | | Electronic Gaming & Multimedia | 15.51 | 50 | -1.15% | 20.51% |
| LYTS | LSI Industries | | Electronic Components | 23.45 | 50 | -1.16% | 21.76% |
| For chart view version of above stock list: Chart View ➞ 0 - 25 , 25 - 50 , 50 - 75 , 75 - 100 , 100 - 125 , 125 - 150 , 150 - 175 , 175 - 200 , 200 - 225 , 225 - 250 , 250 - 275 , 275 - 300 , 300 - 325 , 325 - 350 , 350 - 375 , 375 - 400 , 400 - 425 , 425 - 450 , 450 - 475 , 475 - 500 , 500 - 525 , 525 - 550 , 550 - 575 , 575 - 600 , 600 - 625 , 625 - 650 , 650 - 675 , 675 - 700 , 700 - 725 , 725 - 750 , 750 - 775 , 775 - 800 , 800 - 825 , 825 - 850 , 850 - 875 , 875 - 900 | ||
 | Click To Change The Sort Order: By Market Cap or Company Size Performance: Year-to-date, Week and Day |  |
|
Get the most comprehensive stock market coverage daily at 12Stocks.com ➞ Best Stocks Today ➞ Best Stocks Weekly ➞ Best Stocks Year-to-Date ➞ Best Stocks Trends ➞  Best Stocks Today 12Stocks.com Best Nasdaq Stocks ➞ Best S&P 500 Stocks ➞ Best Tech Stocks ➞ Best Biotech Stocks ➞ |
| Detailed Overview of Tech Stocks |
| Tech Technical Overview, Leaders & Laggards, Top Tech ETF Funds & Detailed Tech Stocks List, Charts, Trends & More |
| Tech Sector: Technical Analysis, Trends & YTD Performance | |
| Technology sector is composed of stocks
from semiconductors, software, web, social media
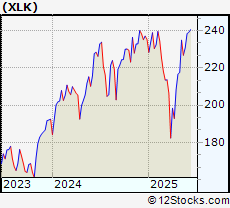
and services subsectors. Technology sector, as represented by XLK, an exchange-traded fund [ETF] that holds basket of tech stocks (e.g, Intel, Google) is up by 23.7823% and is currently outperforming the overall market by 9.0244% year-to-date. Below is a quick view of technical charts and trends: |
|
 XLK Weekly Chart |
|
| Long Term Trend: Very Good | |
| Medium Term Trend: Good | |
 XLK Daily Chart |
|
| Short Term Trend: Very Good | |
| Overall Trend Score: 100 | |
| YTD Performance: 23.7823% | |
| **Trend Scores & Views Are Only For Educational Purposes And Not For Investing | |
| 12Stocks.com: Top Performing Technology Sector Stocks | ||||||||||||||||||||||||||||||||||||||||||||||||
 The top performing Technology sector stocks year to date are
Now, more recently, over last week, the top performing Technology sector stocks on the move are


|
||||||||||||||||||||||||||||||||||||||||||||||||
| 12Stocks.com: Investing in Tech Sector using Exchange Traded Funds | |
|
The following table shows list of key exchange traded funds (ETF) that
help investors track Tech Index. For detailed view, check out our ETF Funds section of our website. Quick View: Move mouse or cursor over ETF symbol (ticker) to view short-term technical chart and over ETF name to view long term chart. Click on ticker or stock name for detailed view. Click on to add stock symbol to your watchlist and to view watchlist. |
12Stocks.com List of ETFs that track Tech Index
| Ticker | ETF Name | Watchlist | Recent Price | Smart Investing & Trading Score | Change % | Week % | Year-to-date % |
| IGN | Tech-Multimd Ntwk | | 53.86 | 40 | 0.918119 | -20.6435 | 0% |
| 12Stocks.com: Charts, Trends, Fundamental Data and Performances of Tech Stocks | |
|
We now take in-depth look at all Tech stocks including charts, multi-period performances and overall trends (as measured by Smart Investing & Trading Score). One can sort Tech stocks (click link to choose) by Daily, Weekly and by Year-to-Date performances. Also, one can sort by size of the company or by market capitalization. |
| Select Your Default Chart Type: | |||||
| |||||
| Click on stock symbol or name for detailed view. Click on to add stock symbol to your watchlist and to view watchlist. Quick View: Move mouse or cursor over "Daily" to quickly view daily technical stock chart and over "Weekly" to view weekly technical stock chart. | |||||


 | TGNA TEGNA Inc |
| Sector: Technology | |
| SubSector: Broadcasting | |
| MarketCap: 3373.6 Millions | |
| Recent Price: 20.30 Smart Investing & Trading Score: 50 | |
| Day Percent Change: 0% Day Change: 0.06 | |
| Week Change: -2.26288% Year-to-date Change: 9.7% | |
| TGNA Links: Profile News Message Board | |
| Charts:- Daily , Weekly | |
| Add TGNA to Watchlist: View: Get Complete TGNA Trend Analysis ➞ | |
 | NXGN NextGen Healthcare, Inc. |
| Sector: Technology | |
| SubSector: Healthcare Information Services | |
| MarketCap: 571.655 Millions | |
| Recent Price: 23.94 Smart Investing & Trading Score: 50 | |
| Day Percent Change: 0% Day Change: -9999 | |
| Week Change: 0.125471% Year-to-date Change: 0.0% | |
| NXGN Links: Profile News Message Board | |
| Charts:- Daily , Weekly | |
| Add NXGN to Watchlist: View: Get Complete NXGN Trend Analysis ➞ | |
 | ZUO Zuora, Inc. |
| Sector: Technology | |
| SubSector: Application Software | |
| MarketCap: 1063.22 Millions | |
| Recent Price: 10.02 Smart Investing & Trading Score: 50 | |
| Day Percent Change: 0% Day Change: -9999 | |
| Week Change: 0.2% Year-to-date Change: 1.0% | |
| ZUO Links: Profile News Message Board | |
| Charts:- Daily , Weekly | |
| Add ZUO to Watchlist: View: Get Complete ZUO Trend Analysis ➞ | |
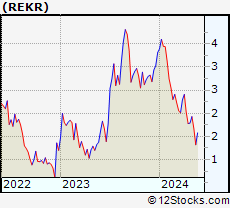 | REKR Rekor Systems Inc |
| Sector: Technology | |
| SubSector: Software - Infrastructure | |
| MarketCap: 137.7 Millions | |
| Recent Price: 1.62 Smart Investing & Trading Score: 50 | |
| Day Percent Change: 0% Day Change: 0.03 | |
| Week Change: -9.49721% Year-to-date Change: -6.9% | |
| REKR Links: Profile News Message Board | |
| Charts:- Daily , Weekly | |
| Add REKR to Watchlist: View: Get Complete REKR Trend Analysis ➞ | |
 | SCPL SciPlay Corporation |
| Sector: Technology | |
| SubSector: Multimedia & Graphics Software | |
| MarketCap: 1280.46 Millions | |
| Recent Price: 22.94 Smart Investing & Trading Score: 50 | |
| Day Percent Change: 0% Day Change: -9999 | |
| Week Change: 0.130947% Year-to-date Change: 0.0% | |
| SCPL Links: Profile News Message Board | |
| Charts:- Daily , Weekly | |
| Add SCPL to Watchlist: View: Get Complete SCPL Trend Analysis ➞ | |
 | AVDX AvidXchange Holdings Inc |
| Sector: Technology | |
| SubSector: Software - Infrastructure | |
| MarketCap: 2064.53 Millions | |
| Recent Price: 9.96 Smart Investing & Trading Score: 50 | |
| Day Percent Change: 0% Day Change: 0 | |
| Week Change: 0.302115% Year-to-date Change: -4.0% | |
| AVDX Links: Profile News Message Board | |
| Charts:- Daily , Weekly | |
| Add AVDX to Watchlist: View: Get Complete AVDX Trend Analysis ➞ | |
 | NVEI Nuvei Corporation |
| Sector: Technology | |
| SubSector: Software - Infrastructure | |
| MarketCap: 5490 Millions | |
| Recent Price: 33.99 Smart Investing & Trading Score: 50 | |
| Day Percent Change: 0% Day Change: -9999 | |
| Week Change: 1.31148% Year-to-date Change: 0.0% | |
| NVEI Links: Profile News Message Board | |
| Charts:- Daily , Weekly | |
| Add NVEI to Watchlist: View: Get Complete NVEI Trend Analysis ➞ | |
 | SCSC Scansource, Inc |
| Sector: Technology | |
| SubSector: Electronics & Computer Distribution | |
| MarketCap: 983.05 Millions | |
| Recent Price: 43.81 Smart Investing & Trading Score: 50 | |
| Day Percent Change: -0.0228206% Day Change: -2.62 | |
| Week Change: -1.63898% Year-to-date Change: -6.8% | |
| SCSC Links: Profile News Message Board | |
| Charts:- Daily , Weekly | |
| Add SCSC to Watchlist: View: Get Complete SCSC Trend Analysis ➞ | |
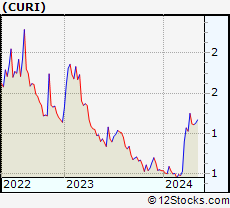 | CURI CuriosityStream Inc |
| Sector: Technology | |
| SubSector: Broadcasting | |
| MarketCap: 264.74 Millions | |
| Recent Price: 5.13 Smart Investing & Trading Score: 50 | |
| Day Percent Change: -0.0972763% Day Change: -0.12 | |
| Week Change: -1.43954% Year-to-date Change: 241.6% | |
| CURI Links: Profile News Message Board | |
| Charts:- Daily , Weekly | |
| Add CURI to Watchlist: View: Get Complete CURI Trend Analysis ➞ | |
 | FOX Fox Corporation |
| Sector: Technology | |
| SubSector: Entertainment | |
| MarketCap: 26097.7 Millions | |
| Recent Price: 55.88 Smart Investing & Trading Score: 50 | |
| Day Percent Change: -0.125112% Day Change: -0.14 | |
| Week Change: 2.90976% Year-to-date Change: 21.5% | |
| FOX Links: Profile News Message Board | |
| Charts:- Daily , Weekly | |
| Add FOX to Watchlist: View: Get Complete FOX Trend Analysis ➞ | |
 | ITI Iteris, Inc. |
| Sector: Technology | |
| SubSector: Communication Equipment | |
| MarketCap: 129.939 Millions | |
| Recent Price: 7.19 Smart Investing & Trading Score: 50 | |
| Day Percent Change: -0.138889% Day Change: -9999 | |
| Week Change: 0.139276% Year-to-date Change: 0.0% | |
| ITI Links: Profile News Message Board | |
| Charts:- Daily , Weekly | |
| Add ITI to Watchlist: View: Get Complete ITI Trend Analysis ➞ | |
 | CRCT Cricut Inc |
| Sector: Technology | |
| SubSector: Computer Hardware | |
| MarketCap: 1259.93 Millions | |
| Recent Price: 6.32 Smart Investing & Trading Score: 50 | |
| Day Percent Change: -0.157978% Day Change: 0.18 | |
| Week Change: -6.37037% Year-to-date Change: 28.8% | |
| CRCT Links: Profile News Message Board | |
| Charts:- Daily , Weekly | |
| Add CRCT to Watchlist: View: Get Complete CRCT Trend Analysis ➞ | |
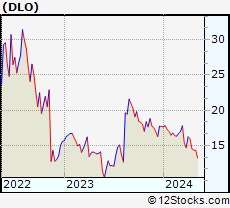 | DLO DLocal Limited |
| Sector: Technology | |
| SubSector: Software - Infrastructure | |
| MarketCap: 4008.6 Millions | |
| Recent Price: 14.03 Smart Investing & Trading Score: 50 | |
| Day Percent Change: -0.213371% Day Change: 0.19 | |
| Week Change: -3.90411% Year-to-date Change: 26.1% | |
| DLO Links: Profile News Message Board | |
| Charts:- Daily , Weekly | |
| Add DLO to Watchlist: View: Get Complete DLO Trend Analysis ➞ | |
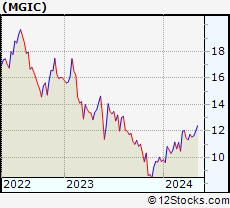 | MGIC Magic Software Enterprises Ltd |
| Sector: Technology | |
| SubSector: Information Technology Services | |
| MarketCap: 964.31 Millions | |
| Recent Price: 20.22 Smart Investing & Trading Score: 50 | |
| Day Percent Change: -0.394089% Day Change: 0.1 | |
| Week Change: 3.74551% Year-to-date Change: 74.4% | |
| MGIC Links: Profile News Message Board | |
| Charts:- Daily , Weekly | |
| Add MGIC to Watchlist: View: Get Complete MGIC Trend Analysis ➞ | |
 | JASO JA Solar Holdings Co., Ltd. |
| Sector: Technology | |
| SubSector: Semiconductor - Specialized | |
| MarketCap: 231.55 Millions | |
| Recent Price: 45.92 Smart Investing & Trading Score: 50 | |
| Day Percent Change: -0.584542% Day Change: -9999 | |
| Week Change: 65.0611% Year-to-date Change: 0.0% | |
| JASO Links: Profile News Message Board | |
| Charts:- Daily , Weekly | |
| Add JASO to Watchlist: View: Get Complete JASO Trend Analysis ➞ | |
 | SIFY Sify Technologies Limited ADR |
| Sector: Technology | |
| SubSector: Telecom Services | |
| MarketCap: 808.15 Millions | |
| Recent Price: 12.70 Smart Investing & Trading Score: 50 | |
| Day Percent Change: -0.625978% Day Change: -0.04 | |
| Week Change: 6.72269% Year-to-date Change: 315.0% | |
| SIFY Links: Profile News Message Board | |
| Charts:- Daily , Weekly | |
| Add SIFY to Watchlist: View: Get Complete SIFY Trend Analysis ➞ | |
 | EXLS ExlService Holdings Inc |
| Sector: Technology | |
| SubSector: Information Technology Services | |
| MarketCap: 7264.86 Millions | |
| Recent Price: 43.43 Smart Investing & Trading Score: 50 | |
| Day Percent Change: -0.640586% Day Change: 0.36 | |
| Week Change: -0.48121% Year-to-date Change: -1.8% | |
| EXLS Links: Profile News Message Board | |
| Charts:- Daily , Weekly | |
| Add EXLS to Watchlist: View: Get Complete EXLS Trend Analysis ➞ | |
 | CNK Cinemark Holdings Inc |
| Sector: Technology | |
| SubSector: Entertainment | |
| MarketCap: 2977.12 Millions | |
| Recent Price: 27.82 Smart Investing & Trading Score: 50 | |
| Day Percent Change: -0.713776% Day Change: -0.4 | |
| Week Change: -2.62513% Year-to-date Change: -9.7% | |
| CNK Links: Profile News Message Board | |
| Charts:- Daily , Weekly | |
| Add CNK to Watchlist: View: Get Complete CNK Trend Analysis ➞ | |
 | CNXC Concentrix Corp |
| Sector: Technology | |
| SubSector: Information Technology Services | |
| MarketCap: 3392.01 Millions | |
| Recent Price: 47.86 Smart Investing & Trading Score: 50 | |
| Day Percent Change: -0.746578% Day Change: -0.59 | |
| Week Change: -13.9209% Year-to-date Change: 11.9% | |
| CNXC Links: Profile News Message Board | |
| Charts:- Daily , Weekly | |
| Add CNXC to Watchlist: View: Get Complete CNXC Trend Analysis ➞ | |
 | ASGN ASGN Inc |
| Sector: Technology | |
| SubSector: Information Technology Services | |
| MarketCap: 2324.47 Millions | |
| Recent Price: 47.90 Smart Investing & Trading Score: 50 | |
| Day Percent Change: -0.766522% Day Change: -0.13 | |
| Week Change: -2.56306% Year-to-date Change: -42.2% | |
| ASGN Links: Profile News Message Board | |
| Charts:- Daily , Weekly | |
| Add ASGN to Watchlist: View: Get Complete ASGN Trend Analysis ➞ | |
 | LILA Liberty Latin America Ltd |
| Sector: Technology | |
| SubSector: Telecom Services | |
| MarketCap: 1630.18 Millions | |
| Recent Price: 8.11 Smart Investing & Trading Score: 50 | |
| Day Percent Change: -0.795594% Day Change: 0.03 | |
| Week Change: 0.433705% Year-to-date Change: 26.6% | |
| LILA Links: Profile News Message Board | |
| Charts:- Daily , Weekly | |
| Add LILA to Watchlist: View: Get Complete LILA Trend Analysis ➞ | |
 | LILAK Liberty Latin America Ltd |
| Sector: Technology | |
| SubSector: Telecom Services | |
| MarketCap: 1630.18 Millions | |
| Recent Price: 8.26 Smart Investing & Trading Score: 50 | |
| Day Percent Change: -0.90036% Day Change: 0.04 | |
| Week Change: 0.182039% Year-to-date Change: 29.6% | |
| LILAK Links: Profile News Message Board | |
| Charts:- Daily , Weekly | |
| Add LILAK to Watchlist: View: Get Complete LILAK Trend Analysis ➞ | |
 | GCI Gannett Co Inc |
| Sector: Technology | |
| SubSector: Publishing | |
| MarketCap: 628.99 Millions | |
| Recent Price: 4.15 Smart Investing & Trading Score: 50 | |
| Day Percent Change: -0.954654% Day Change: 0.11 | |
| Week Change: -4.15704% Year-to-date Change: -18.1% | |
| GCI Links: Profile News Message Board | |
| Charts:- Daily , Weekly | |
| Add GCI to Watchlist: View: Get Complete GCI Trend Analysis ➞ | |
 | SOHU Sohu.com Ltd. ADR |
| Sector: Technology | |
| SubSector: Electronic Gaming & Multimedia | |
| MarketCap: 467.29 Millions | |
| Recent Price: 15.51 Smart Investing & Trading Score: 50 | |
| Day Percent Change: -1.14723% Day Change: 0.27 | |
| Week Change: 1.70492% Year-to-date Change: 20.5% | |
| SOHU Links: Profile News Message Board | |
| Charts:- Daily , Weekly | |
| Add SOHU to Watchlist: View: Get Complete SOHU Trend Analysis ➞ | |
 | LYTS LSI Industries Inc |
| Sector: Technology | |
| SubSector: Electronic Components | |
| MarketCap: 698.8 Millions | |
| Recent Price: 23.45 Smart Investing & Trading Score: 50 | |
| Day Percent Change: -1.15887% Day Change: 1.1 | |
| Week Change: 0.406678% Year-to-date Change: 21.8% | |
| LYTS Links: Profile News Message Board | |
| Charts:- Daily , Weekly | |
| Add LYTS to Watchlist: View: Get Complete LYTS Trend Analysis ➞ | |
| For tabular summary view of above stock list: Summary View ➞ 0 - 25 , 25 - 50 , 50 - 75 , 75 - 100 , 100 - 125 , 125 - 150 , 150 - 175 , 175 - 200 , 200 - 225 , 225 - 250 , 250 - 275 , 275 - 300 , 300 - 325 , 325 - 350 , 350 - 375 , 375 - 400 , 400 - 425 , 425 - 450 , 450 - 475 , 475 - 500 , 500 - 525 , 525 - 550 , 550 - 575 , 575 - 600 , 600 - 625 , 625 - 650 , 650 - 675 , 675 - 700 , 700 - 725 , 725 - 750 , 750 - 775 , 775 - 800 , 800 - 825 , 825 - 850 , 850 - 875 , 875 - 900 | ||
| Click To Change The Sort Order: By Market Cap or Company Size Performance: Year-to-date, Week and Day | |
| Select Chart Type: | ||
|
Best Stocks Today 12Stocks.com |
© 2025 12Stocks.com Terms & Conditions Privacy Contact Us
All Information Provided Only For Education And Not To Be Used For Investing or Trading. See Terms & Conditions


One More Thing ... Get Best Stocks Delivered Daily!
Never Ever Miss A Move With Our Top Ten Stocks Lists
Find Best Stocks In Any Market - Bull or Bear Market
Take A Peek At Our Top Ten Stocks Lists: Daily, Weekly, Year-to-Date & Top Trends
Find Best Stocks In Any Market - Bull or Bear Market
Take A Peek At Our Top Ten Stocks Lists: Daily, Weekly, Year-to-Date & Top Trends
Technology Stocks With Best Up Trends [0-bearish to 100-bullish]: Sony [100], Bakkt [100], Rigetti Computing[100], Fair Isaac[100], Arqit Quantum[100], D-Wave Quantum[100], Navitas Semiconductor[100], Shoals [100], Vuzix [100], Arteris [100], Lantronix [100]
Best Technology Stocks Year-to-Date:
Xunlei [370.476%], Sify [315.033%], Wolfspeed [307.01%], Digital Turbine[265.057%], EchoStar Corp[247.253%], CuriosityStream [241.605%], Viasat [224.029%], Pagaya [222.638%], Oneconnect Financial[209.053%], D-Wave Quantum[203.954%], CommScope Holding[203.101%] Best Technology Stocks This Week:
GTT [443626%], Barracuda Networks[71050%], Mobile TeleSystems[10483.5%], Nam Tai[5033.33%], Ebix [4200.85%], Fang [4150%], NantHealth [3114.02%], Hemisphere Media[2981.82%], Yandex N.V[2935.27%], Wolfspeed [1961.98%], Castlight Health[1751.96%] Best Technology Stocks Daily:
Sony [194.565%], Bakkt [28.6091%], Rigetti Computing[18.4925%], Fair Isaac[17.979%], Arqit Quantum[17.9369%], Marti [17%], Latch [16.6667%], Oclaro [14.734%], D-Wave Quantum[13.968%], Arbe Robotics[13.0178%], Navitas Semiconductor[12.3288%]