
 Login Sign Up


| |||||
 |  | ||||

| 12Stocks.com Market Intelligence |
Best SmallCap Stocks
|
| In a hurry? Small Cap Stock Lists: Performance Trends Table, Stock Charts
Sort Small Cap stocks: Daily, Weekly, Year-to-Date, Market Cap & Trends. Filter Small Cap stocks list by sector: Show all, Tech, Finance, Energy, Staples, Retail, Industrial, Materials, Utilities and HealthCare Filter Small Cap stocks list by size: All Large Medium Small and MicroCap |
| 12Stocks.com Small Cap Stocks Performances & Trends Daily | |||||||||
|
|  The overall Smart Investing & Trading Score is 14 (0-bearish to 100-bullish) which puts Small Cap index in short term bearish trend. The Smart Investing & Trading Score from previous trading session is 41 and hence a deterioration of trend.
| ||||||||
Here are the Smart Investing & Trading Scores of the most requested small cap stocks at 12Stocks.com (click stock name for detailed review):
|


| 12Stocks.com: Investing in Smallcap Index with Stocks | |
|
The following table helps investors and traders sort through current performance and trends (as measured by Smart Investing & Trading Score) of various
stocks in the Smallcap Index. Quick View: Move mouse or cursor over stock symbol (ticker) to view short-term technical chart and over stock name to view long term chart. Click on  to add stock symbol to your watchlist and to add stock symbol to your watchlist and  to view watchlist. Click on any ticker or stock name for detailed market intelligence report for that stock. to view watchlist. Click on any ticker or stock name for detailed market intelligence report for that stock. |
12Stocks.com Performance of Stocks in Smallcap Index
| Ticker | Stock Name | Watchlist | Category | Recent Price | Smart Investing & Trading Score | Change % | Weekly Change% |
| NTST | NetSTREIT |   | Financials | 17.00 | 54 | 0.89% | 0.00% |
| SLQT | SelectQuote | | Financials | 1.61 | 15 | 6.62% | 0.00% |
| NWLI | National Western | | Financials | 488.20 | 55 | -0.13% | -0.02% |
| TRMK | Trustmark | | Financials | 30.04 | 88 | 1.49% | -0.03% |
| ASB | Associated Banc-Corp | | Financials | 21.56 | 80 | 2.33% | -0.05% |
| SBRA | Sabra Health | | Financials | 13.93 | 63 | 0.07% | -0.07% |
| HTBI | HomeTrust Bancshares | | Financials | 26.06 | 65 | 1.40% | -0.08% |
| AOMR | Angel Oak | | Financials | 10.88 | 56 | 3.32% | -0.09% |
| CHCO | City Holding | | Financials | 103.98 | 81 | 2.93% | -0.12% |
| CHMG | Chemung Financial | | Financials | 42.98 | 52 | 1.93% | -0.19% |
| NNI | Nelnet | | Financials | 94.62 | 75 | 0.47% | -0.21% |
| MCBC | Macatawa Bank | | Financials | 14.21 | 68 | 1.50% | -0.21% |
| NBHC | National Bank | | Financials | 33.43 | 42 | 2.14% | -0.21% |
| CCBG | Capital City | | Financials | 26.96 | 48 | 1.66% | -0.22% |
| UBSI | United Bankshares | | Financials | 33.27 | 42 | 2.50% | -0.24% |
| CCNE | CNB Financial | | Financials | 19.02 | 35 | 0.11% | -0.26% |
| AEL | American Equity | | Financials | 56.16 | 66 | 0.09% | -0.27% |
| VLY | Valley National | | Financials | 7.30 | 35 | 4.14% | -0.27% |
| NYMT | New York | | Financials | 7.02 | 42 | 2.48% | -0.28% |
| STBA | S&T Bancorp | | Financials | 30.89 | 50 | 2.45% | -0.29% |
| MPB | Mid Penn | | Financials | 20.80 | 50 | 0.31% | -0.29% |
| LXP | Lexington Realty | | Financials | 8.45 | 35 | 1.20% | -0.35% |
| SYBT | Stock Yards | | Financials | 45.99 | 73 | 3.23% | -0.35% |
| PEBO | Peoples Bancorp | | Financials | 29.65 | 73 | 2.10% | -0.37% |
| PFS | Provident Financial | | Financials | 15.02 | 63 | 2.32% | -0.46% |
| For chart view version of above stock list: Chart View ➞ 0 - 25 , 25 - 50 , 50 - 75 , 75 - 100 , 100 - 125 , 125 - 150 , 150 - 175 , 175 - 200 , 200 - 225 , 225 - 250 , 250 - 275 , 275 - 300 , 300 - 325 , 325 - 350 , 350 - 375 , 375 - 400 | ||
 | Click To Change The Sort Order: By Market Cap or Company Size Performance: Year-to-date, Week and Day |  |
| Too many stocks? View smallcap stocks filtered by marketcap & sector |
| Marketcap: All SmallCap Stocks (default-no microcap), Large, Mid-Range, Small |
| Smallcap Sector: Tech, Finance, Energy, Staples, Retail, Industrial, Materials, & Medical |
|
Get the most comprehensive stock market coverage daily at 12Stocks.com ➞ Best Stocks Today ➞ Best Stocks Weekly ➞ Best Stocks Year-to-Date ➞ Best Stocks Trends ➞  Best Stocks Today 12Stocks.com Best Nasdaq Stocks ➞ Best S&P 500 Stocks ➞ Best Tech Stocks ➞ Best Biotech Stocks ➞ |
| Detailed Overview of SmallCap Stocks |
| SmallCap Technical Overview, Leaders & Laggards, Top SmallCap ETF Funds & Detailed SmallCap Stocks List, Charts, Trends & More |
| Smallcap: Technical Analysis, Trends & YTD Performance | |
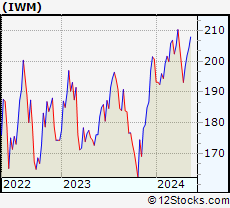
| SmallCap segment as represented by
IWM, an exchange-traded fund [ETF], holds basket of thousands of smallcap stocks from across all major sectors of the US stock market. The smallcap index (contains stocks like Riverbed & Sotheby's) is down by -2.19% and is currently underperforming the overall market by -6.73% year-to-date. Below is a quick view of technical charts and trends: | |
 IWM Weekly Chart |
|
| Long Term Trend: Not Good | |
| Medium Term Trend: Not Good | |
 IWM Daily Chart |
|
| Short Term Trend: Not Good | |
| Overall Trend Score: 14 | |
| YTD Performance: -2.19% | |
| **Trend Scores & Views Are Only For Educational Purposes And Not For Investing | |
| 12Stocks.com: Top Performing Small Cap Index Stocks | ||||||||||||||||||||||||||||||||||||||||||||||||
 The top performing Small Cap Index stocks year to date are
Now, more recently, over last week, the top performing Small Cap Index stocks on the move are


|
||||||||||||||||||||||||||||||||||||||||||||||||
| 12Stocks.com: Investing in Smallcap Index using Exchange Traded Funds | |
|
The following table shows list of key exchange traded funds (ETF) that
help investors track Smallcap index. The following list also includes leveraged ETF funds that track twice or thrice the daily returns of Smallcap indices. Short or inverse ETF funds move in the opposite direction to the index they track and are useful during market pullbacks or during bear markets. Quick View: Move mouse or cursor over ETF symbol (ticker) to view short-term technical chart and over ETF name to view long term chart. Click on ticker or stock name for detailed view. Click on to add stock symbol to your watchlist and to view watchlist. |
12Stocks.com List of ETFs that track Smallcap Index
| Ticker | ETF Name | Watchlist | Recent Price | Smart Investing & Trading Score | Change % | Week % | Year-to-date % |
| IWM | iShares Russell 2000 | | 196.31 | 14 | 0.21 | -1.05 | -2.19% |
| IJR | iShares Core S&P Small-Cap | | 104.74 | 22 | 0.34 | -0.86 | -3.24% |
| VTWO | Vanguard Russell 2000 ETF | | 79.36 | 14 | 0.25 | -1.07 | -2.15% |
| IWN | iShares Russell 2000 Value | | 149.82 | 22 | 0.52 | -0.87 | -3.55% |
| IJS | iShares S&P Small-Cap 600 Value | | 96.40 | 15 | 0.33 | -0.81 | -6.47% |
| IWO | iShares Russell 2000 Growth | | 249.58 | 7 | -0.30 | -1.39 | -1.05% |
| IJT | iShares S&P Small-Cap 600 Growth | | 124.94 | 15 | 0.27 | -0.91 | -0.16% |
| XSLV | PowerShares S&P SmallCap Low Volatil ETF | | 42.83 | 52 | 0.68 | 0.26 | -2.99% |
| SDD | ProShares UltraShort SmallCap600 | | 19.71 | 78 | 0.70 | 1.85 | 6.95% |
| SMLV | SPDR SSGA US Small Cap Low Volatil ETF | | 107.44 | 40 | 1.11 | -0.07 | -4.51% |
| SBB | ProShares Short SmallCap600 | | 16.56 | 71 | 0.05 | 1.06 | 3.94% |
| SAA | ProShares Ultra SmallCap600 | | 22.58 | 8 | -0.08 | -1.99 | -9.49% |
| 12Stocks.com: Charts, Trends, Fundamental Data and Performances of SmallCap Stocks | |
|
We now take in-depth look at all SmallCap stocks including charts, multi-period performances and overall trends (as measured by Smart Investing & Trading Score). One can sort SmallCap stocks (click link to choose) by Daily, Weekly and by Year-to-Date performances. Also, one can sort by size of the company or by market capitalization. |
| Select Your Default Chart Type: | |||||
| |||||
| Click on stock symbol or name for detailed view. Click on to add stock symbol to your watchlist and to view watchlist. Quick View: Move mouse or cursor over "Daily" to quickly view daily technical stock chart and over "Weekly" to view weekly technical stock chart. | |||||

 | NTST NetSTREIT Corp. |
| Sector: Financials | |
| SubSector: REIT Retail | |
| MarketCap: 51267 Millions | |
| Recent Price: 17.00 Smart Investing & Trading Score: 54 | |
| Day Percent Change: 0.89% Day Change: 0.15 | |
| Week Change: 0% Year-to-date Change: -4.8% | |
| NTST Links: Profile News Message Board | |
| Charts:- Daily , Weekly | |
| Add NTST to Watchlist: View: Get Complete NTST Trend Analysis ➞ | |
 | SLQT SelectQuote, Inc. |
| Sector: Financials | |
| SubSector: Insurance Brokers | |
| MarketCap: 38257 Millions | |
| Recent Price: 1.61 Smart Investing & Trading Score: 15 | |
| Day Percent Change: 6.62% Day Change: 0.10 | |
| Week Change: 0% Year-to-date Change: 17.5% | |
| SLQT Links: Profile News Message Board | |
| Charts:- Daily , Weekly | |
| Add SLQT to Watchlist: View: Get Complete SLQT Trend Analysis ➞ | |
 | NWLI National Western Life Group, Inc. |
| Sector: Financials | |
| SubSector: Life Insurance | |
| MarketCap: 529 Millions | |
| Recent Price: 488.20 Smart Investing & Trading Score: 55 | |
| Day Percent Change: -0.13% Day Change: -0.62 | |
| Week Change: -0.02% Year-to-date Change: 1.1% | |
| NWLI Links: Profile News Message Board | |
| Charts:- Daily , Weekly | |
| Add NWLI to Watchlist: View: Get Complete NWLI Trend Analysis ➞ | |
 | TRMK Trustmark Corporation |
| Sector: Financials | |
| SubSector: Regional - Southeast Banks | |
| MarketCap: 1630.15 Millions | |
| Recent Price: 30.04 Smart Investing & Trading Score: 88 | |
| Day Percent Change: 1.49% Day Change: 0.44 | |
| Week Change: -0.03% Year-to-date Change: 7.8% | |
| TRMK Links: Profile News Message Board | |
| Charts:- Daily , Weekly | |
| Add TRMK to Watchlist: View: Get Complete TRMK Trend Analysis ➞ | |
 | ASB Associated Banc-Corp |
| Sector: Financials | |
| SubSector: Regional - Midwest Banks | |
| MarketCap: 1904.8 Millions | |
| Recent Price: 21.56 Smart Investing & Trading Score: 80 | |
| Day Percent Change: 2.33% Day Change: 0.49 | |
| Week Change: -0.05% Year-to-date Change: 0.8% | |
| ASB Links: Profile News Message Board | |
| Charts:- Daily , Weekly | |
| Add ASB to Watchlist: View: Get Complete ASB Trend Analysis ➞ | |
 | SBRA Sabra Health Care REIT, Inc. |
| Sector: Financials | |
| SubSector: REIT - Healthcare Facilities | |
| MarketCap: 2576.54 Millions | |
| Recent Price: 13.93 Smart Investing & Trading Score: 63 | |
| Day Percent Change: 0.07% Day Change: 0.01 | |
| Week Change: -0.07% Year-to-date Change: -2.4% | |
| SBRA Links: Profile News Message Board | |
| Charts:- Daily , Weekly | |
| Add SBRA to Watchlist: View: Get Complete SBRA Trend Analysis ➞ | |
 | HTBI HomeTrust Bancshares, Inc. |
| Sector: Financials | |
| SubSector: Regional - Northeast Banks | |
| MarketCap: 238.899 Millions | |
| Recent Price: 26.06 Smart Investing & Trading Score: 65 | |
| Day Percent Change: 1.40% Day Change: 0.36 | |
| Week Change: -0.08% Year-to-date Change: -3.2% | |
| HTBI Links: Profile News Message Board | |
| Charts:- Daily , Weekly | |
| Add HTBI to Watchlist: View: Get Complete HTBI Trend Analysis ➞ | |
 | AOMR Angel Oak Mortgage REIT, Inc. |
| Sector: Financials | |
| SubSector: REIT - Mortgage | |
| MarketCap: 202 Millions | |
| Recent Price: 10.88 Smart Investing & Trading Score: 56 | |
| Day Percent Change: 3.32% Day Change: 0.35 | |
| Week Change: -0.09% Year-to-date Change: 2.5% | |
| AOMR Links: Profile News Message Board | |
| Charts:- Daily , Weekly | |
| Add AOMR to Watchlist: View: Get Complete AOMR Trend Analysis ➞ | |
 | CHCO City Holding Company |
| Sector: Financials | |
| SubSector: Regional - Mid-Atlantic Banks | |
| MarketCap: 1059.59 Millions | |
| Recent Price: 103.98 Smart Investing & Trading Score: 81 | |
| Day Percent Change: 2.93% Day Change: 2.96 | |
| Week Change: -0.12% Year-to-date Change: -5.7% | |
| CHCO Links: Profile News Message Board | |
| Charts:- Daily , Weekly | |
| Add CHCO to Watchlist: View: Get Complete CHCO Trend Analysis ➞ | |
 | CHMG Chemung Financial Corporation |
| Sector: Financials | |
| SubSector: Regional - Pacific Banks | |
| MarketCap: 142.229 Millions | |
| Recent Price: 42.98 Smart Investing & Trading Score: 52 | |
| Day Percent Change: 1.93% Day Change: 0.81 | |
| Week Change: -0.19% Year-to-date Change: -13.7% | |
| CHMG Links: Profile News Message Board | |
| Charts:- Daily , Weekly | |
| Add CHMG to Watchlist: View: Get Complete CHMG Trend Analysis ➞ | |
 | NNI Nelnet, Inc. |
| Sector: Financials | |
| SubSector: Credit Services | |
| MarketCap: 1664.38 Millions | |
| Recent Price: 94.62 Smart Investing & Trading Score: 75 | |
| Day Percent Change: 0.47% Day Change: 0.44 | |
| Week Change: -0.21% Year-to-date Change: 7.3% | |
| NNI Links: Profile News Message Board | |
| Charts:- Daily , Weekly | |
| Add NNI to Watchlist: View: Get Complete NNI Trend Analysis ➞ | |
 | MCBC Macatawa Bank Corporation |
| Sector: Financials | |
| SubSector: Regional - Midwest Banks | |
| MarketCap: 264.37 Millions | |
| Recent Price: 14.21 Smart Investing & Trading Score: 68 | |
| Day Percent Change: 1.50% Day Change: 0.21 | |
| Week Change: -0.21% Year-to-date Change: 26.0% | |
| MCBC Links: Profile News Message Board | |
| Charts:- Daily , Weekly | |
| Add MCBC to Watchlist: View: Get Complete MCBC Trend Analysis ➞ | |
 | NBHC National Bank Holdings Corporation |
| Sector: Financials | |
| SubSector: Regional - Midwest Banks | |
| MarketCap: 766.87 Millions | |
| Recent Price: 33.43 Smart Investing & Trading Score: 42 | |
| Day Percent Change: 2.14% Day Change: 0.70 | |
| Week Change: -0.21% Year-to-date Change: -10.1% | |
| NBHC Links: Profile News Message Board | |
| Charts:- Daily , Weekly | |
| Add NBHC to Watchlist: View: Get Complete NBHC Trend Analysis ➞ | |
 | CCBG Capital City Bank Group, Inc. |
| Sector: Financials | |
| SubSector: Regional - Mid-Atlantic Banks | |
| MarketCap: 314.459 Millions | |
| Recent Price: 26.96 Smart Investing & Trading Score: 48 | |
| Day Percent Change: 1.66% Day Change: 0.44 | |
| Week Change: -0.22% Year-to-date Change: -8.4% | |
| CCBG Links: Profile News Message Board | |
| Charts:- Daily , Weekly | |
| Add CCBG to Watchlist: View: Get Complete CCBG Trend Analysis ➞ | |
 | UBSI United Bankshares, Inc. |
| Sector: Financials | |
| SubSector: Regional - Mid-Atlantic Banks | |
| MarketCap: 2286.79 Millions | |
| Recent Price: 33.27 Smart Investing & Trading Score: 42 | |
| Day Percent Change: 2.50% Day Change: 0.81 | |
| Week Change: -0.24% Year-to-date Change: -11.4% | |
| UBSI Links: Profile News Message Board | |
| Charts:- Daily , Weekly | |
| Add UBSI to Watchlist: View: Get Complete UBSI Trend Analysis ➞ | |
 | CCNE CNB Financial Corporation |
| Sector: Financials | |
| SubSector: Regional - Northeast Banks | |
| MarketCap: 286.599 Millions | |
| Recent Price: 19.02 Smart Investing & Trading Score: 35 | |
| Day Percent Change: 0.11% Day Change: 0.02 | |
| Week Change: -0.26% Year-to-date Change: -15.8% | |
| CCNE Links: Profile News Message Board | |
| Charts:- Daily , Weekly | |
| Add CCNE to Watchlist: View: Get Complete CCNE Trend Analysis ➞ | |
 | AEL American Equity Investment Life Holding Company |
| Sector: Financials | |
| SubSector: Life Insurance | |
| MarketCap: 1304.46 Millions | |
| Recent Price: 56.16 Smart Investing & Trading Score: 66 | |
| Day Percent Change: 0.09% Day Change: 0.05 | |
| Week Change: -0.27% Year-to-date Change: 0.7% | |
| AEL Links: Profile News Message Board | |
| Charts:- Daily , Weekly | |
| Add AEL to Watchlist: View: Get Complete AEL Trend Analysis ➞ | |
 | VLY Valley National Bancorp |
| Sector: Financials | |
| SubSector: Regional - Northeast Banks | |
| MarketCap: 2843.09 Millions | |
| Recent Price: 7.30 Smart Investing & Trading Score: 35 | |
| Day Percent Change: 4.14% Day Change: 0.29 | |
| Week Change: -0.27% Year-to-date Change: -32.8% | |
| VLY Links: Profile News Message Board | |
| Charts:- Daily , Weekly | |
| Add VLY to Watchlist: View: Get Complete VLY Trend Analysis ➞ | |
 | NYMT New York Mortgage Trust, Inc. |
| Sector: Financials | |
| SubSector: Mortgage Investment | |
| MarketCap: 1038.39 Millions | |
| Recent Price: 7.02 Smart Investing & Trading Score: 42 | |
| Day Percent Change: 2.48% Day Change: 0.17 | |
| Week Change: -0.28% Year-to-date Change: -17.7% | |
| NYMT Links: Profile News Message Board | |
| Charts:- Daily , Weekly | |
| Add NYMT to Watchlist: View: Get Complete NYMT Trend Analysis ➞ | |
 | STBA S&T Bancorp, Inc. |
| Sector: Financials | |
| SubSector: Regional - Northeast Banks | |
| MarketCap: 1136.99 Millions | |
| Recent Price: 30.89 Smart Investing & Trading Score: 50 | |
| Day Percent Change: 2.45% Day Change: 0.74 | |
| Week Change: -0.29% Year-to-date Change: -7.6% | |
| STBA Links: Profile News Message Board | |
| Charts:- Daily , Weekly | |
| Add STBA to Watchlist: View: Get Complete STBA Trend Analysis ➞ | |
 | MPB Mid Penn Bancorp, Inc. |
| Sector: Financials | |
| SubSector: Regional - Northeast Banks | |
| MarketCap: 187.699 Millions | |
| Recent Price: 20.80 Smart Investing & Trading Score: 50 | |
| Day Percent Change: 0.31% Day Change: 0.07 | |
| Week Change: -0.29% Year-to-date Change: -14.3% | |
| MPB Links: Profile News Message Board | |
| Charts:- Daily , Weekly | |
| Add MPB to Watchlist: View: Get Complete MPB Trend Analysis ➞ | |
 | LXP Lexington Realty Trust |
| Sector: Financials | |
| SubSector: REIT - Diversified | |
| MarketCap: 2483.43 Millions | |
| Recent Price: 8.45 Smart Investing & Trading Score: 35 | |
| Day Percent Change: 1.20% Day Change: 0.10 | |
| Week Change: -0.35% Year-to-date Change: -14.8% | |
| LXP Links: Profile News Message Board | |
| Charts:- Daily , Weekly | |
| Add LXP to Watchlist: View: Get Complete LXP Trend Analysis ➞ | |
 | SYBT Stock Yards Bancorp, Inc. |
| Sector: Financials | |
| SubSector: Regional - Southeast Banks | |
| MarketCap: 629.235 Millions | |
| Recent Price: 45.99 Smart Investing & Trading Score: 73 | |
| Day Percent Change: 3.23% Day Change: 1.44 | |
| Week Change: -0.35% Year-to-date Change: -10.7% | |
| SYBT Links: Profile News Message Board | |
| Charts:- Daily , Weekly | |
| Add SYBT to Watchlist: View: Get Complete SYBT Trend Analysis ➞ | |
 | PEBO Peoples Bancorp Inc. |
| Sector: Financials | |
| SubSector: Regional - Midwest Banks | |
| MarketCap: 449.77 Millions | |
| Recent Price: 29.65 Smart Investing & Trading Score: 73 | |
| Day Percent Change: 2.10% Day Change: 0.61 | |
| Week Change: -0.37% Year-to-date Change: -12.2% | |
| PEBO Links: Profile News Message Board | |
| Charts:- Daily , Weekly | |
| Add PEBO to Watchlist: View: Get Complete PEBO Trend Analysis ➞ | |
 | PFS Provident Financial Services, Inc. |
| Sector: Financials | |
| SubSector: Savings & Loans | |
| MarketCap: 829.73 Millions | |
| Recent Price: 15.02 Smart Investing & Trading Score: 63 | |
| Day Percent Change: 2.32% Day Change: 0.34 | |
| Week Change: -0.46% Year-to-date Change: -16.7% | |
| PFS Links: Profile News Message Board | |
| Charts:- Daily , Weekly | |
| Add PFS to Watchlist: View: Get Complete PFS Trend Analysis ➞ | |
| For tabular summary view of above stock list: Summary View ➞ 0 - 25 , 25 - 50 , 50 - 75 , 75 - 100 , 100 - 125 , 125 - 150 , 150 - 175 , 175 - 200 , 200 - 225 , 225 - 250 , 250 - 275 , 275 - 300 , 300 - 325 , 325 - 350 , 350 - 375 , 375 - 400 | ||
| Click To Change The Sort Order: By Market Cap or Company Size Performance: Year-to-date, Week and Day | |
| Select Chart Type: | ||
| Too many stocks? View smallcap stocks filtered by marketcap & sector |
| Marketcap: All SmallCap Stocks (default-no microcap), Large, Mid-Range, Small & MicroCap |
| Sector: Tech, Finance, Energy, Staples, Retail, Industrial, Materials, Utilities & Medical |
|
Best Stocks Today 12Stocks.com |
© 2024 12Stocks.com Terms & Conditions Privacy Contact Us
All Information Provided Only For Education And Not To Be Used For Investing or Trading. See Terms & Conditions


One More Thing ... Get Best Stocks Delivered Daily!
Never Ever Miss A Move With Our Top Ten Stocks Lists
Find Best Stocks In Any Market - Bull or Bear Market
Take A Peek At Our Top Ten Stocks Lists: Daily, Weekly, Year-to-Date & Top Trends
Find Best Stocks In Any Market - Bull or Bear Market
Take A Peek At Our Top Ten Stocks Lists: Daily, Weekly, Year-to-Date & Top Trends
Smallcap Stocks With Best Up Trends [0-bearish to 100-bullish]: Surmodics [100], Rocky Brands[100], TransMedics Group[100], LendingClub [100], Summit [100], A10 s[100], Carpenter [100], UFP [100], PROCEPT BioRobotics[100], Xencor [100], Trinity Industries[100]
Best Smallcap Stocks Year-to-Date:
Janux [441.55%], Viking [310.69%], Longboard [259.25%], Alpine Immune[239.29%], Avidity Biosciences[185.4%], Bakkt [182.96%], Cullinan Oncology[175.33%], Arcutis Bio[173.68%], Vera [173.32%], Super Micro[159.73%], Y-mAbs [141.79%] Best Smallcap Stocks This Week:
Deciphera [73.11%], Eyenovia [45.65%], Cue Biopharma[39.56%], Seres [30.91%], Poseida [30.05%], P3 Health[29.62%], Phibro Animal[28.44%], TransMedics Group[27.72%], Surmodics [27.36%], LendingTree [26.36%], Rocky Brands[24.92%] Best Smallcap Stocks Daily:
Surmodics [29.74%], Rocky Brands[28.41%], TransMedics Group[24.93%], Ventyx Biosciences[24.63%], Eyenovia [21.84%], LendingClub [19.68%], Summit [19.59%], Powell Industries[18.89%], MiMedx Group[18.67%], CareDx [18.30%], A10 s[17.69%]