
 Login Sign Up


| |||||
 |  | ||||

| 12Stocks.com Market Intelligence |
Best SmallCap Stocks
|
| In a hurry? Small Cap Stock Lists: Performance Trends Table, Stock Charts
Sort Small Cap stocks: Daily, Weekly, Year-to-Date, Market Cap & Trends. Filter Small Cap stocks list by sector: Show all, Tech, Finance, Energy, Staples, Retail, Industrial, Materials, Utilities and HealthCare Filter Small Cap stocks list by size: All Large Medium Small and MicroCap |
| 12Stocks.com Small Cap Stocks Performances & Trends Daily | |||||||||
|
|  The overall Smart Investing & Trading Score is 90 (0-bearish to 100-bullish) which puts Small Cap index in short term bullish trend. The Smart Investing & Trading Score from previous trading session is 100 and hence a deterioration of trend.
| ||||||||
Here are the Smart Investing & Trading Scores of the most requested small cap stocks at 12Stocks.com (click stock name for detailed review):
|


| 12Stocks.com: Investing in Smallcap Index with Stocks | |
|
The following table helps investors and traders sort through current performance and trends (as measured by Smart Investing & Trading Score) of various
stocks in the Smallcap Index. Quick View: Move mouse or cursor over stock symbol (ticker) to view short-term technical chart and over stock name to view long term chart. Click on  to add stock symbol to your watchlist and to add stock symbol to your watchlist and  to view watchlist. Click on any ticker or stock name for detailed market intelligence report for that stock. to view watchlist. Click on any ticker or stock name for detailed market intelligence report for that stock. |
12Stocks.com Performance of Stocks in Smallcap Index
| Ticker | Stock Name | Watchlist | Category | Recent Price | Smart Investing & Trading Score | Change % | Weekly Change% |
| CTRE | CareTrust REIT |   | Financials | 24.87 | 68 | 0.16% | 0.73% |
| SFBS | ServisFirst Bancshares | | Financials | 65.24 | 83 | -1.26% | 0.73% |
| DRH | DiamondRock Hospitality | | Financials | 8.57 | 18 | 1.66% | 0.71% |
| BBUC | Brookfield Business | | Financials | 21.56 | 64 | -0.78% | 0.70% |
| MCY | Mercury General | | Financials | 57.96 | 90 | 0.96% | 0.69% |
| LCNB | LCNB | | Financials | 14.75 | 78 | 0.34% | 0.68% |
| RBCAA | Republic Bancorp | | Financials | 54.30 | 90 | 0.11% | 0.67% |
| UVSP | Univest Financial | | Financials | 22.80 | 83 | 0.31% | 0.66% |
| WSFS | WSFS Financial | | Financials | 46.48 | 83 | 0.13% | 0.65% |
| CVBF | CVB Financial | | Financials | 17.33 | 90 | -0.12% | 0.64% |
| ORRF | Orrstown Financial | | Financials | 26.82 | 67 | 0.19% | 0.64% |
| HBNC | Horizon Bancorp | | Financials | 12.73 | 83 | 0.87% | 0.63% |
| SRCE | 1st Source | | Financials | 52.68 | 83 | 0.23% | 0.53% |
| COOP | Mr. Cooper | | Financials | 84.22 | 100 | 1.34% | 0.53% |
| CZNC | Citizens & Northern | | Financials | 17.98 | 67 | -0.28% | 0.50% |
| TCBX | Third Coast | | Financials | 21.32 | 73 | 1.09% | 0.47% |
| CHMG | Chemung Financial | | Financials | 43.50 | 93 | -0.46% | 0.46% |
| FMBH | First Mid | | Financials | 33.00 | 83 | -0.63% | 0.46% |
| SBSI | Southside Bancshares | | Financials | 28.09 | 62 | 0.25% | 0.43% |
| BLX | Banco Latinoamericano | | Financials | 30.50 | 78 | 2.69% | 0.43% |
| PGRE | Paramount Group | | Financials | 4.80 | 68 | -1.23% | 0.42% |
| NAVI | Navient | | Financials | 15.54 | 0 | -0.38% | 0.39% |
| EPRT | Essential Properties | | Financials | 27.21 | 88 | -1.20% | 0.39% |
| CASH | Meta Financial | | Financials | 54.17 | 83 | 0.30% | 0.37% |
| TCI | Transcontinental Realty | | Financials | 28.45 | 35 | 0.14% | 0.35% |
| For chart view version of above stock list: Chart View ➞ 0 - 25 , 25 - 50 , 50 - 75 , 75 - 100 , 100 - 125 , 125 - 150 , 150 - 175 , 175 - 200 , 200 - 225 , 225 - 250 , 250 - 275 , 275 - 300 , 300 - 325 , 325 - 350 , 350 - 375 , 375 - 400 | ||
 | Click To Change The Sort Order: By Market Cap or Company Size Performance: Year-to-date, Week and Day |  |
| Too many stocks? View smallcap stocks filtered by marketcap & sector |
| Marketcap: All SmallCap Stocks (default-no microcap), Large, Mid-Range, Small |
| Smallcap Sector: Tech, Finance, Energy, Staples, Retail, Industrial, Materials, & Medical |
|
Get the most comprehensive stock market coverage daily at 12Stocks.com ➞ Best Stocks Today ➞ Best Stocks Weekly ➞ Best Stocks Year-to-Date ➞ Best Stocks Trends ➞  Best Stocks Today 12Stocks.com Best Nasdaq Stocks ➞ Best S&P 500 Stocks ➞ Best Tech Stocks ➞ Best Biotech Stocks ➞ |
| Detailed Overview of SmallCap Stocks |
| SmallCap Technical Overview, Leaders & Laggards, Top SmallCap ETF Funds & Detailed SmallCap Stocks List, Charts, Trends & More |
| Smallcap: Technical Analysis, Trends & YTD Performance | |
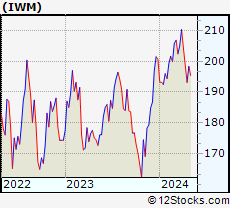
| SmallCap segment as represented by
IWM, an exchange-traded fund [ETF], holds basket of thousands of smallcap stocks from across all major sectors of the US stock market. The smallcap index (contains stocks like Riverbed & Sotheby's) is up by 3.6% and is currently underperforming the overall market by -6.82% year-to-date. Below is a quick view of technical charts and trends: | |
 IWM Weekly Chart |
|
| Long Term Trend: Very Good | |
| Medium Term Trend: Very Good | |
 IWM Daily Chart |
|
| Short Term Trend: Good | |
| Overall Trend Score: 90 | |
| YTD Performance: 3.6% | |
| **Trend Scores & Views Are Only For Educational Purposes And Not For Investing | |
| 12Stocks.com: Top Performing Small Cap Index Stocks | ||||||||||||||||||||||||||||||||||||||||||||||||
 The top performing Small Cap Index stocks year to date are
Now, more recently, over last week, the top performing Small Cap Index stocks on the move are


|
||||||||||||||||||||||||||||||||||||||||||||||||
| 12Stocks.com: Investing in Smallcap Index using Exchange Traded Funds | |
|
The following table shows list of key exchange traded funds (ETF) that
help investors track Smallcap index. The following list also includes leveraged ETF funds that track twice or thrice the daily returns of Smallcap indices. Short or inverse ETF funds move in the opposite direction to the index they track and are useful during market pullbacks or during bear markets. Quick View: Move mouse or cursor over ETF symbol (ticker) to view short-term technical chart and over ETF name to view long term chart. Click on ticker or stock name for detailed view. Click on to add stock symbol to your watchlist and to view watchlist. |
12Stocks.com List of ETFs that track Smallcap Index
| Ticker | ETF Name | Watchlist | Recent Price | Smart Investing & Trading Score | Change % | Week % | Year-to-date % |
| IWM | iShares Russell 2000 | | 207.93 | 90 | -0.72 | 1.77 | 3.6% |
| VTWO | Vanguard Russell 2000 ETF | | 84.11 | 90 | -0.61 | 1.8 | 3.71% |
| IJR | iShares Core S&P Small-Cap | | 110.63 | 83 | -0.14 | 1.51 | 2.2% |
| IWN | iShares Russell 2000 Value | | 158.82 | 88 | 0.06 | 1.68 | 2.25% |
| IJT | iShares S&P Small-Cap 600 Growth | | 131.29 | 83 | -0.69 | 1.1 | 4.91% |
| IJS | iShares S&P Small-Cap 600 Value | | 102.02 | 83 | -0.11 | 1.49 | -1.02% |
| IWO | iShares Russell 2000 Growth | | 267.15 | 95 | 0.21 | 2.78 | 5.92% |
| XSLV | PowerShares S&P SmallCap Low Volatil ETF | | 44.48 | 76 | -0.02 | 0.57 | 0.75% |
| SBB | ProShares Short SmallCap600 | | 15.71 | 17 | 0.32 | -1.54 | -1.38% |
| SAA | ProShares Ultra SmallCap600 | | 24.78 | 78 | -1.69 | 1.77 | -0.68% |
| SMLV | SPDR SSGA US Small Cap Low Volatil ETF | | 112.79 | 95 | 0.22 | 1.41 | 0.24% |
| SDD | ProShares UltraShort SmallCap600 | | 17.67 | 27 | 0.00 | -3.34 | -4.11% |
| 12Stocks.com: Charts, Trends, Fundamental Data and Performances of SmallCap Stocks | |
|
We now take in-depth look at all SmallCap stocks including charts, multi-period performances and overall trends (as measured by Smart Investing & Trading Score). One can sort SmallCap stocks (click link to choose) by Daily, Weekly and by Year-to-Date performances. Also, one can sort by size of the company or by market capitalization. |
| Select Your Default Chart Type: | |||||
| |||||
| Click on stock symbol or name for detailed view. Click on to add stock symbol to your watchlist and to view watchlist. Quick View: Move mouse or cursor over "Daily" to quickly view daily technical stock chart and over "Weekly" to view weekly technical stock chart. | |||||

 | CTRE CareTrust REIT, Inc. |
| Sector: Financials | |
| SubSector: REIT - Healthcare Facilities | |
| MarketCap: 1507.94 Millions | |
| Recent Price: 24.87 Smart Investing & Trading Score: 68 | |
| Day Percent Change: 0.16% Day Change: 0.04 | |
| Week Change: 0.73% Year-to-date Change: 11.1% | |
| CTRE Links: Profile News Message Board | |
| Charts:- Daily , Weekly | |
| Add CTRE to Watchlist: View: Get Complete CTRE Trend Analysis ➞ | |
 | SFBS ServisFirst Bancshares, Inc. |
| Sector: Financials | |
| SubSector: Foreign Money Center Banks | |
| MarketCap: 1596.71 Millions | |
| Recent Price: 65.24 Smart Investing & Trading Score: 83 | |
| Day Percent Change: -1.26% Day Change: -0.83 | |
| Week Change: 0.73% Year-to-date Change: -2.1% | |
| SFBS Links: Profile News Message Board | |
| Charts:- Daily , Weekly | |
| Add SFBS to Watchlist: View: Get Complete SFBS Trend Analysis ➞ | |
 | DRH DiamondRock Hospitality Company |
| Sector: Financials | |
| SubSector: REIT - Hotel/Motel | |
| MarketCap: 964 Millions | |
| Recent Price: 8.57 Smart Investing & Trading Score: 18 | |
| Day Percent Change: 1.66% Day Change: 0.14 | |
| Week Change: 0.71% Year-to-date Change: -8.7% | |
| DRH Links: Profile News Message Board | |
| Charts:- Daily , Weekly | |
| Add DRH to Watchlist: View: Get Complete DRH Trend Analysis ➞ | |
 | BBUC Brookfield Business Corporation |
| Sector: Financials | |
| SubSector: Asset Management | |
| MarketCap: 1810 Millions | |
| Recent Price: 21.56 Smart Investing & Trading Score: 64 | |
| Day Percent Change: -0.78% Day Change: -0.17 | |
| Week Change: 0.7% Year-to-date Change: -7.0% | |
| BBUC Links: Profile News Message Board | |
| Charts:- Daily , Weekly | |
| Add BBUC to Watchlist: View: Get Complete BBUC Trend Analysis ➞ | |
 | MCY Mercury General Corporation |
| Sector: Financials | |
| SubSector: Property & Casualty Insurance | |
| MarketCap: 2122.12 Millions | |
| Recent Price: 57.96 Smart Investing & Trading Score: 90 | |
| Day Percent Change: 0.96% Day Change: 0.55 | |
| Week Change: 0.69% Year-to-date Change: 55.4% | |
| MCY Links: Profile News Message Board | |
| Charts:- Daily , Weekly | |
| Add MCY to Watchlist: View: Get Complete MCY Trend Analysis ➞ | |
 | LCNB LCNB Corp. |
| Sector: Financials | |
| SubSector: Regional - Mid-Atlantic Banks | |
| MarketCap: 176.759 Millions | |
| Recent Price: 14.75 Smart Investing & Trading Score: 78 | |
| Day Percent Change: 0.34% Day Change: 0.05 | |
| Week Change: 0.68% Year-to-date Change: -6.5% | |
| LCNB Links: Profile News Message Board | |
| Charts:- Daily , Weekly | |
| Add LCNB to Watchlist: View: Get Complete LCNB Trend Analysis ➞ | |
 | RBCAA Republic Bancorp, Inc. |
| Sector: Financials | |
| SubSector: Regional - Southeast Banks | |
| MarketCap: 671.835 Millions | |
| Recent Price: 54.30 Smart Investing & Trading Score: 90 | |
| Day Percent Change: 0.11% Day Change: 0.06 | |
| Week Change: 0.67% Year-to-date Change: -1.6% | |
| RBCAA Links: Profile News Message Board | |
| Charts:- Daily , Weekly | |
| Add RBCAA to Watchlist: View: Get Complete RBCAA Trend Analysis ➞ | |
 | UVSP Univest Financial Corporation |
| Sector: Financials | |
| SubSector: Regional - Northeast Banks | |
| MarketCap: 467.999 Millions | |
| Recent Price: 22.80 Smart Investing & Trading Score: 83 | |
| Day Percent Change: 0.31% Day Change: 0.07 | |
| Week Change: 0.66% Year-to-date Change: 3.5% | |
| UVSP Links: Profile News Message Board | |
| Charts:- Daily , Weekly | |
| Add UVSP to Watchlist: View: Get Complete UVSP Trend Analysis ➞ | |
 | WSFS WSFS Financial Corporation |
| Sector: Financials | |
| SubSector: Regional - Mid-Atlantic Banks | |
| MarketCap: 1191.29 Millions | |
| Recent Price: 46.48 Smart Investing & Trading Score: 83 | |
| Day Percent Change: 0.13% Day Change: 0.06 | |
| Week Change: 0.65% Year-to-date Change: 1.2% | |
| WSFS Links: Profile News Message Board | |
| Charts:- Daily , Weekly | |
| Add WSFS to Watchlist: View: Get Complete WSFS Trend Analysis ➞ | |
 | CVBF CVB Financial Corp. |
| Sector: Financials | |
| SubSector: Regional - Pacific Banks | |
| MarketCap: 2699.99 Millions | |
| Recent Price: 17.33 Smart Investing & Trading Score: 90 | |
| Day Percent Change: -0.12% Day Change: -0.02 | |
| Week Change: 0.64% Year-to-date Change: -14.2% | |
| CVBF Links: Profile News Message Board | |
| Charts:- Daily , Weekly | |
| Add CVBF to Watchlist: View: Get Complete CVBF Trend Analysis ➞ | |
 | ORRF Orrstown Financial Services, Inc. |
| Sector: Financials | |
| SubSector: Regional - Northeast Banks | |
| MarketCap: 159.999 Millions | |
| Recent Price: 26.82 Smart Investing & Trading Score: 67 | |
| Day Percent Change: 0.19% Day Change: 0.05 | |
| Week Change: 0.64% Year-to-date Change: -9.1% | |
| ORRF Links: Profile News Message Board | |
| Charts:- Daily , Weekly | |
| Add ORRF to Watchlist: View: Get Complete ORRF Trend Analysis ➞ | |
 | HBNC Horizon Bancorp, Inc. |
| Sector: Financials | |
| SubSector: Regional - Northeast Banks | |
| MarketCap: 405.999 Millions | |
| Recent Price: 12.73 Smart Investing & Trading Score: 83 | |
| Day Percent Change: 0.87% Day Change: 0.11 | |
| Week Change: 0.63% Year-to-date Change: -11.0% | |
| HBNC Links: Profile News Message Board | |
| Charts:- Daily , Weekly | |
| Add HBNC to Watchlist: View: Get Complete HBNC Trend Analysis ➞ | |
 | SRCE 1st Source Corporation |
| Sector: Financials | |
| SubSector: Regional - Midwest Banks | |
| MarketCap: 784.77 Millions | |
| Recent Price: 52.68 Smart Investing & Trading Score: 83 | |
| Day Percent Change: 0.23% Day Change: 0.12 | |
| Week Change: 0.53% Year-to-date Change: -4.1% | |
| SRCE Links: Profile News Message Board | |
| Charts:- Daily , Weekly | |
| Add SRCE to Watchlist: View: Get Complete SRCE Trend Analysis ➞ | |
 | COOP Mr. Cooper Group Inc. |
| Sector: Financials | |
| SubSector: Savings & Loans | |
| MarketCap: 648.33 Millions | |
| Recent Price: 84.22 Smart Investing & Trading Score: 100 | |
| Day Percent Change: 1.34% Day Change: 1.11 | |
| Week Change: 0.53% Year-to-date Change: 29.3% | |
| COOP Links: Profile News Message Board | |
| Charts:- Daily , Weekly | |
| Add COOP to Watchlist: View: Get Complete COOP Trend Analysis ➞ | |
 | CZNC Citizens & Northern Corporation |
| Sector: Financials | |
| SubSector: Regional - Mid-Atlantic Banks | |
| MarketCap: 274.459 Millions | |
| Recent Price: 17.98 Smart Investing & Trading Score: 67 | |
| Day Percent Change: -0.28% Day Change: -0.05 | |
| Week Change: 0.5% Year-to-date Change: -19.8% | |
| CZNC Links: Profile News Message Board | |
| Charts:- Daily , Weekly | |
| Add CZNC to Watchlist: View: Get Complete CZNC Trend Analysis ➞ | |
 | TCBX Third Coast Bancshares, Inc. |
| Sector: Financials | |
| SubSector: Banks - Regional | |
| MarketCap: 212 Millions | |
| Recent Price: 21.32 Smart Investing & Trading Score: 73 | |
| Day Percent Change: 1.09% Day Change: 0.23 | |
| Week Change: 0.47% Year-to-date Change: 6.6% | |
| TCBX Links: Profile News Message Board | |
| Charts:- Daily , Weekly | |
| Add TCBX to Watchlist: View: Get Complete TCBX Trend Analysis ➞ | |
 | CHMG Chemung Financial Corporation |
| Sector: Financials | |
| SubSector: Regional - Pacific Banks | |
| MarketCap: 142.229 Millions | |
| Recent Price: 43.50 Smart Investing & Trading Score: 93 | |
| Day Percent Change: -0.46% Day Change: -0.20 | |
| Week Change: 0.46% Year-to-date Change: -12.7% | |
| CHMG Links: Profile News Message Board | |
| Charts:- Daily , Weekly | |
| Add CHMG to Watchlist: View: Get Complete CHMG Trend Analysis ➞ | |
 | FMBH First Mid Bancshares, Inc. |
| Sector: Financials | |
| SubSector: Regional - Midwest Banks | |
| MarketCap: 373.27 Millions | |
| Recent Price: 33.00 Smart Investing & Trading Score: 83 | |
| Day Percent Change: -0.63% Day Change: -0.21 | |
| Week Change: 0.46% Year-to-date Change: -4.8% | |
| FMBH Links: Profile News Message Board | |
| Charts:- Daily , Weekly | |
| Add FMBH to Watchlist: View: Get Complete FMBH Trend Analysis ➞ | |
 | SBSI Southside Bancshares, Inc. |
| Sector: Financials | |
| SubSector: Regional - Mid-Atlantic Banks | |
| MarketCap: 971.259 Millions | |
| Recent Price: 28.09 Smart Investing & Trading Score: 62 | |
| Day Percent Change: 0.25% Day Change: 0.07 | |
| Week Change: 0.43% Year-to-date Change: -10.3% | |
| SBSI Links: Profile News Message Board | |
| Charts:- Daily , Weekly | |
| Add SBSI to Watchlist: View: Get Complete SBSI Trend Analysis ➞ | |
 | BLX Banco Latinoamericano de Comercio Exterior, S.A |
| Sector: Financials | |
| SubSector: Foreign Money Center Banks | |
| MarketCap: 390.471 Millions | |
| Recent Price: 30.50 Smart Investing & Trading Score: 78 | |
| Day Percent Change: 2.69% Day Change: 0.80 | |
| Week Change: 0.43% Year-to-date Change: 23.3% | |
| BLX Links: Profile News Message Board | |
| Charts:- Daily , Weekly | |
| Add BLX to Watchlist: View: Get Complete BLX Trend Analysis ➞ | |
 | PGRE Paramount Group, Inc. |
| Sector: Financials | |
| SubSector: Property Management | |
| MarketCap: 1722.72 Millions | |
| Recent Price: 4.80 Smart Investing & Trading Score: 68 | |
| Day Percent Change: -1.23% Day Change: -0.06 | |
| Week Change: 0.42% Year-to-date Change: -7.2% | |
| PGRE Links: Profile News Message Board | |
| Charts:- Daily , Weekly | |
| Add PGRE to Watchlist: View: Get Complete PGRE Trend Analysis ➞ | |
 | NAVI Navient Corporation |
| Sector: Financials | |
| SubSector: Credit Services | |
| MarketCap: 1362.48 Millions | |
| Recent Price: 15.54 Smart Investing & Trading Score: 0 | |
| Day Percent Change: -0.38% Day Change: -0.06 | |
| Week Change: 0.39% Year-to-date Change: -16.5% | |
| NAVI Links: Profile News Message Board | |
| Charts:- Daily , Weekly | |
| Add NAVI to Watchlist: View: Get Complete NAVI Trend Analysis ➞ | |
 | EPRT Essential Properties Realty Trust, Inc. |
| Sector: Financials | |
| SubSector: REIT - Diversified | |
| MarketCap: 1424.43 Millions | |
| Recent Price: 27.21 Smart Investing & Trading Score: 88 | |
| Day Percent Change: -1.20% Day Change: -0.33 | |
| Week Change: 0.39% Year-to-date Change: 6.5% | |
| EPRT Links: Profile News Message Board | |
| Charts:- Daily , Weekly | |
| Add EPRT to Watchlist: View: Get Complete EPRT Trend Analysis ➞ | |
 | CASH Meta Financial Group, Inc. |
| Sector: Financials | |
| SubSector: Savings & Loans | |
| MarketCap: 849.33 Millions | |
| Recent Price: 54.17 Smart Investing & Trading Score: 83 | |
| Day Percent Change: 0.30% Day Change: 0.16 | |
| Week Change: 0.37% Year-to-date Change: 2.3% | |
| CASH Links: Profile News Message Board | |
| Charts:- Daily , Weekly | |
| Add CASH to Watchlist: View: Get Complete CASH Trend Analysis ➞ | |
 | TCI Transcontinental Realty Investors, Inc. |
| Sector: Financials | |
| SubSector: REIT - Diversified | |
| MarketCap: 158.653 Millions | |
| Recent Price: 28.45 Smart Investing & Trading Score: 35 | |
| Day Percent Change: 0.14% Day Change: 0.04 | |
| Week Change: 0.35% Year-to-date Change: -17.7% | |
| TCI Links: Profile News Message Board | |
| Charts:- Daily , Weekly | |
| Add TCI to Watchlist: View: Get Complete TCI Trend Analysis ➞ | |
| For tabular summary view of above stock list: Summary View ➞ 0 - 25 , 25 - 50 , 50 - 75 , 75 - 100 , 100 - 125 , 125 - 150 , 150 - 175 , 175 - 200 , 200 - 225 , 225 - 250 , 250 - 275 , 275 - 300 , 300 - 325 , 325 - 350 , 350 - 375 , 375 - 400 | ||
| Click To Change The Sort Order: By Market Cap or Company Size Performance: Year-to-date, Week and Day | |
| Select Chart Type: | ||
| Too many stocks? View smallcap stocks filtered by marketcap & sector |
| Marketcap: All SmallCap Stocks (default-no microcap), Large, Mid-Range, Small & MicroCap |
| Sector: Tech, Finance, Energy, Staples, Retail, Industrial, Materials, Utilities & Medical |
|
Best Stocks Today 12Stocks.com |
© 2024 12Stocks.com Terms & Conditions Privacy Contact Us
All Information Provided Only For Education And Not To Be Used For Investing or Trading. See Terms & Conditions


One More Thing ... Get Best Stocks Delivered Daily!
Never Ever Miss A Move With Our Top Ten Stocks Lists
Find Best Stocks In Any Market - Bull or Bear Market
Take A Peek At Our Top Ten Stocks Lists: Daily, Weekly, Year-to-Date & Top Trends
Find Best Stocks In Any Market - Bull or Bear Market
Take A Peek At Our Top Ten Stocks Lists: Daily, Weekly, Year-to-Date & Top Trends
Smallcap Stocks With Best Up Trends [0-bearish to 100-bullish]: Trupanion [100], Hawkins [100], Tejon Ranch[100], Gannett Co[100], Seneca Foods[100], BRC [100], BJ s[100], Life Time[100], Vanda [100], Kronos Worldwide[100], NovaGold Resources[100]
Best Smallcap Stocks Year-to-Date:
CareMax [471.13%], Bakkt [370.4%], Janux [342.16%], Viking [304.73%], Alpine Immune[241.18%], Longboard [235.68%], Super Micro[218.16%], Avidity Biosciences[217.7%], Novavax [200%], Arcutis Bio[182.35%], Sweetgreen [181.24%] Best Smallcap Stocks This Week:
Novavax [62.16%], MacroGenics [54.68%], Maxeon Solar[49.31%], SunPower [43.04%], Harrow Health[39.31%], Workhorse Group[39.06%], Humacyte [36.6%], ProKidney [34.88%], Allbirds [33.47%], Cadiz [28.76%], Fossil Group[28.72%] Best Smallcap Stocks Daily:
Maxeon Solar[26.56%], Allakos [22.36%], Ventyx Biosciences[18.85%], Trupanion [15.85%], Zura Bio[15.61%], Beyond Air[15.42%], SilverBow Resources[13.20%], Children s[13.09%], Comtech Tele[12.92%], Aceto [12.14%], Novavax [11.63%]