
 Login Sign Up


| |||||
 |  | ||||

| 12Stocks.com Market Intelligence |
Best SmallCap Stocks
|
| In a hurry? Small Cap Stock Lists: Performance Trends Table, Stock Charts
Sort Small Cap stocks: Daily, Weekly, Year-to-Date, Market Cap & Trends. Filter Small Cap stocks list by sector: Show all, Tech, Finance, Energy, Staples, Retail, Industrial, Materials, Utilities and HealthCare Filter Small Cap stocks list by size: All Large Medium Small and MicroCap |
| 12Stocks.com Small Cap Stocks Performances & Trends Daily | |||||||||
|
|  The overall Smart Investing & Trading Score is 90 (0-bearish to 100-bullish) which puts Small Cap index in short term bullish trend. The Smart Investing & Trading Score from previous trading session is 100 and hence a deterioration of trend.
| ||||||||
Here are the Smart Investing & Trading Scores of the most requested small cap stocks at 12Stocks.com (click stock name for detailed review):
|


| 12Stocks.com: Investing in Smallcap Index with Stocks | |
|
The following table helps investors and traders sort through current performance and trends (as measured by Smart Investing & Trading Score) of various
stocks in the Smallcap Index. Quick View: Move mouse or cursor over stock symbol (ticker) to view short-term technical chart and over stock name to view long term chart. Click on  to add stock symbol to your watchlist and to add stock symbol to your watchlist and  to view watchlist. Click on any ticker or stock name for detailed market intelligence report for that stock. to view watchlist. Click on any ticker or stock name for detailed market intelligence report for that stock. |
12Stocks.com Performance of Stocks in Smallcap Index
| Ticker | Stock Name | Watchlist | Category | Recent Price | Smart Investing & Trading Score | Change % | Weekly Change% |
| LTC | LTC Properties |   | Financials | 34.64 | 83 | 0.26% | 1.70% |
| ROIC | Retail Opportunity | | Financials | 12.65 | 74 | 0.16% | 1.69% |
| LADR | Ladder Capital | | Financials | 11.41 | 90 | 0.53% | 1.69% |
| FCF | First Commonwealth | | Financials | 14.12 | 95 | 0.71% | 1.66% |
| IRT | Independence Realty | | Financials | 17.13 | 83 | -0.58% | 1.66% |
| EFSC | Enterprise Financial | | Financials | 40.61 | 95 | 1.20% | 1.65% |
| RLJ | RLJ Lodging | | Financials | 10.50 | 35 | 0.96% | 1.65% |
| EFC | Ellington Financial | | Financials | 12.09 | 100 | 0.17% | 1.60% |
| FSBC | Five Star | | Financials | 22.90 | 74 | 1.33% | 1.60% |
| SMBK | SmartFinancial | | Financials | 22.89 | 80 | 0.35% | 1.60% |
| PFS | Provident Financial | | Financials | 16.11 | 95 | -0.12% | 1.58% |
| OSBC | Old Second | | Financials | 14.80 | 100 | -0.07% | 1.58% |
| TWO | Two Harbors | | Financials | 12.98 | 83 | 0.15% | 1.56% |
| NBHC | National Bank | | Financials | 36.06 | 95 | 0.61% | 1.55% |
| PAGS | PagSeguro Digital | | Financials | 12.78 | 30 | 0.31% | 1.55% |
| STBA | S&T Bancorp | | Financials | 32.37 | 100 | 0.53% | 1.54% |
| FBMS | First Bancshares | | Financials | 25.89 | 95 | 0.35% | 1.53% |
| ORC | Orchid Island | | Financials | 8.66 | 72 | 0.70% | 1.52% |
| PFBC | Preferred Bank | | Financials | 79.88 | 83 | 0.20% | 1.49% |
| TCBI | Texas Capital | | Financials | 62.35 | 76 | 1.04% | 1.48% |
| MFA | MFA Financial | | Financials | 11.00 | 74 | 0.18% | 1.48% |
| UE | Urban Edge | | Financials | 17.41 | 71 | -0.11% | 1.46% |
| DX | Dynex Capital | | Financials | 12.57 | 95 | 0.16% | 1.45% |
| BY | Byline Bancorp | | Financials | 23.79 | 90 | 0.89% | 1.45% |
| HTLF | Heartland Financial | | Financials | 44.58 | 90 | -1.83% | 1.43% |
| For chart view version of above stock list: Chart View ➞ 0 - 25 , 25 - 50 , 50 - 75 , 75 - 100 , 100 - 125 , 125 - 150 , 150 - 175 , 175 - 200 , 200 - 225 , 225 - 250 , 250 - 275 , 275 - 300 , 300 - 325 , 325 - 350 , 350 - 375 , 375 - 400 | ||
 | Click To Change The Sort Order: By Market Cap or Company Size Performance: Year-to-date, Week and Day |  |
| Too many stocks? View smallcap stocks filtered by marketcap & sector |
| Marketcap: All SmallCap Stocks (default-no microcap), Large, Mid-Range, Small |
| Smallcap Sector: Tech, Finance, Energy, Staples, Retail, Industrial, Materials, & Medical |
|
Get the most comprehensive stock market coverage daily at 12Stocks.com ➞ Best Stocks Today ➞ Best Stocks Weekly ➞ Best Stocks Year-to-Date ➞ Best Stocks Trends ➞  Best Stocks Today 12Stocks.com Best Nasdaq Stocks ➞ Best S&P 500 Stocks ➞ Best Tech Stocks ➞ Best Biotech Stocks ➞ |
| Detailed Overview of SmallCap Stocks |
| SmallCap Technical Overview, Leaders & Laggards, Top SmallCap ETF Funds & Detailed SmallCap Stocks List, Charts, Trends & More |
| Smallcap: Technical Analysis, Trends & YTD Performance | |
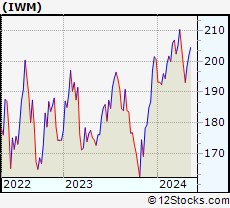
| SmallCap segment as represented by
IWM, an exchange-traded fund [ETF], holds basket of thousands of smallcap stocks from across all major sectors of the US stock market. The smallcap index (contains stocks like Riverbed & Sotheby's) is up by 3.6% and is currently underperforming the overall market by -6.82% year-to-date. Below is a quick view of technical charts and trends: | |
 IWM Weekly Chart |
|
| Long Term Trend: Very Good | |
| Medium Term Trend: Very Good | |
 IWM Daily Chart |
|
| Short Term Trend: Good | |
| Overall Trend Score: 90 | |
| YTD Performance: 3.6% | |
| **Trend Scores & Views Are Only For Educational Purposes And Not For Investing | |
| 12Stocks.com: Top Performing Small Cap Index Stocks | ||||||||||||||||||||||||||||||||||||||||||||||||
 The top performing Small Cap Index stocks year to date are
Now, more recently, over last week, the top performing Small Cap Index stocks on the move are


|
||||||||||||||||||||||||||||||||||||||||||||||||
| 12Stocks.com: Investing in Smallcap Index using Exchange Traded Funds | |
|
The following table shows list of key exchange traded funds (ETF) that
help investors track Smallcap index. The following list also includes leveraged ETF funds that track twice or thrice the daily returns of Smallcap indices. Short or inverse ETF funds move in the opposite direction to the index they track and are useful during market pullbacks or during bear markets. Quick View: Move mouse or cursor over ETF symbol (ticker) to view short-term technical chart and over ETF name to view long term chart. Click on ticker or stock name for detailed view. Click on to add stock symbol to your watchlist and to view watchlist. |
12Stocks.com List of ETFs that track Smallcap Index
| Ticker | ETF Name | Watchlist | Recent Price | Smart Investing & Trading Score | Change % | Week % | Year-to-date % |
| IWM | iShares Russell 2000 | | 207.93 | 90 | -0.72 | 1.77 | 3.6% |
| VTWO | Vanguard Russell 2000 ETF | | 84.11 | 90 | -0.61 | 1.8 | 3.71% |
| IJR | iShares Core S&P Small-Cap | | 110.63 | 83 | -0.14 | 1.51 | 2.2% |
| IWN | iShares Russell 2000 Value | | 158.82 | 88 | 0.06 | 1.68 | 2.25% |
| IJT | iShares S&P Small-Cap 600 Growth | | 131.29 | 83 | -0.69 | 1.1 | 4.91% |
| IJS | iShares S&P Small-Cap 600 Value | | 102.02 | 83 | -0.11 | 1.49 | -1.02% |
| IWO | iShares Russell 2000 Growth | | 267.15 | 95 | 0.21 | 2.78 | 5.92% |
| XSLV | PowerShares S&P SmallCap Low Volatil ETF | | 44.48 | 76 | -0.02 | 0.57 | 0.75% |
| SBB | ProShares Short SmallCap600 | | 15.71 | 17 | 0.32 | -1.54 | -1.38% |
| SAA | ProShares Ultra SmallCap600 | | 24.78 | 78 | -1.69 | 1.77 | -0.68% |
| SMLV | SPDR SSGA US Small Cap Low Volatil ETF | | 112.79 | 95 | 0.22 | 1.41 | 0.24% |
| SDD | ProShares UltraShort SmallCap600 | | 17.67 | 27 | 0.00 | -3.34 | -4.11% |
| 12Stocks.com: Charts, Trends, Fundamental Data and Performances of SmallCap Stocks | |
|
We now take in-depth look at all SmallCap stocks including charts, multi-period performances and overall trends (as measured by Smart Investing & Trading Score). One can sort SmallCap stocks (click link to choose) by Daily, Weekly and by Year-to-Date performances. Also, one can sort by size of the company or by market capitalization. |
| Select Your Default Chart Type: | |||||
| |||||
| Click on stock symbol or name for detailed view. Click on to add stock symbol to your watchlist and to view watchlist. Quick View: Move mouse or cursor over "Daily" to quickly view daily technical stock chart and over "Weekly" to view weekly technical stock chart. | |||||

 | LTC LTC Properties, Inc. |
| Sector: Financials | |
| SubSector: REIT - Healthcare Facilities | |
| MarketCap: 1369.24 Millions | |
| Recent Price: 34.64 Smart Investing & Trading Score: 83 | |
| Day Percent Change: 0.26% Day Change: 0.09 | |
| Week Change: 1.7% Year-to-date Change: 7.9% | |
| LTC Links: Profile News Message Board | |
| Charts:- Daily , Weekly | |
| Add LTC to Watchlist: View: Get Complete LTC Trend Analysis ➞ | |
 | ROIC Retail Opportunity Investments Corp. |
| Sector: Financials | |
| SubSector: REIT - Retail | |
| MarketCap: 943.414 Millions | |
| Recent Price: 12.65 Smart Investing & Trading Score: 74 | |
| Day Percent Change: 0.16% Day Change: 0.02 | |
| Week Change: 1.69% Year-to-date Change: -9.8% | |
| ROIC Links: Profile News Message Board | |
| Charts:- Daily , Weekly | |
| Add ROIC to Watchlist: View: Get Complete ROIC Trend Analysis ➞ | |
 | LADR Ladder Capital Corp |
| Sector: Financials | |
| SubSector: Mortgage Investment | |
| MarketCap: 660.039 Millions | |
| Recent Price: 11.41 Smart Investing & Trading Score: 90 | |
| Day Percent Change: 0.53% Day Change: 0.06 | |
| Week Change: 1.69% Year-to-date Change: -0.9% | |
| LADR Links: Profile News Message Board | |
| Charts:- Daily , Weekly | |
| Add LADR to Watchlist: View: Get Complete LADR Trend Analysis ➞ | |
 | FCF First Commonwealth Financial Corporation |
| Sector: Financials | |
| SubSector: Regional - Northeast Banks | |
| MarketCap: 900.299 Millions | |
| Recent Price: 14.12 Smart Investing & Trading Score: 95 | |
| Day Percent Change: 0.71% Day Change: 0.10 | |
| Week Change: 1.66% Year-to-date Change: -8.6% | |
| FCF Links: Profile News Message Board | |
| Charts:- Daily , Weekly | |
| Add FCF to Watchlist: View: Get Complete FCF Trend Analysis ➞ | |
 | IRT Independence Realty Trust, Inc. |
| Sector: Financials | |
| SubSector: REIT - Residential | |
| MarketCap: 980.161 Millions | |
| Recent Price: 17.13 Smart Investing & Trading Score: 83 | |
| Day Percent Change: -0.58% Day Change: -0.10 | |
| Week Change: 1.66% Year-to-date Change: 12.0% | |
| IRT Links: Profile News Message Board | |
| Charts:- Daily , Weekly | |
| Add IRT to Watchlist: View: Get Complete IRT Trend Analysis ➞ | |
 | EFSC Enterprise Financial Services Corp |
| Sector: Financials | |
| SubSector: Regional - Southwest Banks | |
| MarketCap: 770.165 Millions | |
| Recent Price: 40.61 Smart Investing & Trading Score: 95 | |
| Day Percent Change: 1.20% Day Change: 0.48 | |
| Week Change: 1.65% Year-to-date Change: -9.1% | |
| EFSC Links: Profile News Message Board | |
| Charts:- Daily , Weekly | |
| Add EFSC to Watchlist: View: Get Complete EFSC Trend Analysis ➞ | |
 | RLJ RLJ Lodging Trust |
| Sector: Financials | |
| SubSector: REIT - Hotel/Motel | |
| MarketCap: 1019.34 Millions | |
| Recent Price: 10.50 Smart Investing & Trading Score: 35 | |
| Day Percent Change: 0.96% Day Change: 0.10 | |
| Week Change: 1.65% Year-to-date Change: -10.4% | |
| RLJ Links: Profile News Message Board | |
| Charts:- Daily , Weekly | |
| Add RLJ to Watchlist: View: Get Complete RLJ Trend Analysis ➞ | |
 | EFC Ellington Financial Inc. |
| Sector: Financials | |
| SubSector: Mortgage Investment | |
| MarketCap: 380.239 Millions | |
| Recent Price: 12.09 Smart Investing & Trading Score: 100 | |
| Day Percent Change: 0.17% Day Change: 0.02 | |
| Week Change: 1.6% Year-to-date Change: -4.9% | |
| EFC Links: Profile News Message Board | |
| Charts:- Daily , Weekly | |
| Add EFC to Watchlist: View: Get Complete EFC Trend Analysis ➞ | |
 | FSBC Five Star Bancorp |
| Sector: Financials | |
| SubSector: Banks - Regional | |
| MarketCap: 377 Millions | |
| Recent Price: 22.90 Smart Investing & Trading Score: 74 | |
| Day Percent Change: 1.33% Day Change: 0.30 | |
| Week Change: 1.6% Year-to-date Change: -12.5% | |
| FSBC Links: Profile News Message Board | |
| Charts:- Daily , Weekly | |
| Add FSBC to Watchlist: View: Get Complete FSBC Trend Analysis ➞ | |
 | SMBK SmartFinancial, Inc. |
| Sector: Financials | |
| SubSector: Regional - Southeast Banks | |
| MarketCap: 174.035 Millions | |
| Recent Price: 22.89 Smart Investing & Trading Score: 80 | |
| Day Percent Change: 0.35% Day Change: 0.08 | |
| Week Change: 1.6% Year-to-date Change: -6.5% | |
| SMBK Links: Profile News Message Board | |
| Charts:- Daily , Weekly | |
| Add SMBK to Watchlist: View: Get Complete SMBK Trend Analysis ➞ | |
 | PFS Provident Financial Services, Inc. |
| Sector: Financials | |
| SubSector: Savings & Loans | |
| MarketCap: 829.73 Millions | |
| Recent Price: 16.11 Smart Investing & Trading Score: 95 | |
| Day Percent Change: -0.12% Day Change: -0.02 | |
| Week Change: 1.58% Year-to-date Change: -10.7% | |
| PFS Links: Profile News Message Board | |
| Charts:- Daily , Weekly | |
| Add PFS to Watchlist: View: Get Complete PFS Trend Analysis ➞ | |
 | OSBC Old Second Bancorp, Inc. |
| Sector: Financials | |
| SubSector: Regional - Midwest Banks | |
| MarketCap: 237.17 Millions | |
| Recent Price: 14.80 Smart Investing & Trading Score: 100 | |
| Day Percent Change: -0.07% Day Change: -0.01 | |
| Week Change: 1.58% Year-to-date Change: -4.2% | |
| OSBC Links: Profile News Message Board | |
| Charts:- Daily , Weekly | |
| Add OSBC to Watchlist: View: Get Complete OSBC Trend Analysis ➞ | |
 | TWO Two Harbors Investment Corp. |
| Sector: Financials | |
| SubSector: Mortgage Investment | |
| MarketCap: 1979.59 Millions | |
| Recent Price: 12.98 Smart Investing & Trading Score: 83 | |
| Day Percent Change: 0.15% Day Change: 0.02 | |
| Week Change: 1.56% Year-to-date Change: -6.8% | |
| TWO Links: Profile News Message Board | |
| Charts:- Daily , Weekly | |
| Add TWO to Watchlist: View: Get Complete TWO Trend Analysis ➞ | |
 | NBHC National Bank Holdings Corporation |
| Sector: Financials | |
| SubSector: Regional - Midwest Banks | |
| MarketCap: 766.87 Millions | |
| Recent Price: 36.06 Smart Investing & Trading Score: 95 | |
| Day Percent Change: 0.61% Day Change: 0.22 | |
| Week Change: 1.55% Year-to-date Change: -3.0% | |
| NBHC Links: Profile News Message Board | |
| Charts:- Daily , Weekly | |
| Add NBHC to Watchlist: View: Get Complete NBHC Trend Analysis ➞ | |
 | PAGS PagSeguro Digital Ltd. |
| Sector: Financials | |
| SubSector: Credit Services | |
| MarketCap: 6500.78 Millions | |
| Recent Price: 12.78 Smart Investing & Trading Score: 30 | |
| Day Percent Change: 0.31% Day Change: 0.04 | |
| Week Change: 1.55% Year-to-date Change: 2.5% | |
| PAGS Links: Profile News Message Board | |
| Charts:- Daily , Weekly | |
| Add PAGS to Watchlist: View: Get Complete PAGS Trend Analysis ➞ | |
 | STBA S&T Bancorp, Inc. |
| Sector: Financials | |
| SubSector: Regional - Northeast Banks | |
| MarketCap: 1136.99 Millions | |
| Recent Price: 32.37 Smart Investing & Trading Score: 100 | |
| Day Percent Change: 0.53% Day Change: 0.17 | |
| Week Change: 1.54% Year-to-date Change: -3.1% | |
| STBA Links: Profile News Message Board | |
| Charts:- Daily , Weekly | |
| Add STBA to Watchlist: View: Get Complete STBA Trend Analysis ➞ | |
 | FBMS The First Bancshares, Inc. |
| Sector: Financials | |
| SubSector: Regional - Southeast Banks | |
| MarketCap: 359.535 Millions | |
| Recent Price: 25.89 Smart Investing & Trading Score: 95 | |
| Day Percent Change: 0.35% Day Change: 0.09 | |
| Week Change: 1.53% Year-to-date Change: -11.7% | |
| FBMS Links: Profile News Message Board | |
| Charts:- Daily , Weekly | |
| Add FBMS to Watchlist: View: Get Complete FBMS Trend Analysis ➞ | |
 | ORC Orchid Island Capital, Inc. |
| Sector: Financials | |
| SubSector: Mortgage Investment | |
| MarketCap: 212.339 Millions | |
| Recent Price: 8.66 Smart Investing & Trading Score: 72 | |
| Day Percent Change: 0.70% Day Change: 0.06 | |
| Week Change: 1.52% Year-to-date Change: 2.7% | |
| ORC Links: Profile News Message Board | |
| Charts:- Daily , Weekly | |
| Add ORC to Watchlist: View: Get Complete ORC Trend Analysis ➞ | |
 | PFBC Preferred Bank |
| Sector: Financials | |
| SubSector: Regional - Pacific Banks | |
| MarketCap: 559.629 Millions | |
| Recent Price: 79.88 Smart Investing & Trading Score: 83 | |
| Day Percent Change: 0.20% Day Change: 0.16 | |
| Week Change: 1.49% Year-to-date Change: 9.4% | |
| PFBC Links: Profile News Message Board | |
| Charts:- Daily , Weekly | |
| Add PFBC to Watchlist: View: Get Complete PFBC Trend Analysis ➞ | |
 | TCBI Texas Capital Bancshares, Inc. |
| Sector: Financials | |
| SubSector: Regional - Southwest Banks | |
| MarketCap: 1202.75 Millions | |
| Recent Price: 62.35 Smart Investing & Trading Score: 76 | |
| Day Percent Change: 1.04% Day Change: 0.64 | |
| Week Change: 1.48% Year-to-date Change: -3.5% | |
| TCBI Links: Profile News Message Board | |
| Charts:- Daily , Weekly | |
| Add TCBI to Watchlist: View: Get Complete TCBI Trend Analysis ➞ | |
 | MFA MFA Financial, Inc. |
| Sector: Financials | |
| SubSector: Mortgage Investment | |
| MarketCap: 1869.69 Millions | |
| Recent Price: 11.00 Smart Investing & Trading Score: 74 | |
| Day Percent Change: 0.18% Day Change: 0.02 | |
| Week Change: 1.48% Year-to-date Change: -2.4% | |
| MFA Links: Profile News Message Board | |
| Charts:- Daily , Weekly | |
| Add MFA to Watchlist: View: Get Complete MFA Trend Analysis ➞ | |
 | UE Urban Edge Properties |
| Sector: Financials | |
| SubSector: REIT - Diversified | |
| MarketCap: 1112.33 Millions | |
| Recent Price: 17.41 Smart Investing & Trading Score: 71 | |
| Day Percent Change: -0.11% Day Change: -0.02 | |
| Week Change: 1.46% Year-to-date Change: -4.9% | |
| UE Links: Profile News Message Board | |
| Charts:- Daily , Weekly | |
| Add UE to Watchlist: View: Get Complete UE Trend Analysis ➞ | |
 | DX Dynex Capital, Inc. |
| Sector: Financials | |
| SubSector: Mortgage Investment | |
| MarketCap: 327.839 Millions | |
| Recent Price: 12.57 Smart Investing & Trading Score: 95 | |
| Day Percent Change: 0.16% Day Change: 0.02 | |
| Week Change: 1.45% Year-to-date Change: 0.4% | |
| DX Links: Profile News Message Board | |
| Charts:- Daily , Weekly | |
| Add DX to Watchlist: View: Get Complete DX Trend Analysis ➞ | |
 | BY Byline Bancorp, Inc. |
| Sector: Financials | |
| SubSector: Regional - Midwest Banks | |
| MarketCap: 381.87 Millions | |
| Recent Price: 23.79 Smart Investing & Trading Score: 90 | |
| Day Percent Change: 0.89% Day Change: 0.21 | |
| Week Change: 1.45% Year-to-date Change: 1.0% | |
| BY Links: Profile News Message Board | |
| Charts:- Daily , Weekly | |
| Add BY to Watchlist: View: Get Complete BY Trend Analysis ➞ | |
 | HTLF Heartland Financial USA, Inc. |
| Sector: Financials | |
| SubSector: Regional - Southwest Banks | |
| MarketCap: 1143.85 Millions | |
| Recent Price: 44.58 Smart Investing & Trading Score: 90 | |
| Day Percent Change: -1.83% Day Change: -0.83 | |
| Week Change: 1.43% Year-to-date Change: 18.5% | |
| HTLF Links: Profile News Message Board | |
| Charts:- Daily , Weekly | |
| Add HTLF to Watchlist: View: Get Complete HTLF Trend Analysis ➞ | |
| For tabular summary view of above stock list: Summary View ➞ 0 - 25 , 25 - 50 , 50 - 75 , 75 - 100 , 100 - 125 , 125 - 150 , 150 - 175 , 175 - 200 , 200 - 225 , 225 - 250 , 250 - 275 , 275 - 300 , 300 - 325 , 325 - 350 , 350 - 375 , 375 - 400 | ||
| Click To Change The Sort Order: By Market Cap or Company Size Performance: Year-to-date, Week and Day | |
| Select Chart Type: | ||
| Too many stocks? View smallcap stocks filtered by marketcap & sector |
| Marketcap: All SmallCap Stocks (default-no microcap), Large, Mid-Range, Small & MicroCap |
| Sector: Tech, Finance, Energy, Staples, Retail, Industrial, Materials, Utilities & Medical |
|
Best Stocks Today 12Stocks.com |
© 2024 12Stocks.com Terms & Conditions Privacy Contact Us
All Information Provided Only For Education And Not To Be Used For Investing or Trading. See Terms & Conditions


One More Thing ... Get Best Stocks Delivered Daily!
Never Ever Miss A Move With Our Top Ten Stocks Lists
Find Best Stocks In Any Market - Bull or Bear Market
Take A Peek At Our Top Ten Stocks Lists: Daily, Weekly, Year-to-Date & Top Trends
Find Best Stocks In Any Market - Bull or Bear Market
Take A Peek At Our Top Ten Stocks Lists: Daily, Weekly, Year-to-Date & Top Trends
Smallcap Stocks With Best Up Trends [0-bearish to 100-bullish]: Trupanion [100], Hawkins [100], Tejon Ranch[100], Gannett Co[100], Seneca Foods[100], BRC [100], BJ s[100], Life Time[100], Vanda [100], Kronos Worldwide[100], NovaGold Resources[100]
Best Smallcap Stocks Year-to-Date:
CareMax [471.13%], Bakkt [370.4%], Janux [342.16%], Viking [304.73%], Alpine Immune[241.18%], Longboard [235.68%], Super Micro[218.16%], Avidity Biosciences[217.7%], Novavax [200%], Arcutis Bio[182.35%], Sweetgreen [181.24%] Best Smallcap Stocks This Week:
Novavax [62.16%], MacroGenics [54.68%], Maxeon Solar[49.31%], SunPower [43.04%], Harrow Health[39.31%], Workhorse Group[39.06%], Humacyte [36.6%], ProKidney [34.88%], Allbirds [33.47%], Cadiz [28.76%], Fossil Group[28.72%] Best Smallcap Stocks Daily:
Maxeon Solar[26.56%], Allakos [22.36%], Ventyx Biosciences[18.85%], Trupanion [15.85%], Zura Bio[15.61%], Beyond Air[15.42%], SilverBow Resources[13.20%], Children s[13.09%], Comtech Tele[12.92%], Aceto [12.14%], Novavax [11.63%]