
 Login Sign Up


| |||||
 |  | ||||

| 12Stocks.com Market Intelligence |
Best SmallCap Stocks
|
| In a hurry? Small Cap Stock Lists: Performance Trends Table, Stock Charts
Sort Small Cap stocks: Daily, Weekly, Year-to-Date, Market Cap & Trends. Filter Small Cap stocks list by sector: Show all, Tech, Finance, Energy, Staples, Retail, Industrial, Materials, Utilities and HealthCare Filter Small Cap stocks list by size: All Large Medium Small and MicroCap |
| 12Stocks.com Small Cap Stocks Performances & Trends Daily | |||||||||
|
|  The overall Smart Investing & Trading Score is 90 (0-bearish to 100-bullish) which puts Small Cap index in short term bullish trend. The Smart Investing & Trading Score from previous trading session is 100 and hence a deterioration of trend.
| ||||||||
Here are the Smart Investing & Trading Scores of the most requested small cap stocks at 12Stocks.com (click stock name for detailed review):
|


| 12Stocks.com: Investing in Smallcap Index with Stocks | |
|
The following table helps investors and traders sort through current performance and trends (as measured by Smart Investing & Trading Score) of various
stocks in the Smallcap Index. Quick View: Move mouse or cursor over stock symbol (ticker) to view short-term technical chart and over stock name to view long term chart. Click on  to add stock symbol to your watchlist and to add stock symbol to your watchlist and  to view watchlist. Click on any ticker or stock name for detailed market intelligence report for that stock. to view watchlist. Click on any ticker or stock name for detailed market intelligence report for that stock. |
12Stocks.com Performance of Stocks in Smallcap Index
| Ticker | Stock Name | Watchlist | Category | Recent Price | Smart Investing & Trading Score | Change % | Weekly Change% |
| TRUP | Trupanion |   | Financials | 32.82 | 100 | 15.85% | 27.21% |
| DOUG | Douglas Elliman | | Financials | 1.41 | 32 | 9.30% | 19.49% |
| SLQT | SelectQuote | | Financials | 3.05 | 95 | 3.74% | 16.41% |
| SNFCA | Security National | | Financials | 7.78 | 67 | -0.38% | 15.26% |
| FFWM | First Foundation | | Financials | 5.91 | 49 | 1.03% | 12.14% |
| CWK | Cushman & Wakefield | | Financials | 11.65 | 100 | 2.37% | 11.75% |
| MLP | Maui Land | | Financials | 23.02 | 100 | 1.81% | 10.41% |
| GCBC | Greene County | | Financials | 32.40 | 100 | 0.12% | 9.76% |
| TRC | Tejon Ranch | | Financials | 17.84 | 100 | 5.94% | 9.72% |
| AI | C3.ai | | Financials | 26.20 | 59 | -1.47% | 9.67% |
| CIFR | Cipher Mining | | Financials | 4.07 | 63 | -2.16% | 9.41% |
| BRP | BRP Group | | Financials | 32.51 | 95 | 8.91% | 9.20% |
| IIPR | Innovative Industrial | | Financials | 113.70 | 100 | 0.57% | 8.88% |
| NRIM | Northrim BanCorp | | Financials | 56.21 | 100 | -0.43% | 8.62% |
| VCTR | Victory Capital | | Financials | 52.05 | 88 | -0.17% | 7.70% |
| NODK | NI | | Financials | 16.18 | 100 | 2.34% | 7.44% |
| FCCO | First Community | | Financials | 17.31 | 100 | 0.14% | 7.28% |
| EVER | EverQuote | | Financials | 24.39 | 100 | 3.26% | 6.97% |
| KRNY | Kearny Financial | | Financials | 6.03 | 74 | 1.09% | 6.83% |
| LMND | Lemonade | | Financials | 17.70 | 48 | -3.59% | 6.76% |
| EHTH | eHealth | | Financials | 5.49 | 39 | 3.39% | 6.40% |
| NMRK | Newmark Group | | Financials | 10.92 | 69 | 1.02% | 6.28% |
| SAMG | Silvercrest Asset | | Financials | 15.94 | 74 | 3.91% | 6.20% |
| SAFE | Safehold | | Financials | 20.39 | 88 | -1.88% | 6.06% |
| LGIH | LGI Homes | | Financials | 105.24 | 69 | -1.86% | 5.89% |
| For chart view version of above stock list: Chart View ➞ 0 - 25 , 25 - 50 , 50 - 75 , 75 - 100 , 100 - 125 , 125 - 150 , 150 - 175 , 175 - 200 , 200 - 225 , 225 - 250 , 250 - 275 , 275 - 300 , 300 - 325 , 325 - 350 , 350 - 375 , 375 - 400 | ||
 | Click To Change The Sort Order: By Market Cap or Company Size Performance: Year-to-date, Week and Day |  |
| Too many stocks? View smallcap stocks filtered by marketcap & sector |
| Marketcap: All SmallCap Stocks (default-no microcap), Large, Mid-Range, Small |
| Smallcap Sector: Tech, Finance, Energy, Staples, Retail, Industrial, Materials, & Medical |
|
Get the most comprehensive stock market coverage daily at 12Stocks.com ➞ Best Stocks Today ➞ Best Stocks Weekly ➞ Best Stocks Year-to-Date ➞ Best Stocks Trends ➞  Best Stocks Today 12Stocks.com Best Nasdaq Stocks ➞ Best S&P 500 Stocks ➞ Best Tech Stocks ➞ Best Biotech Stocks ➞ |
| Detailed Overview of SmallCap Stocks |
| SmallCap Technical Overview, Leaders & Laggards, Top SmallCap ETF Funds & Detailed SmallCap Stocks List, Charts, Trends & More |
| Smallcap: Technical Analysis, Trends & YTD Performance | |
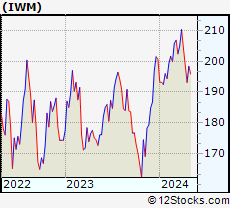
| SmallCap segment as represented by
IWM, an exchange-traded fund [ETF], holds basket of thousands of smallcap stocks from across all major sectors of the US stock market. The smallcap index (contains stocks like Riverbed & Sotheby's) is up by 3.6% and is currently underperforming the overall market by -6.82% year-to-date. Below is a quick view of technical charts and trends: | |
 IWM Weekly Chart |
|
| Long Term Trend: Very Good | |
| Medium Term Trend: Very Good | |
 IWM Daily Chart |
|
| Short Term Trend: Good | |
| Overall Trend Score: 90 | |
| YTD Performance: 3.6% | |
| **Trend Scores & Views Are Only For Educational Purposes And Not For Investing | |
| 12Stocks.com: Top Performing Small Cap Index Stocks | ||||||||||||||||||||||||||||||||||||||||||||||||
 The top performing Small Cap Index stocks year to date are
Now, more recently, over last week, the top performing Small Cap Index stocks on the move are


|
||||||||||||||||||||||||||||||||||||||||||||||||
| 12Stocks.com: Investing in Smallcap Index using Exchange Traded Funds | |
|
The following table shows list of key exchange traded funds (ETF) that
help investors track Smallcap index. The following list also includes leveraged ETF funds that track twice or thrice the daily returns of Smallcap indices. Short or inverse ETF funds move in the opposite direction to the index they track and are useful during market pullbacks or during bear markets. Quick View: Move mouse or cursor over ETF symbol (ticker) to view short-term technical chart and over ETF name to view long term chart. Click on ticker or stock name for detailed view. Click on to add stock symbol to your watchlist and to view watchlist. |
12Stocks.com List of ETFs that track Smallcap Index
| Ticker | ETF Name | Watchlist | Recent Price | Smart Investing & Trading Score | Change % | Week % | Year-to-date % |
| IWM | iShares Russell 2000 | | 207.93 | 90 | -0.72 | 1.77 | 3.6% |
| VTWO | Vanguard Russell 2000 ETF | | 84.11 | 90 | -0.61 | 1.8 | 3.71% |
| IJR | iShares Core S&P Small-Cap | | 110.63 | 83 | -0.14 | 1.51 | 2.2% |
| IWN | iShares Russell 2000 Value | | 158.82 | 88 | 0.06 | 1.68 | 2.25% |
| IJT | iShares S&P Small-Cap 600 Growth | | 131.29 | 83 | -0.69 | 1.1 | 4.91% |
| IJS | iShares S&P Small-Cap 600 Value | | 102.02 | 83 | -0.11 | 1.49 | -1.02% |
| IWO | iShares Russell 2000 Growth | | 267.15 | 95 | 0.21 | 2.78 | 5.92% |
| XSLV | PowerShares S&P SmallCap Low Volatil ETF | | 44.48 | 76 | -0.02 | 0.57 | 0.75% |
| SBB | ProShares Short SmallCap600 | | 15.71 | 17 | 0.32 | -1.54 | -1.38% |
| SAA | ProShares Ultra SmallCap600 | | 24.78 | 78 | -1.69 | 1.77 | -0.68% |
| SMLV | SPDR SSGA US Small Cap Low Volatil ETF | | 112.79 | 95 | 0.22 | 1.41 | 0.24% |
| SDD | ProShares UltraShort SmallCap600 | | 17.67 | 27 | 0.00 | -3.34 | -4.11% |
| 12Stocks.com: Charts, Trends, Fundamental Data and Performances of SmallCap Stocks | |
|
We now take in-depth look at all SmallCap stocks including charts, multi-period performances and overall trends (as measured by Smart Investing & Trading Score). One can sort SmallCap stocks (click link to choose) by Daily, Weekly and by Year-to-Date performances. Also, one can sort by size of the company or by market capitalization. |
| Select Your Default Chart Type: | |||||
| |||||
| Click on stock symbol or name for detailed view. Click on to add stock symbol to your watchlist and to view watchlist. Quick View: Move mouse or cursor over "Daily" to quickly view daily technical stock chart and over "Weekly" to view weekly technical stock chart. | |||||

 | TRUP Trupanion, Inc. |
| Sector: Financials | |
| SubSector: Accident & Health Insurance | |
| MarketCap: 852.06 Millions | |
| Recent Price: 32.82 Smart Investing & Trading Score: 100 | |
| Day Percent Change: 15.85% Day Change: 4.49 | |
| Week Change: 27.21% Year-to-date Change: 7.6% | |
| TRUP Links: Profile News Message Board | |
| Charts:- Daily , Weekly | |
| Add TRUP to Watchlist: View: Get Complete TRUP Trend Analysis ➞ | |
 | DOUG Douglas Elliman Inc. |
| Sector: Financials | |
| SubSector: Financials Services | |
| MarketCap: 197 Millions | |
| Recent Price: 1.41 Smart Investing & Trading Score: 32 | |
| Day Percent Change: 9.30% Day Change: 0.12 | |
| Week Change: 19.49% Year-to-date Change: -51.9% | |
| DOUG Links: Profile News Message Board | |
| Charts:- Daily , Weekly | |
| Add DOUG to Watchlist: View: Get Complete DOUG Trend Analysis ➞ | |
 | SLQT SelectQuote, Inc. |
| Sector: Financials | |
| SubSector: Insurance Brokers | |
| MarketCap: 38257 Millions | |
| Recent Price: 3.05 Smart Investing & Trading Score: 95 | |
| Day Percent Change: 3.74% Day Change: 0.11 | |
| Week Change: 16.41% Year-to-date Change: 122.6% | |
| SLQT Links: Profile News Message Board | |
| Charts:- Daily , Weekly | |
| Add SLQT to Watchlist: View: Get Complete SLQT Trend Analysis ➞ | |
 | SNFCA Security National Financial Corporation |
| Sector: Financials | |
| SubSector: Credit Services | |
| MarketCap: 81.0208 Millions | |
| Recent Price: 7.78 Smart Investing & Trading Score: 67 | |
| Day Percent Change: -0.38% Day Change: -0.03 | |
| Week Change: 15.26% Year-to-date Change: -13.6% | |
| SNFCA Links: Profile News Message Board | |
| Charts:- Daily , Weekly | |
| Add SNFCA to Watchlist: View: Get Complete SNFCA Trend Analysis ➞ | |
 | FFWM First Foundation Inc. |
| Sector: Financials | |
| SubSector: Regional - Midwest Banks | |
| MarketCap: 457.17 Millions | |
| Recent Price: 5.91 Smart Investing & Trading Score: 49 | |
| Day Percent Change: 1.03% Day Change: 0.06 | |
| Week Change: 12.14% Year-to-date Change: -39.0% | |
| FFWM Links: Profile News Message Board | |
| Charts:- Daily , Weekly | |
| Add FFWM to Watchlist: View: Get Complete FFWM Trend Analysis ➞ | |
 | CWK Cushman & Wakefield plc |
| Sector: Financials | |
| SubSector: Property Management | |
| MarketCap: 2651.62 Millions | |
| Recent Price: 11.65 Smart Investing & Trading Score: 100 | |
| Day Percent Change: 2.37% Day Change: 0.27 | |
| Week Change: 11.75% Year-to-date Change: 7.9% | |
| CWK Links: Profile News Message Board | |
| Charts:- Daily , Weekly | |
| Add CWK to Watchlist: View: Get Complete CWK Trend Analysis ➞ | |
 | MLP Maui Land & Pineapple Company, Inc. |
| Sector: Financials | |
| SubSector: Real Estate Development | |
| MarketCap: 186.619 Millions | |
| Recent Price: 23.02 Smart Investing & Trading Score: 100 | |
| Day Percent Change: 1.81% Day Change: 0.41 | |
| Week Change: 10.41% Year-to-date Change: 44.9% | |
| MLP Links: Profile News Message Board | |
| Charts:- Daily , Weekly | |
| Add MLP to Watchlist: View: Get Complete MLP Trend Analysis ➞ | |
 | GCBC Greene County Bancorp, Inc. |
| Sector: Financials | |
| SubSector: Savings & Loans | |
| MarketCap: 314.83 Millions | |
| Recent Price: 32.40 Smart Investing & Trading Score: 100 | |
| Day Percent Change: 0.12% Day Change: 0.04 | |
| Week Change: 9.76% Year-to-date Change: 14.9% | |
| GCBC Links: Profile News Message Board | |
| Charts:- Daily , Weekly | |
| Add GCBC to Watchlist: View: Get Complete GCBC Trend Analysis ➞ | |
 | TRC Tejon Ranch Co. |
| Sector: Financials | |
| SubSector: Property Management | |
| MarketCap: 346.442 Millions | |
| Recent Price: 17.84 Smart Investing & Trading Score: 100 | |
| Day Percent Change: 5.94% Day Change: 1.00 | |
| Week Change: 9.72% Year-to-date Change: 3.7% | |
| TRC Links: Profile News Message Board | |
| Charts:- Daily , Weekly | |
| Add TRC to Watchlist: View: Get Complete TRC Trend Analysis ➞ | |
 | AI C3.ai, Inc. |
| Sector: Financials | |
| SubSector: REIT Mortgage | |
| MarketCap: 12467 Millions | |
| Recent Price: 26.20 Smart Investing & Trading Score: 59 | |
| Day Percent Change: -1.47% Day Change: -0.39 | |
| Week Change: 9.67% Year-to-date Change: -8.7% | |
| AI Links: Profile News Message Board | |
| Charts:- Daily , Weekly | |
| Add AI to Watchlist: View: Get Complete AI Trend Analysis ➞ | |
 | CIFR Cipher Mining Inc. |
| Sector: Financials | |
| SubSector: Capital Markets | |
| MarketCap: 712 Millions | |
| Recent Price: 4.07 Smart Investing & Trading Score: 63 | |
| Day Percent Change: -2.16% Day Change: -0.09 | |
| Week Change: 9.41% Year-to-date Change: -1.0% | |
| CIFR Links: Profile News Message Board | |
| Charts:- Daily , Weekly | |
| Add CIFR to Watchlist: View: Get Complete CIFR Trend Analysis ➞ | |
 | BRP BRP Group, Inc. |
| Sector: Financials | |
| SubSector: Real Estate Development | |
| MarketCap: 741.219 Millions | |
| Recent Price: 32.51 Smart Investing & Trading Score: 95 | |
| Day Percent Change: 8.91% Day Change: 2.66 | |
| Week Change: 9.2% Year-to-date Change: 35.4% | |
| BRP Links: Profile News Message Board | |
| Charts:- Daily , Weekly | |
| Add BRP to Watchlist: View: Get Complete BRP Trend Analysis ➞ | |
 | IIPR Innovative Industrial Properties, Inc. |
| Sector: Financials | |
| SubSector: REIT - Industrial | |
| MarketCap: 1193.29 Millions | |
| Recent Price: 113.70 Smart Investing & Trading Score: 100 | |
| Day Percent Change: 0.57% Day Change: 0.65 | |
| Week Change: 8.88% Year-to-date Change: 12.8% | |
| IIPR Links: Profile News Message Board | |
| Charts:- Daily , Weekly | |
| Add IIPR to Watchlist: View: Get Complete IIPR Trend Analysis ➞ | |
 | NRIM Northrim BanCorp, Inc. |
| Sector: Financials | |
| SubSector: Regional - Pacific Banks | |
| MarketCap: 147.629 Millions | |
| Recent Price: 56.21 Smart Investing & Trading Score: 100 | |
| Day Percent Change: -0.43% Day Change: -0.24 | |
| Week Change: 8.62% Year-to-date Change: -1.8% | |
| NRIM Links: Profile News Message Board | |
| Charts:- Daily , Weekly | |
| Add NRIM to Watchlist: View: Get Complete NRIM Trend Analysis ➞ | |
 | VCTR Victory Capital Holdings, Inc. |
| Sector: Financials | |
| SubSector: Asset Management | |
| MarketCap: 1148.33 Millions | |
| Recent Price: 52.05 Smart Investing & Trading Score: 88 | |
| Day Percent Change: -0.17% Day Change: -0.09 | |
| Week Change: 7.7% Year-to-date Change: 51.1% | |
| VCTR Links: Profile News Message Board | |
| Charts:- Daily , Weekly | |
| Add VCTR to Watchlist: View: Get Complete VCTR Trend Analysis ➞ | |
 | NODK NI Holdings, Inc. |
| Sector: Financials | |
| SubSector: Property & Casualty Insurance | |
| MarketCap: 238.112 Millions | |
| Recent Price: 16.18 Smart Investing & Trading Score: 100 | |
| Day Percent Change: 2.34% Day Change: 0.37 | |
| Week Change: 7.44% Year-to-date Change: 24.6% | |
| NODK Links: Profile News Message Board | |
| Charts:- Daily , Weekly | |
| Add NODK to Watchlist: View: Get Complete NODK Trend Analysis ➞ | |
 | FCCO First Community Corporation |
| Sector: Financials | |
| SubSector: Regional - Southwest Banks | |
| MarketCap: 123.865 Millions | |
| Recent Price: 17.31 Smart Investing & Trading Score: 100 | |
| Day Percent Change: 0.14% Day Change: 0.02 | |
| Week Change: 7.28% Year-to-date Change: -19.6% | |
| FCCO Links: Profile News Message Board | |
| Charts:- Daily , Weekly | |
| Add FCCO to Watchlist: View: Get Complete FCCO Trend Analysis ➞ | |
 | EVER EverQuote, Inc. |
| Sector: Financials | |
| SubSector: Regional - Southeast Banks | |
| MarketCap: 767.135 Millions | |
| Recent Price: 24.39 Smart Investing & Trading Score: 100 | |
| Day Percent Change: 3.26% Day Change: 0.77 | |
| Week Change: 6.97% Year-to-date Change: 99.3% | |
| EVER Links: Profile News Message Board | |
| Charts:- Daily , Weekly | |
| Add EVER to Watchlist: View: Get Complete EVER Trend Analysis ➞ | |
 | KRNY Kearny Financial Corp. |
| Sector: Financials | |
| SubSector: Savings & Loans | |
| MarketCap: 781.73 Millions | |
| Recent Price: 6.03 Smart Investing & Trading Score: 74 | |
| Day Percent Change: 1.09% Day Change: 0.07 | |
| Week Change: 6.83% Year-to-date Change: -32.8% | |
| KRNY Links: Profile News Message Board | |
| Charts:- Daily , Weekly | |
| Add KRNY to Watchlist: View: Get Complete KRNY Trend Analysis ➞ | |
 | LMND Lemonade, Inc. |
| Sector: Financials | |
| SubSector: Insurance Property & Casualty | |
| MarketCap: 56457 Millions | |
| Recent Price: 17.70 Smart Investing & Trading Score: 48 | |
| Day Percent Change: -3.59% Day Change: -0.66 | |
| Week Change: 6.76% Year-to-date Change: 9.7% | |
| LMND Links: Profile News Message Board | |
| Charts:- Daily , Weekly | |
| Add LMND to Watchlist: View: Get Complete LMND Trend Analysis ➞ | |
 | EHTH eHealth, Inc. |
| Sector: Financials | |
| SubSector: Insurance Brokers | |
| MarketCap: 2813.57 Millions | |
| Recent Price: 5.49 Smart Investing & Trading Score: 39 | |
| Day Percent Change: 3.39% Day Change: 0.18 | |
| Week Change: 6.4% Year-to-date Change: -37.0% | |
| EHTH Links: Profile News Message Board | |
| Charts:- Daily , Weekly | |
| Add EHTH to Watchlist: View: Get Complete EHTH Trend Analysis ➞ | |
 | NMRK Newmark Group, Inc. |
| Sector: Financials | |
| SubSector: Property Management | |
| MarketCap: 767.542 Millions | |
| Recent Price: 10.92 Smart Investing & Trading Score: 69 | |
| Day Percent Change: 1.02% Day Change: 0.11 | |
| Week Change: 6.28% Year-to-date Change: -0.4% | |
| NMRK Links: Profile News Message Board | |
| Charts:- Daily , Weekly | |
| Add NMRK to Watchlist: View: Get Complete NMRK Trend Analysis ➞ | |
 | SAMG Silvercrest Asset Management Group Inc. |
| Sector: Financials | |
| SubSector: Asset Management | |
| MarketCap: 116.303 Millions | |
| Recent Price: 15.94 Smart Investing & Trading Score: 74 | |
| Day Percent Change: 3.91% Day Change: 0.60 | |
| Week Change: 6.2% Year-to-date Change: -6.2% | |
| SAMG Links: Profile News Message Board | |
| Charts:- Daily , Weekly | |
| Add SAMG to Watchlist: View: Get Complete SAMG Trend Analysis ➞ | |
 | SAFE Safehold Inc. |
| Sector: Financials | |
| SubSector: REIT - Diversified | |
| MarketCap: 2994.63 Millions | |
| Recent Price: 20.39 Smart Investing & Trading Score: 88 | |
| Day Percent Change: -1.88% Day Change: -0.39 | |
| Week Change: 6.06% Year-to-date Change: -12.9% | |
| SAFE Links: Profile News Message Board | |
| Charts:- Daily , Weekly | |
| Add SAFE to Watchlist: View: Get Complete SAFE Trend Analysis ➞ | |
 | LGIH LGI Homes, Inc. |
| Sector: Financials | |
| SubSector: Real Estate Development | |
| MarketCap: 1316.49 Millions | |
| Recent Price: 105.24 Smart Investing & Trading Score: 69 | |
| Day Percent Change: -1.86% Day Change: -1.99 | |
| Week Change: 5.89% Year-to-date Change: -21.0% | |
| LGIH Links: Profile News Message Board | |
| Charts:- Daily , Weekly | |
| Add LGIH to Watchlist: View: Get Complete LGIH Trend Analysis ➞ | |
| For tabular summary view of above stock list: Summary View ➞ 0 - 25 , 25 - 50 , 50 - 75 , 75 - 100 , 100 - 125 , 125 - 150 , 150 - 175 , 175 - 200 , 200 - 225 , 225 - 250 , 250 - 275 , 275 - 300 , 300 - 325 , 325 - 350 , 350 - 375 , 375 - 400 | ||
| Click To Change The Sort Order: By Market Cap or Company Size Performance: Year-to-date, Week and Day | |
| Select Chart Type: | ||
| Too many stocks? View smallcap stocks filtered by marketcap & sector |
| Marketcap: All SmallCap Stocks (default-no microcap), Large, Mid-Range, Small & MicroCap |
| Sector: Tech, Finance, Energy, Staples, Retail, Industrial, Materials, Utilities & Medical |
|
Best Stocks Today 12Stocks.com |
© 2024 12Stocks.com Terms & Conditions Privacy Contact Us
All Information Provided Only For Education And Not To Be Used For Investing or Trading. See Terms & Conditions


One More Thing ... Get Best Stocks Delivered Daily!
Never Ever Miss A Move With Our Top Ten Stocks Lists
Find Best Stocks In Any Market - Bull or Bear Market
Take A Peek At Our Top Ten Stocks Lists: Daily, Weekly, Year-to-Date & Top Trends
Find Best Stocks In Any Market - Bull or Bear Market
Take A Peek At Our Top Ten Stocks Lists: Daily, Weekly, Year-to-Date & Top Trends
Smallcap Stocks With Best Up Trends [0-bearish to 100-bullish]: Trupanion [100], Hawkins [100], Tejon Ranch[100], Gannett Co[100], Seneca Foods[100], BRC [100], BJ s[100], Life Time[100], Vanda [100], Kronos Worldwide[100], NovaGold Resources[100]
Best Smallcap Stocks Year-to-Date:
CareMax [471.13%], Bakkt [370.4%], Janux [342.16%], Viking [304.73%], Alpine Immune[241.18%], Longboard [235.68%], Super Micro[218.16%], Avidity Biosciences[217.7%], Novavax [200%], Arcutis Bio[182.35%], Sweetgreen [181.24%] Best Smallcap Stocks This Week:
Novavax [62.16%], MacroGenics [54.68%], Maxeon Solar[49.31%], SunPower [43.04%], Harrow Health[39.31%], Workhorse Group[39.06%], Humacyte [36.6%], ProKidney [34.88%], Allbirds [33.47%], Cadiz [28.76%], Fossil Group[28.72%] Best Smallcap Stocks Daily:
Maxeon Solar[26.56%], Allakos [22.36%], Ventyx Biosciences[18.85%], Trupanion [15.85%], Zura Bio[15.61%], Beyond Air[15.42%], SilverBow Resources[13.20%], Children s[13.09%], Comtech Tele[12.92%], Aceto [12.14%], Novavax [11.63%]