
 Login Sign Up


| |||||
 |  | ||||

| 12Stocks.com Market Intelligence |
Best SmallCap Stocks
|
| In a hurry? Small Cap Stock Lists: Performance Trends Table, Stock Charts
Sort Small Cap stocks: Daily, Weekly, Year-to-Date, Market Cap & Trends. Filter Small Cap stocks list by sector: Show all, Tech, Finance, Energy, Staples, Retail, Industrial, Materials, Utilities and HealthCare Filter Small Cap stocks list by size: All Large Medium Small and MicroCap |
| 12Stocks.com Small Cap Stocks Performances & Trends Daily | |||||||||
|
|  The overall Smart Investing & Trading Score is 23 (0-bearish to 100-bullish) which puts Small Cap index in short term bearish to neutral trend. The Smart Investing & Trading Score from previous trading session is 13 and hence an improvement of trend.
| ||||||||
Here are the Smart Investing & Trading Scores of the most requested small cap stocks at 12Stocks.com (click stock name for detailed review):
|


| 12Stocks.com: Investing in Smallcap Index with Stocks | |
|
The following table helps investors and traders sort through current performance and trends (as measured by Smart Investing & Trading Score) of various
stocks in the Smallcap Index. Quick View: Move mouse or cursor over stock symbol (ticker) to view short-term technical chart and over stock name to view long term chart. Click on  to add stock symbol to your watchlist and to add stock symbol to your watchlist and  to view watchlist. Click on any ticker or stock name for detailed market intelligence report for that stock. to view watchlist. Click on any ticker or stock name for detailed market intelligence report for that stock. |
12Stocks.com Performance of Stocks in Smallcap Index
| Ticker | Stock Name | Watchlist | Category | Recent Price | Smart Investing & Trading Score | Change % | Weekly Change% |
| MCBC | Macatawa Bank |   | Financials | 13.85 | 100 | 1.17% | 44.42% |
| JRVR | James River | | Financials | 9.21 | 59 | 5.62% | 8.87% |
| GOCO | GoHealth | | Financials | 10.24 | 42 | 3.33% | 7.45% |
| VCTR | Victory Capital | | Financials | 45.90 | 100 | 2.78% | 6.87% |
| TBBK | Bancorp | | Financials | 33.19 | 57 | 1.07% | 5.43% |
| GDOT | Green Dot | | Financials | 8.42 | 47 | 2.56% | 5.25% |
| LCNB | LCNB | | Financials | 14.77 | 65 | 1.86% | 5.20% |
| ESSA | ESSA Bancorp | | Financials | 16.66 | 10 | -3.00% | 4.94% |
| AMSF | Amerisafe | | Financials | 50.01 | 80 | 2.80% | 4.71% |
| FIHL | Fidelis Insurance | | Financials | 19.37 | 76 | 3.80% | 4.70% |
| PLMR | Palomar | | Financials | 77.77 | 68 | 1.13% | 4.52% |
| CMTG | Claros Mortgage | | Financials | 9.01 | 42 | 4.52% | 3.80% |
| HMN | Horace Mann | | Financials | 35.40 | 37 | 2.67% | 3.66% |
| MCY | Mercury General | | Financials | 52.67 | 90 | 1.23% | 3.48% |
| NHI | National Health | | Financials | 60.44 | 68 | 1.49% | 3.46% |
| TRC | Tejon Ranch | | Financials | 15.69 | 87 | 5.44% | 3.22% |
| GCBC | Greene County | | Financials | 27.40 | 78 | 0.51% | 3.12% |
| SFST | Southern First | | Financials | 27.26 | 42 | 1.68% | 2.64% |
| BKU | BankUnited | | Financials | 25.87 | 42 | 2.70% | 2.46% |
| DGICA | Donegal Group | | Financials | 13.64 | 42 | 1.94% | 2.40% |
| OSBC | Old Second | | Financials | 13.74 | 65 | 2.23% | 2.38% |
| JXN | Jackson Financial | | Financials | 64.89 | 68 | 2.08% | 2.37% |
| ABR | Arbor Realty | | Financials | 12.48 | 42 | 2.72% | 2.30% |
| RC | Ready Capital | | Financials | 8.47 | 45 | 0.00% | 1.80% |
| KRG | Kite Realty | | Financials | 20.56 | 42 | 2.34% | 1.78% |
| For chart view version of above stock list: Chart View ➞ 0 - 25 , 25 - 50 , 50 - 75 , 75 - 100 , 100 - 125 , 125 - 150 , 150 - 175 , 175 - 200 , 200 - 225 , 225 - 250 , 250 - 275 , 275 - 300 , 300 - 325 , 325 - 350 , 350 - 375 , 375 - 400 | ||
 | Click To Change The Sort Order: By Market Cap or Company Size Performance: Year-to-date, Week and Day |  |
| Too many stocks? View smallcap stocks filtered by marketcap & sector |
| Marketcap: All SmallCap Stocks (default-no microcap), Large, Mid-Range, Small |
| Smallcap Sector: Tech, Finance, Energy, Staples, Retail, Industrial, Materials, & Medical |
|
Get the most comprehensive stock market coverage daily at 12Stocks.com ➞ Best Stocks Today ➞ Best Stocks Weekly ➞ Best Stocks Year-to-Date ➞ Best Stocks Trends ➞  Best Stocks Today 12Stocks.com Best Nasdaq Stocks ➞ Best S&P 500 Stocks ➞ Best Tech Stocks ➞ Best Biotech Stocks ➞ |
| Detailed Overview of SmallCap Stocks |
| SmallCap Technical Overview, Leaders & Laggards, Top SmallCap ETF Funds & Detailed SmallCap Stocks List, Charts, Trends & More |
| Smallcap: Technical Analysis, Trends & YTD Performance | |
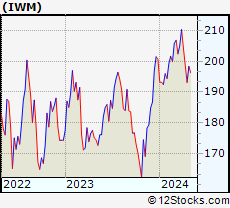
| SmallCap segment as represented by
IWM, an exchange-traded fund [ETF], holds basket of thousands of smallcap stocks from across all major sectors of the US stock market. The smallcap index (contains stocks like Riverbed & Sotheby's) is down by -3.92% and is currently underperforming the overall market by -8.11% year-to-date. Below is a quick view of technical charts and trends: | |
 IWM Weekly Chart |
|
| Long Term Trend: Not Good | |
| Medium Term Trend: Not Good | |
 IWM Daily Chart |
|
| Short Term Trend: Not Good | |
| Overall Trend Score: 23 | |
| YTD Performance: -3.92% | |
| **Trend Scores & Views Are Only For Educational Purposes And Not For Investing | |
| 12Stocks.com: Top Performing Small Cap Index Stocks | ||||||||||||||||||||||||||||||||||||||||||||||||
 The top performing Small Cap Index stocks year to date are
Now, more recently, over last week, the top performing Small Cap Index stocks on the move are


|
||||||||||||||||||||||||||||||||||||||||||||||||
| 12Stocks.com: Investing in Smallcap Index using Exchange Traded Funds | |
|
The following table shows list of key exchange traded funds (ETF) that
help investors track Smallcap index. The following list also includes leveraged ETF funds that track twice or thrice the daily returns of Smallcap indices. Short or inverse ETF funds move in the opposite direction to the index they track and are useful during market pullbacks or during bear markets. Quick View: Move mouse or cursor over ETF symbol (ticker) to view short-term technical chart and over ETF name to view long term chart. Click on ticker or stock name for detailed view. Click on to add stock symbol to your watchlist and to view watchlist. |
12Stocks.com List of ETFs that track Smallcap Index
| Ticker | ETF Name | Watchlist | Recent Price | Smart Investing & Trading Score | Change % | Week % | Year-to-date % |
| IWM | iShares Russell 2000 | | 192.84 | 23 | -0.08 | -2.94 | -3.92% |
| IJR | iShares Core S&P Small-Cap | | 102.34 | 31 | 0.21 | -2.08 | -5.46% |
| VTWO | Vanguard Russell 2000 ETF | | 77.95 | 23 | -0.13 | -2.95 | -3.88% |
| IWN | iShares Russell 2000 Value | | 146.33 | 10 | 0.21 | -2.69 | -5.79% |
| IJS | iShares S&P Small-Cap 600 Value | | 94.51 | 10 | 0.41 | -1.73 | -8.31% |
| IWO | iShares Russell 2000 Growth | | 246.94 | 36 | -0.44 | -3.3 | -2.09% |
| IJT | iShares S&P Small-Cap 600 Growth | | 121.57 | 23 | -0.22 | -2.57 | -2.85% |
| XSLV | PowerShares S&P SmallCap Low Volatil ETF | | 41.65 | 25 | 0.56 | -1.05 | -5.66% |
| SAA | ProShares Ultra SmallCap600 | | 21.62 | 10 | -0.18 | -4.17 | -13.35% |
| SMLV | SPDR SSGA US Small Cap Low Volatil ETF | | 103.83 | 10 | 0.16 | -1.13 | -7.72% |
| SBB | ProShares Short SmallCap600 | | 16.98 | 95 | 0.77 | 2.62 | 6.59% |
| SDD | ProShares UltraShort SmallCap600 | | 20.69 | 83 | 0.44 | 4.33 | 12.28% |
| 12Stocks.com: Charts, Trends, Fundamental Data and Performances of SmallCap Stocks | |
|
We now take in-depth look at all SmallCap stocks including charts, multi-period performances and overall trends (as measured by Smart Investing & Trading Score). One can sort SmallCap stocks (click link to choose) by Daily, Weekly and by Year-to-Date performances. Also, one can sort by size of the company or by market capitalization. |
| Select Your Default Chart Type: | |||||
| |||||
| Click on stock symbol or name for detailed view. Click on to add stock symbol to your watchlist and to view watchlist. Quick View: Move mouse or cursor over "Daily" to quickly view daily technical stock chart and over "Weekly" to view weekly technical stock chart. | |||||

 | MCBC Macatawa Bank Corporation |
| Sector: Financials | |
| SubSector: Regional - Midwest Banks | |
| MarketCap: 264.37 Millions | |
| Recent Price: 13.85 Smart Investing & Trading Score: 100 | |
| Day Percent Change: 1.17% Day Change: 0.16 | |
| Week Change: 44.42% Year-to-date Change: 22.8% | |
| MCBC Links: Profile News Message Board | |
| Charts:- Daily , Weekly | |
| Add MCBC to Watchlist: View: Get Complete MCBC Trend Analysis ➞ | |
 | JRVR James River Group Holdings, Ltd. |
| Sector: Financials | |
| SubSector: Property & Casualty Insurance | |
| MarketCap: 978.312 Millions | |
| Recent Price: 9.21 Smart Investing & Trading Score: 59 | |
| Day Percent Change: 5.62% Day Change: 0.49 | |
| Week Change: 8.87% Year-to-date Change: -0.3% | |
| JRVR Links: Profile News Message Board | |
| Charts:- Daily , Weekly | |
| Add JRVR to Watchlist: View: Get Complete JRVR Trend Analysis ➞ | |
 | GOCO GoHealth, Inc. |
| Sector: Financials | |
| SubSector: Insurance Brokers | |
| MarketCap: 44157 Millions | |
| Recent Price: 10.24 Smart Investing & Trading Score: 42 | |
| Day Percent Change: 3.33% Day Change: 0.33 | |
| Week Change: 7.45% Year-to-date Change: -22.0% | |
| GOCO Links: Profile News Message Board | |
| Charts:- Daily , Weekly | |
| Add GOCO to Watchlist: View: Get Complete GOCO Trend Analysis ➞ | |
 | VCTR Victory Capital Holdings, Inc. |
| Sector: Financials | |
| SubSector: Asset Management | |
| MarketCap: 1148.33 Millions | |
| Recent Price: 45.90 Smart Investing & Trading Score: 100 | |
| Day Percent Change: 2.78% Day Change: 1.24 | |
| Week Change: 6.87% Year-to-date Change: 33.3% | |
| VCTR Links: Profile News Message Board | |
| Charts:- Daily , Weekly | |
| Add VCTR to Watchlist: View: Get Complete VCTR Trend Analysis ➞ | |
 | TBBK The Bancorp, Inc. |
| Sector: Financials | |
| SubSector: Regional - Mid-Atlantic Banks | |
| MarketCap: 267.859 Millions | |
| Recent Price: 33.19 Smart Investing & Trading Score: 57 | |
| Day Percent Change: 1.07% Day Change: 0.35 | |
| Week Change: 5.43% Year-to-date Change: -13.9% | |
| TBBK Links: Profile News Message Board | |
| Charts:- Daily , Weekly | |
| Add TBBK to Watchlist: View: Get Complete TBBK Trend Analysis ➞ | |
 | GDOT Green Dot Corporation |
| Sector: Financials | |
| SubSector: Credit Services | |
| MarketCap: 1320.08 Millions | |
| Recent Price: 8.42 Smart Investing & Trading Score: 47 | |
| Day Percent Change: 2.56% Day Change: 0.21 | |
| Week Change: 5.25% Year-to-date Change: -15.0% | |
| GDOT Links: Profile News Message Board | |
| Charts:- Daily , Weekly | |
| Add GDOT to Watchlist: View: Get Complete GDOT Trend Analysis ➞ | |
 | LCNB LCNB Corp. |
| Sector: Financials | |
| SubSector: Regional - Mid-Atlantic Banks | |
| MarketCap: 176.759 Millions | |
| Recent Price: 14.77 Smart Investing & Trading Score: 65 | |
| Day Percent Change: 1.86% Day Change: 0.27 | |
| Week Change: 5.2% Year-to-date Change: -6.3% | |
| LCNB Links: Profile News Message Board | |
| Charts:- Daily , Weekly | |
| Add LCNB to Watchlist: View: Get Complete LCNB Trend Analysis ➞ | |
 | ESSA ESSA Bancorp, Inc. |
| Sector: Financials | |
| SubSector: Savings & Loans | |
| MarketCap: 171.33 Millions | |
| Recent Price: 16.66 Smart Investing & Trading Score: 10 | |
| Day Percent Change: -3.00% Day Change: -0.52 | |
| Week Change: 4.94% Year-to-date Change: -16.8% | |
| ESSA Links: Profile News Message Board | |
| Charts:- Daily , Weekly | |
| Add ESSA to Watchlist: View: Get Complete ESSA Trend Analysis ➞ | |
 | AMSF Amerisafe, Inc. |
| Sector: Financials | |
| SubSector: Property & Casualty Insurance | |
| MarketCap: 1159.32 Millions | |
| Recent Price: 50.01 Smart Investing & Trading Score: 80 | |
| Day Percent Change: 2.80% Day Change: 1.36 | |
| Week Change: 4.71% Year-to-date Change: 6.9% | |
| AMSF Links: Profile News Message Board | |
| Charts:- Daily , Weekly | |
| Add AMSF to Watchlist: View: Get Complete AMSF Trend Analysis ➞ | |
 | FIHL Fidelis Insurance Holdings Limited |
| Sector: Financials | |
| SubSector: Insurance - Diversified | |
| MarketCap: 1590 Millions | |
| Recent Price: 19.37 Smart Investing & Trading Score: 76 | |
| Day Percent Change: 3.80% Day Change: 0.71 | |
| Week Change: 4.7% Year-to-date Change: 53.3% | |
| FIHL Links: Profile News Message Board | |
| Charts:- Daily , Weekly | |
| Add FIHL to Watchlist: View: Get Complete FIHL Trend Analysis ➞ | |
 | PLMR Palomar Holdings, Inc. |
| Sector: Financials | |
| SubSector: Property & Casualty Insurance | |
| MarketCap: 1297.42 Millions | |
| Recent Price: 77.77 Smart Investing & Trading Score: 68 | |
| Day Percent Change: 1.13% Day Change: 0.87 | |
| Week Change: 4.52% Year-to-date Change: 40.1% | |
| PLMR Links: Profile News Message Board | |
| Charts:- Daily , Weekly | |
| Add PLMR to Watchlist: View: Get Complete PLMR Trend Analysis ➞ | |
 | CMTG Claros Mortgage Trust, Inc. |
| Sector: Financials | |
| SubSector: REIT - Mortgage | |
| MarketCap: 1610 Millions | |
| Recent Price: 9.01 Smart Investing & Trading Score: 42 | |
| Day Percent Change: 4.52% Day Change: 0.39 | |
| Week Change: 3.8% Year-to-date Change: -35.1% | |
| CMTG Links: Profile News Message Board | |
| Charts:- Daily , Weekly | |
| Add CMTG to Watchlist: View: Get Complete CMTG Trend Analysis ➞ | |
 | HMN Horace Mann Educators Corporation |
| Sector: Financials | |
| SubSector: Property & Casualty Insurance | |
| MarketCap: 1545.52 Millions | |
| Recent Price: 35.40 Smart Investing & Trading Score: 37 | |
| Day Percent Change: 2.67% Day Change: 0.92 | |
| Week Change: 3.66% Year-to-date Change: 8.3% | |
| HMN Links: Profile News Message Board | |
| Charts:- Daily , Weekly | |
| Add HMN to Watchlist: View: Get Complete HMN Trend Analysis ➞ | |
 | MCY Mercury General Corporation |
| Sector: Financials | |
| SubSector: Property & Casualty Insurance | |
| MarketCap: 2122.12 Millions | |
| Recent Price: 52.67 Smart Investing & Trading Score: 90 | |
| Day Percent Change: 1.23% Day Change: 0.64 | |
| Week Change: 3.48% Year-to-date Change: 41.2% | |
| MCY Links: Profile News Message Board | |
| Charts:- Daily , Weekly | |
| Add MCY to Watchlist: View: Get Complete MCY Trend Analysis ➞ | |
 | NHI National Health Investors, Inc. |
| Sector: Financials | |
| SubSector: REIT - Healthcare Facilities | |
| MarketCap: 2156.54 Millions | |
| Recent Price: 60.44 Smart Investing & Trading Score: 68 | |
| Day Percent Change: 1.49% Day Change: 0.89 | |
| Week Change: 3.46% Year-to-date Change: 8.2% | |
| NHI Links: Profile News Message Board | |
| Charts:- Daily , Weekly | |
| Add NHI to Watchlist: View: Get Complete NHI Trend Analysis ➞ | |
 | TRC Tejon Ranch Co. |
| Sector: Financials | |
| SubSector: Property Management | |
| MarketCap: 346.442 Millions | |
| Recent Price: 15.69 Smart Investing & Trading Score: 87 | |
| Day Percent Change: 5.44% Day Change: 0.81 | |
| Week Change: 3.22% Year-to-date Change: -8.8% | |
| TRC Links: Profile News Message Board | |
| Charts:- Daily , Weekly | |
| Add TRC to Watchlist: View: Get Complete TRC Trend Analysis ➞ | |
 | GCBC Greene County Bancorp, Inc. |
| Sector: Financials | |
| SubSector: Savings & Loans | |
| MarketCap: 314.83 Millions | |
| Recent Price: 27.40 Smart Investing & Trading Score: 78 | |
| Day Percent Change: 0.51% Day Change: 0.14 | |
| Week Change: 3.12% Year-to-date Change: -2.8% | |
| GCBC Links: Profile News Message Board | |
| Charts:- Daily , Weekly | |
| Add GCBC to Watchlist: View: Get Complete GCBC Trend Analysis ➞ | |
 | SFST Southern First Bancshares, Inc. |
| Sector: Financials | |
| SubSector: Money Center Banks | |
| MarketCap: 189.099 Millions | |
| Recent Price: 27.26 Smart Investing & Trading Score: 42 | |
| Day Percent Change: 1.68% Day Change: 0.45 | |
| Week Change: 2.64% Year-to-date Change: -26.5% | |
| SFST Links: Profile News Message Board | |
| Charts:- Daily , Weekly | |
| Add SFST to Watchlist: View: Get Complete SFST Trend Analysis ➞ | |
 | BKU BankUnited, Inc. |
| Sector: Financials | |
| SubSector: Regional - Mid-Atlantic Banks | |
| MarketCap: 1905.99 Millions | |
| Recent Price: 25.87 Smart Investing & Trading Score: 42 | |
| Day Percent Change: 2.70% Day Change: 0.68 | |
| Week Change: 2.46% Year-to-date Change: -20.2% | |
| BKU Links: Profile News Message Board | |
| Charts:- Daily , Weekly | |
| Add BKU to Watchlist: View: Get Complete BKU Trend Analysis ➞ | |
 | DGICA Donegal Group Inc. |
| Sector: Financials | |
| SubSector: Property & Casualty Insurance | |
| MarketCap: 350.512 Millions | |
| Recent Price: 13.64 Smart Investing & Trading Score: 42 | |
| Day Percent Change: 1.94% Day Change: 0.26 | |
| Week Change: 2.4% Year-to-date Change: -2.5% | |
| DGICA Links: Profile News Message Board | |
| Charts:- Daily , Weekly | |
| Add DGICA to Watchlist: View: Get Complete DGICA Trend Analysis ➞ | |
 | OSBC Old Second Bancorp, Inc. |
| Sector: Financials | |
| SubSector: Regional - Midwest Banks | |
| MarketCap: 237.17 Millions | |
| Recent Price: 13.74 Smart Investing & Trading Score: 65 | |
| Day Percent Change: 2.23% Day Change: 0.30 | |
| Week Change: 2.38% Year-to-date Change: -11.0% | |
| OSBC Links: Profile News Message Board | |
| Charts:- Daily , Weekly | |
| Add OSBC to Watchlist: View: Get Complete OSBC Trend Analysis ➞ | |
 | JXN Jackson Financial Inc. |
| Sector: Financials | |
| SubSector: Insurance - Life | |
| MarketCap: 2460 Millions | |
| Recent Price: 64.89 Smart Investing & Trading Score: 68 | |
| Day Percent Change: 2.08% Day Change: 1.33 | |
| Week Change: 2.37% Year-to-date Change: 26.2% | |
| JXN Links: Profile News Message Board | |
| Charts:- Daily , Weekly | |
| Add JXN to Watchlist: View: Get Complete JXN Trend Analysis ➞ | |
 | ABR Arbor Realty Trust, Inc. |
| Sector: Financials | |
| SubSector: Mortgage Investment | |
| MarketCap: 648.939 Millions | |
| Recent Price: 12.48 Smart Investing & Trading Score: 42 | |
| Day Percent Change: 2.72% Day Change: 0.33 | |
| Week Change: 2.3% Year-to-date Change: -17.8% | |
| ABR Links: Profile News Message Board | |
| Charts:- Daily , Weekly | |
| Add ABR to Watchlist: View: Get Complete ABR Trend Analysis ➞ | |
 | RC Ready Capital Corporation |
| Sector: Financials | |
| SubSector: Mortgage Investment | |
| MarketCap: 358.039 Millions | |
| Recent Price: 8.47 Smart Investing & Trading Score: 45 | |
| Day Percent Change: 0.00% Day Change: 0.00 | |
| Week Change: 1.8% Year-to-date Change: -17.4% | |
| RC Links: Profile News Message Board | |
| Charts:- Daily , Weekly | |
| Add RC to Watchlist: View: Get Complete RC Trend Analysis ➞ | |
 | KRG Kite Realty Group Trust |
| Sector: Financials | |
| SubSector: REIT - Retail | |
| MarketCap: 1030.14 Millions | |
| Recent Price: 20.56 Smart Investing & Trading Score: 42 | |
| Day Percent Change: 2.34% Day Change: 0.47 | |
| Week Change: 1.78% Year-to-date Change: -10.1% | |
| KRG Links: Profile News Message Board | |
| Charts:- Daily , Weekly | |
| Add KRG to Watchlist: View: Get Complete KRG Trend Analysis ➞ | |
| For tabular summary view of above stock list: Summary View ➞ 0 - 25 , 25 - 50 , 50 - 75 , 75 - 100 , 100 - 125 , 125 - 150 , 150 - 175 , 175 - 200 , 200 - 225 , 225 - 250 , 250 - 275 , 275 - 300 , 300 - 325 , 325 - 350 , 350 - 375 , 375 - 400 | ||
| Click To Change The Sort Order: By Market Cap or Company Size Performance: Year-to-date, Week and Day | |
| Select Chart Type: | ||
| Too many stocks? View smallcap stocks filtered by marketcap & sector |
| Marketcap: All SmallCap Stocks (default-no microcap), Large, Mid-Range, Small & MicroCap |
| Sector: Tech, Finance, Energy, Staples, Retail, Industrial, Materials, Utilities & Medical |
|
Best Stocks Today 12Stocks.com |
© 2024 12Stocks.com Terms & Conditions Privacy Contact Us
All Information Provided Only For Education And Not To Be Used For Investing or Trading. See Terms & Conditions


One More Thing ... Get Best Stocks Delivered Daily!
Never Ever Miss A Move With Our Top Ten Stocks Lists
Find Best Stocks In Any Market - Bull or Bear Market
Take A Peek At Our Top Ten Stocks Lists: Daily, Weekly, Year-to-Date & Top Trends
Find Best Stocks In Any Market - Bull or Bear Market
Take A Peek At Our Top Ten Stocks Lists: Daily, Weekly, Year-to-Date & Top Trends
Smallcap Stocks With Best Up Trends [0-bearish to 100-bullish]: Badger Meter[100], Cullinan Oncology[100], Oscar Health[100], NextNav [100], EchoStar [100], Victory Capital[100], Macatawa Bank[100], IMAX [100], Envestnet [100], ALX Oncology[100], Argan [95]
Best Smallcap Stocks Year-to-Date:
Agenus [500.31%], CareMax [417.53%], Janux [348.12%], Viking [247.5%], Alpine Immune[238.5%], Super Micro[226.63%], Longboard [194.76%], Arcutis Bio[192.57%], Vera [161.3%], Avidity Biosciences[154.87%], Hippo [128.32%] Best Smallcap Stocks This Week:
Macatawa Bank[44.42%], 23andMe Holding[33.3%], ProKidney [32%], Snap One[29.73%], Vertex Energy[25.96%], ALX Oncology[20.64%], Vanda [20.63%], Expensify [18.37%], Badger Meter[16.72%], ContextLogic [15%], Cullinan Oncology[13.89%] Best Smallcap Stocks Daily:
23andMe Holding[65.91%], Vertex Energy[33.78%], Zura Bio[17.20%], Badger Meter[16.65%], ContextLogic [15.81%], Expensify [15.23%], Montrose Environmental[12.84%], Vaxxinity [10.05%], Cipher Mining[8.65%], FiscalNote [8.61%], Vuzix [8.15%]