
 Login Sign Up


| |||||
 |  | ||||

| 12Stocks.com Market Intelligence |
Best SmallCap Stocks
|
| In a hurry? Small Cap Stock Lists: Performance Trends Table, Stock Charts
Sort Small Cap stocks: Daily, Weekly, Year-to-Date, Market Cap & Trends. Filter Small Cap stocks list by sector: Show all, Tech, Finance, Energy, Staples, Retail, Industrial, Materials, Utilities and HealthCare Filter Small Cap stocks list by size: All Large Medium Small and MicroCap |
| 12Stocks.com Small Cap Stocks Performances & Trends Daily | |||||||||
|
|  The overall Smart Investing & Trading Score is 14 (0-bearish to 100-bullish) which puts Small Cap index in short term bearish trend. The Smart Investing & Trading Score from previous trading session is 41 and hence a deterioration of trend.
| ||||||||
Here are the Smart Investing & Trading Scores of the most requested small cap stocks at 12Stocks.com (click stock name for detailed review):
|


| 12Stocks.com: Investing in Smallcap Index with Stocks | |
|
The following table helps investors and traders sort through current performance and trends (as measured by Smart Investing & Trading Score) of various
stocks in the Smallcap Index. Quick View: Move mouse or cursor over stock symbol (ticker) to view short-term technical chart and over stock name to view long term chart. Click on  to add stock symbol to your watchlist and to add stock symbol to your watchlist and  to view watchlist. Click on any ticker or stock name for detailed market intelligence report for that stock. to view watchlist. Click on any ticker or stock name for detailed market intelligence report for that stock. |
12Stocks.com Performance of Stocks in Smallcap Index
| Ticker | Stock Name | Watchlist | Category | Recent Price | Smart Investing & Trading Score | Change % | Weekly Change% |
| BHB | Bar Harbor |   | Financials | 25.67 | 93 | 2.35% | 0.63% |
| LAND | Gladstone Land | | Financials | 12.76 | 52 | 0.63% | 0.63% |
| NFBK | Northfield Bancorp | | Financials | 8.57 | 57 | 2.76% | 0.59% |
| ARR | ARMOUR Residential | | Financials | 18.63 | 57 | 2.53% | 0.59% |
| PIPR | Piper Sandler | | Financials | 198.31 | 81 | 1.29% | 0.58% |
| SBCF | Seacoast Banking | | Financials | 23.51 | 62 | 1.91% | 0.56% |
| MLP | Maui Land | | Financials | 19.92 | 73 | 2.26% | 0.56% |
| MFA | MFA Financial | | Financials | 10.79 | 49 | 1.89% | 0.56% |
| FRPH | FRP | | Financials | 30.60 | 25 | 0.96% | 0.56% |
| GDOT | Green Dot | | Financials | 9.09 | 88 | 3.89% | 0.55% |
| BSRR | Sierra Bancorp | | Financials | 20.61 | 88 | 3.99% | 0.54% |
| ESRT | Empire State | | Financials | 9.26 | 35 | 1.76% | 0.54% |
| EQBK | Equity Bancshares | | Financials | 33.49 | 83 | 0.54% | 0.54% |
| FFBC | First Financial | | Financials | 22.69 | 93 | 2.62% | 0.53% |
| DEI | Douglas Emmett | | Financials | 13.44 | 71 | -1.97% | 0.52% |
| UNIT | Uniti Group | | Financials | 5.81 | 62 | 1.04% | 0.52% |
| PSTL | Postal Realty | | Financials | 13.80 | 40 | -0.36% | 0.51% |
| FCPT | Four Corners | | Financials | 23.56 | 57 | 0.47% | 0.51% |
| WABC | Westamerica Ban | | Financials | 47.67 | 86 | 2.41% | 0.48% |
| BLFY | Blue Foundry | | Financials | 8.82 | 67 | 3.28% | 0.46% |
| PDM | Piedmont Office | | Financials | 6.74 | 76 | -2.18% | 0.45% |
| EFSC | Enterprise Financial | | Financials | 38.97 | 60 | 2.53% | 0.44% |
| CATY | Cathay General | | Financials | 35.18 | 49 | 2.15% | 0.40% |
| BUSE | First Busey | | Financials | 22.89 | 57 | 2.46% | 0.39% |
| AHH | Armada Hoffler | | Financials | 10.61 | 83 | 0.86% | 0.38% |
| For chart view version of above stock list: Chart View ➞ 0 - 25 , 25 - 50 , 50 - 75 , 75 - 100 , 100 - 125 , 125 - 150 , 150 - 175 , 175 - 200 , 200 - 225 , 225 - 250 , 250 - 275 , 275 - 300 , 300 - 325 , 325 - 350 , 350 - 375 , 375 - 400 | ||
 | Click To Change The Sort Order: By Market Cap or Company Size Performance: Year-to-date, Week and Day |  |
| Too many stocks? View smallcap stocks filtered by marketcap & sector |
| Marketcap: All SmallCap Stocks (default-no microcap), Large, Mid-Range, Small |
| Smallcap Sector: Tech, Finance, Energy, Staples, Retail, Industrial, Materials, & Medical |
|
Get the most comprehensive stock market coverage daily at 12Stocks.com ➞ Best Stocks Today ➞ Best Stocks Weekly ➞ Best Stocks Year-to-Date ➞ Best Stocks Trends ➞  Best Stocks Today 12Stocks.com Best Nasdaq Stocks ➞ Best S&P 500 Stocks ➞ Best Tech Stocks ➞ Best Biotech Stocks ➞ |
| Detailed Overview of SmallCap Stocks |
| SmallCap Technical Overview, Leaders & Laggards, Top SmallCap ETF Funds & Detailed SmallCap Stocks List, Charts, Trends & More |
| Smallcap: Technical Analysis, Trends & YTD Performance | |
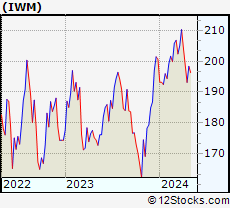
| SmallCap segment as represented by
IWM, an exchange-traded fund [ETF], holds basket of thousands of smallcap stocks from across all major sectors of the US stock market. The smallcap index (contains stocks like Riverbed & Sotheby's) is down by -2.19% and is currently underperforming the overall market by -6.73% year-to-date. Below is a quick view of technical charts and trends: | |
 IWM Weekly Chart |
|
| Long Term Trend: Not Good | |
| Medium Term Trend: Not Good | |
 IWM Daily Chart |
|
| Short Term Trend: Not Good | |
| Overall Trend Score: 14 | |
| YTD Performance: -2.19% | |
| **Trend Scores & Views Are Only For Educational Purposes And Not For Investing | |
| 12Stocks.com: Top Performing Small Cap Index Stocks | ||||||||||||||||||||||||||||||||||||||||||||||||
 The top performing Small Cap Index stocks year to date are
Now, more recently, over last week, the top performing Small Cap Index stocks on the move are


|
||||||||||||||||||||||||||||||||||||||||||||||||
| 12Stocks.com: Investing in Smallcap Index using Exchange Traded Funds | |
|
The following table shows list of key exchange traded funds (ETF) that
help investors track Smallcap index. The following list also includes leveraged ETF funds that track twice or thrice the daily returns of Smallcap indices. Short or inverse ETF funds move in the opposite direction to the index they track and are useful during market pullbacks or during bear markets. Quick View: Move mouse or cursor over ETF symbol (ticker) to view short-term technical chart and over ETF name to view long term chart. Click on ticker or stock name for detailed view. Click on to add stock symbol to your watchlist and to view watchlist. |
12Stocks.com List of ETFs that track Smallcap Index
| Ticker | ETF Name | Watchlist | Recent Price | Smart Investing & Trading Score | Change % | Week % | Year-to-date % |
| IWM | iShares Russell 2000 | | 196.31 | 14 | 0.21 | -1.05 | -2.19% |
| IJR | iShares Core S&P Small-Cap | | 104.74 | 22 | 0.34 | -0.86 | -3.24% |
| VTWO | Vanguard Russell 2000 ETF | | 79.36 | 14 | 0.25 | -1.07 | -2.15% |
| IWN | iShares Russell 2000 Value | | 149.82 | 22 | 0.52 | -0.87 | -3.55% |
| IJS | iShares S&P Small-Cap 600 Value | | 96.40 | 15 | 0.33 | -0.81 | -6.47% |
| IWO | iShares Russell 2000 Growth | | 249.58 | 7 | -0.30 | -1.39 | -1.05% |
| IJT | iShares S&P Small-Cap 600 Growth | | 124.94 | 15 | 0.27 | -0.91 | -0.16% |
| XSLV | PowerShares S&P SmallCap Low Volatil ETF | | 42.83 | 62 | 0.68 | 0.26 | -2.99% |
| SDD | ProShares UltraShort SmallCap600 | | 19.71 | 86 | 0.70 | 1.85 | 6.95% |
| SMLV | SPDR SSGA US Small Cap Low Volatil ETF | | 107.44 | 45 | 1.11 | -0.07 | -4.51% |
| SBB | ProShares Short SmallCap600 | | 16.56 | 79 | 0.05 | 1.06 | 3.94% |
| SAA | ProShares Ultra SmallCap600 | | 22.58 | 8 | -0.08 | -1.99 | -9.49% |
| 12Stocks.com: Charts, Trends, Fundamental Data and Performances of SmallCap Stocks | |
|
We now take in-depth look at all SmallCap stocks including charts, multi-period performances and overall trends (as measured by Smart Investing & Trading Score). One can sort SmallCap stocks (click link to choose) by Daily, Weekly and by Year-to-Date performances. Also, one can sort by size of the company or by market capitalization. |
| Select Your Default Chart Type: | |||||
| |||||
| Click on stock symbol or name for detailed view. Click on to add stock symbol to your watchlist and to view watchlist. Quick View: Move mouse or cursor over "Daily" to quickly view daily technical stock chart and over "Weekly" to view weekly technical stock chart. | |||||

 | BHB Bar Harbor Bankshares |
| Sector: Financials | |
| SubSector: Regional - Northeast Banks | |
| MarketCap: 298.099 Millions | |
| Recent Price: 25.67 Smart Investing & Trading Score: 93 | |
| Day Percent Change: 2.35% Day Change: 0.59 | |
| Week Change: 0.63% Year-to-date Change: -12.6% | |
| BHB Links: Profile News Message Board | |
| Charts:- Daily , Weekly | |
| Add BHB to Watchlist: View: Get Complete BHB Trend Analysis ➞ | |
 | LAND Gladstone Land Corporation |
| Sector: Financials | |
| SubSector: REIT - Diversified | |
| MarketCap: 252.653 Millions | |
| Recent Price: 12.76 Smart Investing & Trading Score: 52 | |
| Day Percent Change: 0.63% Day Change: 0.08 | |
| Week Change: 0.63% Year-to-date Change: -11.7% | |
| LAND Links: Profile News Message Board | |
| Charts:- Daily , Weekly | |
| Add LAND to Watchlist: View: Get Complete LAND Trend Analysis ➞ | |
 | NFBK Northfield Bancorp, Inc. (Staten Island, NY) |
| Sector: Financials | |
| SubSector: Regional - Northeast Banks | |
| MarketCap: 540.699 Millions | |
| Recent Price: 8.57 Smart Investing & Trading Score: 57 | |
| Day Percent Change: 2.76% Day Change: 0.23 | |
| Week Change: 0.59% Year-to-date Change: -31.9% | |
| NFBK Links: Profile News Message Board | |
| Charts:- Daily , Weekly | |
| Add NFBK to Watchlist: View: Get Complete NFBK Trend Analysis ➞ | |
 | ARR ARMOUR Residential REIT, Inc. |
| Sector: Financials | |
| SubSector: Mortgage Investment | |
| MarketCap: 578.739 Millions | |
| Recent Price: 18.63 Smart Investing & Trading Score: 57 | |
| Day Percent Change: 2.53% Day Change: 0.46 | |
| Week Change: 0.59% Year-to-date Change: -3.6% | |
| ARR Links: Profile News Message Board | |
| Charts:- Daily , Weekly | |
| Add ARR to Watchlist: View: Get Complete ARR Trend Analysis ➞ | |
 | PIPR Piper Sandler Companies |
| Sector: Financials | |
| SubSector: Asset Management | |
| MarketCap: 759.603 Millions | |
| Recent Price: 198.31 Smart Investing & Trading Score: 81 | |
| Day Percent Change: 1.29% Day Change: 2.52 | |
| Week Change: 0.58% Year-to-date Change: 13.4% | |
| PIPR Links: Profile News Message Board | |
| Charts:- Daily , Weekly | |
| Add PIPR to Watchlist: View: Get Complete PIPR Trend Analysis ➞ | |
 | SBCF Seacoast Banking Corporation of Florida |
| Sector: Financials | |
| SubSector: Regional - Mid-Atlantic Banks | |
| MarketCap: 881.559 Millions | |
| Recent Price: 23.51 Smart Investing & Trading Score: 62 | |
| Day Percent Change: 1.91% Day Change: 0.44 | |
| Week Change: 0.56% Year-to-date Change: -17.4% | |
| SBCF Links: Profile News Message Board | |
| Charts:- Daily , Weekly | |
| Add SBCF to Watchlist: View: Get Complete SBCF Trend Analysis ➞ | |
 | MLP Maui Land & Pineapple Company, Inc. |
| Sector: Financials | |
| SubSector: Real Estate Development | |
| MarketCap: 186.619 Millions | |
| Recent Price: 19.92 Smart Investing & Trading Score: 73 | |
| Day Percent Change: 2.26% Day Change: 0.44 | |
| Week Change: 0.56% Year-to-date Change: 25.4% | |
| MLP Links: Profile News Message Board | |
| Charts:- Daily , Weekly | |
| Add MLP to Watchlist: View: Get Complete MLP Trend Analysis ➞ | |
 | MFA MFA Financial, Inc. |
| Sector: Financials | |
| SubSector: Mortgage Investment | |
| MarketCap: 1869.69 Millions | |
| Recent Price: 10.79 Smart Investing & Trading Score: 49 | |
| Day Percent Change: 1.89% Day Change: 0.20 | |
| Week Change: 0.56% Year-to-date Change: -4.3% | |
| MFA Links: Profile News Message Board | |
| Charts:- Daily , Weekly | |
| Add MFA to Watchlist: View: Get Complete MFA Trend Analysis ➞ | |
 | FRPH FRP Holdings, Inc. |
| Sector: Financials | |
| SubSector: Property Management | |
| MarketCap: 374.442 Millions | |
| Recent Price: 30.60 Smart Investing & Trading Score: 25 | |
| Day Percent Change: 0.96% Day Change: 0.29 | |
| Week Change: 0.56% Year-to-date Change: -51.3% | |
| FRPH Links: Profile News Message Board | |
| Charts:- Daily , Weekly | |
| Add FRPH to Watchlist: View: Get Complete FRPH Trend Analysis ➞ | |
 | GDOT Green Dot Corporation |
| Sector: Financials | |
| SubSector: Credit Services | |
| MarketCap: 1320.08 Millions | |
| Recent Price: 9.09 Smart Investing & Trading Score: 88 | |
| Day Percent Change: 3.89% Day Change: 0.34 | |
| Week Change: 0.55% Year-to-date Change: -8.2% | |
| GDOT Links: Profile News Message Board | |
| Charts:- Daily , Weekly | |
| Add GDOT to Watchlist: View: Get Complete GDOT Trend Analysis ➞ | |
 | BSRR Sierra Bancorp |
| Sector: Financials | |
| SubSector: Regional - Pacific Banks | |
| MarketCap: 256.929 Millions | |
| Recent Price: 20.61 Smart Investing & Trading Score: 88 | |
| Day Percent Change: 3.99% Day Change: 0.79 | |
| Week Change: 0.54% Year-to-date Change: -8.6% | |
| BSRR Links: Profile News Message Board | |
| Charts:- Daily , Weekly | |
| Add BSRR to Watchlist: View: Get Complete BSRR Trend Analysis ➞ | |
 | ESRT Empire State Realty Trust, Inc. |
| Sector: Financials | |
| SubSector: REIT - Diversified | |
| MarketCap: 1632.13 Millions | |
| Recent Price: 9.26 Smart Investing & Trading Score: 35 | |
| Day Percent Change: 1.76% Day Change: 0.16 | |
| Week Change: 0.54% Year-to-date Change: -4.4% | |
| ESRT Links: Profile News Message Board | |
| Charts:- Daily , Weekly | |
| Add ESRT to Watchlist: View: Get Complete ESRT Trend Analysis ➞ | |
 | EQBK Equity Bancshares, Inc. |
| Sector: Financials | |
| SubSector: Regional - Midwest Banks | |
| MarketCap: 272.87 Millions | |
| Recent Price: 33.49 Smart Investing & Trading Score: 83 | |
| Day Percent Change: 0.54% Day Change: 0.18 | |
| Week Change: 0.54% Year-to-date Change: -1.2% | |
| EQBK Links: Profile News Message Board | |
| Charts:- Daily , Weekly | |
| Add EQBK to Watchlist: View: Get Complete EQBK Trend Analysis ➞ | |
 | FFBC First Financial Bancorp. |
| Sector: Financials | |
| SubSector: Regional - Midwest Banks | |
| MarketCap: 1363.7 Millions | |
| Recent Price: 22.69 Smart Investing & Trading Score: 93 | |
| Day Percent Change: 2.62% Day Change: 0.58 | |
| Week Change: 0.53% Year-to-date Change: -4.5% | |
| FFBC Links: Profile News Message Board | |
| Charts:- Daily , Weekly | |
| Add FFBC to Watchlist: View: Get Complete FFBC Trend Analysis ➞ | |
 | DEI Douglas Emmett, Inc. |
| Sector: Financials | |
| SubSector: REIT - Diversified | |
| MarketCap: 4917.83 Millions | |
| Recent Price: 13.44 Smart Investing & Trading Score: 71 | |
| Day Percent Change: -1.97% Day Change: -0.27 | |
| Week Change: 0.52% Year-to-date Change: -7.3% | |
| DEI Links: Profile News Message Board | |
| Charts:- Daily , Weekly | |
| Add DEI to Watchlist: View: Get Complete DEI Trend Analysis ➞ | |
 | UNIT Uniti Group Inc. |
| Sector: Financials | |
| SubSector: REIT - Industrial | |
| MarketCap: 1363.09 Millions | |
| Recent Price: 5.81 Smart Investing & Trading Score: 62 | |
| Day Percent Change: 1.04% Day Change: 0.06 | |
| Week Change: 0.52% Year-to-date Change: 0.5% | |
| UNIT Links: Profile News Message Board | |
| Charts:- Daily , Weekly | |
| Add UNIT to Watchlist: View: Get Complete UNIT Trend Analysis ➞ | |
 | PSTL Postal Realty Trust, Inc. |
| Sector: Financials | |
| SubSector: REIT - Office | |
| MarketCap: 82.9866 Millions | |
| Recent Price: 13.80 Smart Investing & Trading Score: 40 | |
| Day Percent Change: -0.36% Day Change: -0.05 | |
| Week Change: 0.51% Year-to-date Change: -5.2% | |
| PSTL Links: Profile News Message Board | |
| Charts:- Daily , Weekly | |
| Add PSTL to Watchlist: View: Get Complete PSTL Trend Analysis ➞ | |
 | FCPT Four Corners Property Trust, Inc. |
| Sector: Financials | |
| SubSector: REIT - Hotel/Motel | |
| MarketCap: 1218.94 Millions | |
| Recent Price: 23.56 Smart Investing & Trading Score: 57 | |
| Day Percent Change: 0.47% Day Change: 0.11 | |
| Week Change: 0.51% Year-to-date Change: -6.9% | |
| FCPT Links: Profile News Message Board | |
| Charts:- Daily , Weekly | |
| Add FCPT to Watchlist: View: Get Complete FCPT Trend Analysis ➞ | |
 | WABC Westamerica Bancorporation |
| Sector: Financials | |
| SubSector: Regional - Pacific Banks | |
| MarketCap: 1557.69 Millions | |
| Recent Price: 47.67 Smart Investing & Trading Score: 86 | |
| Day Percent Change: 2.41% Day Change: 1.12 | |
| Week Change: 0.48% Year-to-date Change: -15.5% | |
| WABC Links: Profile News Message Board | |
| Charts:- Daily , Weekly | |
| Add WABC to Watchlist: View: Get Complete WABC Trend Analysis ➞ | |
 | BLFY Blue Foundry Bancorp |
| Sector: Financials | |
| SubSector: Banks - Regional | |
| MarketCap: 264 Millions | |
| Recent Price: 8.82 Smart Investing & Trading Score: 67 | |
| Day Percent Change: 3.28% Day Change: 0.28 | |
| Week Change: 0.46% Year-to-date Change: -8.4% | |
| BLFY Links: Profile News Message Board | |
| Charts:- Daily , Weekly | |
| Add BLFY to Watchlist: View: Get Complete BLFY Trend Analysis ➞ | |
 | PDM Piedmont Office Realty Trust, Inc. |
| Sector: Financials | |
| SubSector: REIT - Office | |
| MarketCap: 2097.46 Millions | |
| Recent Price: 6.74 Smart Investing & Trading Score: 76 | |
| Day Percent Change: -2.18% Day Change: -0.15 | |
| Week Change: 0.45% Year-to-date Change: -5.2% | |
| PDM Links: Profile News Message Board | |
| Charts:- Daily , Weekly | |
| Add PDM to Watchlist: View: Get Complete PDM Trend Analysis ➞ | |
 | EFSC Enterprise Financial Services Corp |
| Sector: Financials | |
| SubSector: Regional - Southwest Banks | |
| MarketCap: 770.165 Millions | |
| Recent Price: 38.97 Smart Investing & Trading Score: 60 | |
| Day Percent Change: 2.53% Day Change: 0.96 | |
| Week Change: 0.44% Year-to-date Change: -12.7% | |
| EFSC Links: Profile News Message Board | |
| Charts:- Daily , Weekly | |
| Add EFSC to Watchlist: View: Get Complete EFSC Trend Analysis ➞ | |
 | CATY Cathay General Bancorp |
| Sector: Financials | |
| SubSector: Regional - Pacific Banks | |
| MarketCap: 1781.99 Millions | |
| Recent Price: 35.18 Smart Investing & Trading Score: 49 | |
| Day Percent Change: 2.15% Day Change: 0.74 | |
| Week Change: 0.4% Year-to-date Change: -21.1% | |
| CATY Links: Profile News Message Board | |
| Charts:- Daily , Weekly | |
| Add CATY to Watchlist: View: Get Complete CATY Trend Analysis ➞ | |
 | BUSE First Busey Corporation |
| Sector: Financials | |
| SubSector: Regional - Midwest Banks | |
| MarketCap: 876.97 Millions | |
| Recent Price: 22.89 Smart Investing & Trading Score: 57 | |
| Day Percent Change: 2.46% Day Change: 0.55 | |
| Week Change: 0.39% Year-to-date Change: -7.8% | |
| BUSE Links: Profile News Message Board | |
| Charts:- Daily , Weekly | |
| Add BUSE to Watchlist: View: Get Complete BUSE Trend Analysis ➞ | |
 | AHH Armada Hoffler Properties, Inc. |
| Sector: Financials | |
| SubSector: REIT - Diversified | |
| MarketCap: 550.653 Millions | |
| Recent Price: 10.61 Smart Investing & Trading Score: 83 | |
| Day Percent Change: 0.86% Day Change: 0.09 | |
| Week Change: 0.38% Year-to-date Change: -14.2% | |
| AHH Links: Profile News Message Board | |
| Charts:- Daily , Weekly | |
| Add AHH to Watchlist: View: Get Complete AHH Trend Analysis ➞ | |
| For tabular summary view of above stock list: Summary View ➞ 0 - 25 , 25 - 50 , 50 - 75 , 75 - 100 , 100 - 125 , 125 - 150 , 150 - 175 , 175 - 200 , 200 - 225 , 225 - 250 , 250 - 275 , 275 - 300 , 300 - 325 , 325 - 350 , 350 - 375 , 375 - 400 | ||
| Click To Change The Sort Order: By Market Cap or Company Size Performance: Year-to-date, Week and Day | |
| Select Chart Type: | ||
| Too many stocks? View smallcap stocks filtered by marketcap & sector |
| Marketcap: All SmallCap Stocks (default-no microcap), Large, Mid-Range, Small & MicroCap |
| Sector: Tech, Finance, Energy, Staples, Retail, Industrial, Materials, Utilities & Medical |
|
Best Stocks Today 12Stocks.com |
© 2024 12Stocks.com Terms & Conditions Privacy Contact Us
All Information Provided Only For Education And Not To Be Used For Investing or Trading. See Terms & Conditions


One More Thing ... Get Best Stocks Delivered Daily!
Never Ever Miss A Move With Our Top Ten Stocks Lists
Find Best Stocks In Any Market - Bull or Bear Market
Take A Peek At Our Top Ten Stocks Lists: Daily, Weekly, Year-to-Date & Top Trends
Find Best Stocks In Any Market - Bull or Bear Market
Take A Peek At Our Top Ten Stocks Lists: Daily, Weekly, Year-to-Date & Top Trends
Smallcap Stocks With Best Up Trends [0-bearish to 100-bullish]: Surmodics [100], Rocky Brands[100], TransMedics Group[100], LendingClub [100], Summit [100], A10 s[100], Carpenter [100], UFP [100], PROCEPT BioRobotics[100], Xencor [100], Trinity Industries[100]
Best Smallcap Stocks Year-to-Date:
Janux [441.55%], Viking [310.69%], Longboard [259.25%], Alpine Immune[239.29%], Avidity Biosciences[185.4%], Bakkt [182.96%], Cullinan Oncology[175.33%], Arcutis Bio[173.68%], Vera [173.32%], Super Micro[159.73%], Y-mAbs [141.79%] Best Smallcap Stocks This Week:
Deciphera [73.11%], Eyenovia [45.65%], Cue Biopharma[39.56%], Seres [30.91%], Poseida [30.05%], P3 Health[29.62%], Phibro Animal[28.44%], TransMedics Group[27.72%], Surmodics [27.36%], LendingTree [26.36%], Rocky Brands[24.92%] Best Smallcap Stocks Daily:
Surmodics [29.74%], Rocky Brands[28.41%], TransMedics Group[24.93%], Ventyx Biosciences[24.63%], Eyenovia [21.84%], LendingClub [19.68%], Summit [19.59%], Powell Industries[18.89%], MiMedx Group[18.67%], CareDx [18.30%], A10 s[17.69%]