
 Login Sign Up


| |||||
 |  | ||||

| 12Stocks.com Market Intelligence |
Best SmallCap Stocks
|
| In a hurry? Small Cap Stock Lists: Performance Trends Table, Stock Charts
Sort Small Cap stocks: Daily, Weekly, Year-to-Date, Market Cap & Trends. Filter Small Cap stocks list by sector: Show all, Tech, Finance, Energy, Staples, Retail, Industrial, Materials, Utilities and HealthCare Filter Small Cap stocks list by size: All Large Medium Small and MicroCap |
| 12Stocks.com Small Cap Stocks Performances & Trends Daily | |||||||||
|
|  The overall Smart Investing & Trading Score is 14 (0-bearish to 100-bullish) which puts Small Cap index in short term bearish trend. The Smart Investing & Trading Score from previous trading session is 41 and hence a deterioration of trend.
| ||||||||
Here are the Smart Investing & Trading Scores of the most requested small cap stocks at 12Stocks.com (click stock name for detailed review):
|


| 12Stocks.com: Investing in Smallcap Index with Stocks | |
|
The following table helps investors and traders sort through current performance and trends (as measured by Smart Investing & Trading Score) of various
stocks in the Smallcap Index. Quick View: Move mouse or cursor over stock symbol (ticker) to view short-term technical chart and over stock name to view long term chart. Click on  to add stock symbol to your watchlist and to add stock symbol to your watchlist and  to view watchlist. Click on any ticker or stock name for detailed market intelligence report for that stock. to view watchlist. Click on any ticker or stock name for detailed market intelligence report for that stock. |
12Stocks.com Performance of Stocks in Smallcap Index
| Ticker | Stock Name | Watchlist | Category | Recent Price | Smart Investing & Trading Score | Change % | Weekly Change% |
| LBAI | Lakeland Bancorp |   | Financials | 12.46 | 76 | 2.21% | -0.48% |
| FOR | Forestar Group | | Financials | 31.18 | 25 | 0.61% | -0.48% |
| WD | Walker & Dunlop | | Financials | 92.76 | 57 | 1.23% | -0.48% |
| DX | Dynex Capital | | Financials | 11.86 | 49 | 1.63% | -0.50% |
| OPI | Office Properties | | Financials | 2.00 | 27 | -0.99% | -0.50% |
| PKST | Peakstone Realty | | Financials | 13.81 | 48 | -1.15% | -0.50% |
| FCF | First Commonwealth | | Financials | 13.48 | 88 | 2.20% | -0.52% |
| HPP | Hudson Pacific | | Financials | 5.69 | 23 | -1.90% | -0.52% |
| RDN | Radian Group | | Financials | 30.18 | 65 | 1.04% | -0.56% |
| PJT | PJT Partners | | Financials | 93.54 | 32 | -1.01% | -0.58% |
| CVLY | Codorus Valley | | Financials | 22.34 | 40 | 0.63% | -0.58% |
| PLMR | Palomar | | Financials | 79.04 | 54 | 0.47% | -0.58% |
| GBCI | Glacier Bancorp | | Financials | 36.90 | 62 | 1.99% | -0.59% |
| AGM | Federal Agricultural | | Financials | 189.88 | 83 | 2.01% | -0.60% |
| ORRF | Orrstown Financial | | Financials | 26.32 | 47 | 0.48% | -0.60% |
| NODK | NI | | Financials | 14.88 | 59 | 0.07% | -0.60% |
| AI | C3.ai | | Financials | 22.69 | 57 | 0.71% | -0.61% |
| DCOM | Dime Community | | Financials | 18.96 | 86 | 4.18% | -0.63% |
| IRT | Independence Realty | | Financials | 15.76 | 61 | -0.06% | -0.63% |
| HCI | HCI Group | | Financials | 114.26 | 68 | 0.07% | -0.64% |
| DHIL | Diamond Hill | | Financials | 150.50 | 80 | 0.86% | -0.65% |
| OCN | Ocwen Financial | | Financials | 24.17 | 53 | 3.56% | -0.66% |
| JXN | Jackson Financial | | Financials | 69.10 | 61 | 1.14% | -0.66% |
| SHO | Sunstone Hotel | | Financials | 10.23 | 25 | 0.29% | -0.68% |
| HTH | Hilltop | | Financials | 30.15 | 50 | 3.04% | -0.69% |
| For chart view version of above stock list: Chart View ➞ 0 - 25 , 25 - 50 , 50 - 75 , 75 - 100 , 100 - 125 , 125 - 150 , 150 - 175 , 175 - 200 , 200 - 225 , 225 - 250 , 250 - 275 , 275 - 300 , 300 - 325 , 325 - 350 , 350 - 375 , 375 - 400 | ||
 | Click To Change The Sort Order: By Market Cap or Company Size Performance: Year-to-date, Week and Day |  |
| Too many stocks? View smallcap stocks filtered by marketcap & sector |
| Marketcap: All SmallCap Stocks (default-no microcap), Large, Mid-Range, Small |
| Smallcap Sector: Tech, Finance, Energy, Staples, Retail, Industrial, Materials, & Medical |
|
Get the most comprehensive stock market coverage daily at 12Stocks.com ➞ Best Stocks Today ➞ Best Stocks Weekly ➞ Best Stocks Year-to-Date ➞ Best Stocks Trends ➞  Best Stocks Today 12Stocks.com Best Nasdaq Stocks ➞ Best S&P 500 Stocks ➞ Best Tech Stocks ➞ Best Biotech Stocks ➞ |
| Detailed Overview of SmallCap Stocks |
| SmallCap Technical Overview, Leaders & Laggards, Top SmallCap ETF Funds & Detailed SmallCap Stocks List, Charts, Trends & More |
| Smallcap: Technical Analysis, Trends & YTD Performance | |
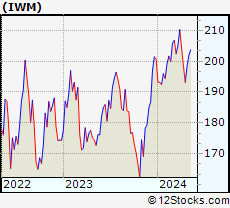
| SmallCap segment as represented by
IWM, an exchange-traded fund [ETF], holds basket of thousands of smallcap stocks from across all major sectors of the US stock market. The smallcap index (contains stocks like Riverbed & Sotheby's) is down by -2.19% and is currently underperforming the overall market by -6.73% year-to-date. Below is a quick view of technical charts and trends: | |
 IWM Weekly Chart |
|
| Long Term Trend: Not Good | |
| Medium Term Trend: Not Good | |
 IWM Daily Chart |
|
| Short Term Trend: Not Good | |
| Overall Trend Score: 14 | |
| YTD Performance: -2.19% | |
| **Trend Scores & Views Are Only For Educational Purposes And Not For Investing | |
| 12Stocks.com: Top Performing Small Cap Index Stocks | ||||||||||||||||||||||||||||||||||||||||||||||||
 The top performing Small Cap Index stocks year to date are
Now, more recently, over last week, the top performing Small Cap Index stocks on the move are


|
||||||||||||||||||||||||||||||||||||||||||||||||
| 12Stocks.com: Investing in Smallcap Index using Exchange Traded Funds | |
|
The following table shows list of key exchange traded funds (ETF) that
help investors track Smallcap index. The following list also includes leveraged ETF funds that track twice or thrice the daily returns of Smallcap indices. Short or inverse ETF funds move in the opposite direction to the index they track and are useful during market pullbacks or during bear markets. Quick View: Move mouse or cursor over ETF symbol (ticker) to view short-term technical chart and over ETF name to view long term chart. Click on ticker or stock name for detailed view. Click on to add stock symbol to your watchlist and to view watchlist. |
12Stocks.com List of ETFs that track Smallcap Index
| Ticker | ETF Name | Watchlist | Recent Price | Smart Investing & Trading Score | Change % | Week % | Year-to-date % |
| IWM | iShares Russell 2000 | | 196.31 | 14 | 0.21 | -1.05 | -2.19% |
| IJR | iShares Core S&P Small-Cap | | 104.74 | 22 | 0.34 | -0.86 | -3.24% |
| VTWO | Vanguard Russell 2000 ETF | | 79.36 | 14 | 0.25 | -1.07 | -2.15% |
| IWN | iShares Russell 2000 Value | | 149.82 | 22 | 0.52 | -0.87 | -3.55% |
| IJS | iShares S&P Small-Cap 600 Value | | 96.40 | 15 | 0.33 | -0.81 | -6.47% |
| IWO | iShares Russell 2000 Growth | | 249.58 | 7 | -0.30 | -1.39 | -1.05% |
| IJT | iShares S&P Small-Cap 600 Growth | | 124.94 | 15 | 0.27 | -0.91 | -0.16% |
| XSLV | PowerShares S&P SmallCap Low Volatil ETF | | 42.83 | 62 | 0.68 | 0.26 | -2.99% |
| SDD | ProShares UltraShort SmallCap600 | | 19.71 | 86 | 0.70 | 1.85 | 6.95% |
| SMLV | SPDR SSGA US Small Cap Low Volatil ETF | | 107.44 | 45 | 1.11 | -0.07 | -4.51% |
| SBB | ProShares Short SmallCap600 | | 16.56 | 79 | 0.05 | 1.06 | 3.94% |
| SAA | ProShares Ultra SmallCap600 | | 22.58 | 8 | -0.08 | -1.99 | -9.49% |
| 12Stocks.com: Charts, Trends, Fundamental Data and Performances of SmallCap Stocks | |
|
We now take in-depth look at all SmallCap stocks including charts, multi-period performances and overall trends (as measured by Smart Investing & Trading Score). One can sort SmallCap stocks (click link to choose) by Daily, Weekly and by Year-to-Date performances. Also, one can sort by size of the company or by market capitalization. |
| Select Your Default Chart Type: | |||||
| |||||
| Click on stock symbol or name for detailed view. Click on to add stock symbol to your watchlist and to view watchlist. Quick View: Move mouse or cursor over "Daily" to quickly view daily technical stock chart and over "Weekly" to view weekly technical stock chart. | |||||

 | LBAI Lakeland Bancorp, Inc. |
| Sector: Financials | |
| SubSector: Regional - Northeast Banks | |
| MarketCap: 534.599 Millions | |
| Recent Price: 12.46 Smart Investing & Trading Score: 76 | |
| Day Percent Change: 2.21% Day Change: 0.27 | |
| Week Change: -0.48% Year-to-date Change: -15.8% | |
| LBAI Links: Profile News Message Board | |
| Charts:- Daily , Weekly | |
| Add LBAI to Watchlist: View: Get Complete LBAI Trend Analysis ➞ | |
 | FOR Forestar Group Inc. |
| Sector: Financials | |
| SubSector: Real Estate Development | |
| MarketCap: 661.019 Millions | |
| Recent Price: 31.18 Smart Investing & Trading Score: 25 | |
| Day Percent Change: 0.61% Day Change: 0.19 | |
| Week Change: -0.48% Year-to-date Change: -5.7% | |
| FOR Links: Profile News Message Board | |
| Charts:- Daily , Weekly | |
| Add FOR to Watchlist: View: Get Complete FOR Trend Analysis ➞ | |
 | WD Walker & Dunlop, Inc. |
| Sector: Financials | |
| SubSector: Mortgage Investment | |
| MarketCap: 1312.99 Millions | |
| Recent Price: 92.76 Smart Investing & Trading Score: 57 | |
| Day Percent Change: 1.23% Day Change: 1.13 | |
| Week Change: -0.48% Year-to-date Change: -16.4% | |
| WD Links: Profile News Message Board | |
| Charts:- Daily , Weekly | |
| Add WD to Watchlist: View: Get Complete WD Trend Analysis ➞ | |
 | DX Dynex Capital, Inc. |
| Sector: Financials | |
| SubSector: Mortgage Investment | |
| MarketCap: 327.839 Millions | |
| Recent Price: 11.86 Smart Investing & Trading Score: 49 | |
| Day Percent Change: 1.63% Day Change: 0.19 | |
| Week Change: -0.5% Year-to-date Change: -5.3% | |
| DX Links: Profile News Message Board | |
| Charts:- Daily , Weekly | |
| Add DX to Watchlist: View: Get Complete DX Trend Analysis ➞ | |
 | OPI Office Properties Income Trust |
| Sector: Financials | |
| SubSector: REIT - Office | |
| MarketCap: 1245.66 Millions | |
| Recent Price: 2.00 Smart Investing & Trading Score: 27 | |
| Day Percent Change: -0.99% Day Change: -0.02 | |
| Week Change: -0.5% Year-to-date Change: -72.7% | |
| OPI Links: Profile News Message Board | |
| Charts:- Daily , Weekly | |
| Add OPI to Watchlist: View: Get Complete OPI Trend Analysis ➞ | |
 | PKST Peakstone Realty Trust |
| Sector: Financials | |
| SubSector: REIT - Diversified | |
| MarketCap: 1050 Millions | |
| Recent Price: 13.81 Smart Investing & Trading Score: 48 | |
| Day Percent Change: -1.15% Day Change: -0.16 | |
| Week Change: -0.5% Year-to-date Change: -32.7% | |
| PKST Links: Profile News Message Board | |
| Charts:- Daily , Weekly | |
| Add PKST to Watchlist: View: Get Complete PKST Trend Analysis ➞ | |
 | FCF First Commonwealth Financial Corporation |
| Sector: Financials | |
| SubSector: Regional - Northeast Banks | |
| MarketCap: 900.299 Millions | |
| Recent Price: 13.48 Smart Investing & Trading Score: 88 | |
| Day Percent Change: 2.20% Day Change: 0.29 | |
| Week Change: -0.52% Year-to-date Change: -12.7% | |
| FCF Links: Profile News Message Board | |
| Charts:- Daily , Weekly | |
| Add FCF to Watchlist: View: Get Complete FCF Trend Analysis ➞ | |
 | HPP Hudson Pacific Properties, Inc. |
| Sector: Financials | |
| SubSector: REIT - Office | |
| MarketCap: 3267.16 Millions | |
| Recent Price: 5.69 Smart Investing & Trading Score: 23 | |
| Day Percent Change: -1.90% Day Change: -0.11 | |
| Week Change: -0.52% Year-to-date Change: -38.9% | |
| HPP Links: Profile News Message Board | |
| Charts:- Daily , Weekly | |
| Add HPP to Watchlist: View: Get Complete HPP Trend Analysis ➞ | |
 | RDN Radian Group Inc. |
| Sector: Financials | |
| SubSector: Property & Casualty Insurance | |
| MarketCap: 2950.12 Millions | |
| Recent Price: 30.18 Smart Investing & Trading Score: 65 | |
| Day Percent Change: 1.04% Day Change: 0.31 | |
| Week Change: -0.56% Year-to-date Change: 5.7% | |
| RDN Links: Profile News Message Board | |
| Charts:- Daily , Weekly | |
| Add RDN to Watchlist: View: Get Complete RDN Trend Analysis ➞ | |
 | PJT PJT Partners Inc. |
| Sector: Financials | |
| SubSector: Asset Management | |
| MarketCap: 1100.93 Millions | |
| Recent Price: 93.54 Smart Investing & Trading Score: 32 | |
| Day Percent Change: -1.01% Day Change: -0.95 | |
| Week Change: -0.58% Year-to-date Change: -8.2% | |
| PJT Links: Profile News Message Board | |
| Charts:- Daily , Weekly | |
| Add PJT to Watchlist: View: Get Complete PJT Trend Analysis ➞ | |
 | CVLY Codorus Valley Bancorp, Inc. |
| Sector: Financials | |
| SubSector: Regional - Northeast Banks | |
| MarketCap: 173.799 Millions | |
| Recent Price: 22.34 Smart Investing & Trading Score: 40 | |
| Day Percent Change: 0.63% Day Change: 0.14 | |
| Week Change: -0.58% Year-to-date Change: -13.1% | |
| CVLY Links: Profile News Message Board | |
| Charts:- Daily , Weekly | |
| Add CVLY to Watchlist: View: Get Complete CVLY Trend Analysis ➞ | |
 | PLMR Palomar Holdings, Inc. |
| Sector: Financials | |
| SubSector: Property & Casualty Insurance | |
| MarketCap: 1297.42 Millions | |
| Recent Price: 79.04 Smart Investing & Trading Score: 54 | |
| Day Percent Change: 0.47% Day Change: 0.37 | |
| Week Change: -0.58% Year-to-date Change: 42.4% | |
| PLMR Links: Profile News Message Board | |
| Charts:- Daily , Weekly | |
| Add PLMR to Watchlist: View: Get Complete PLMR Trend Analysis ➞ | |
 | GBCI Glacier Bancorp, Inc. |
| Sector: Financials | |
| SubSector: Regional - Pacific Banks | |
| MarketCap: 3142.89 Millions | |
| Recent Price: 36.90 Smart Investing & Trading Score: 62 | |
| Day Percent Change: 1.99% Day Change: 0.72 | |
| Week Change: -0.59% Year-to-date Change: -10.7% | |
| GBCI Links: Profile News Message Board | |
| Charts:- Daily , Weekly | |
| Add GBCI to Watchlist: View: Get Complete GBCI Trend Analysis ➞ | |
 | AGM Federal Agricultural Mortgage Corporation |
| Sector: Financials | |
| SubSector: Credit Services | |
| MarketCap: 542.008 Millions | |
| Recent Price: 189.88 Smart Investing & Trading Score: 83 | |
| Day Percent Change: 2.01% Day Change: 3.75 | |
| Week Change: -0.6% Year-to-date Change: -0.7% | |
| AGM Links: Profile News Message Board | |
| Charts:- Daily , Weekly | |
| Add AGM to Watchlist: View: Get Complete AGM Trend Analysis ➞ | |
 | ORRF Orrstown Financial Services, Inc. |
| Sector: Financials | |
| SubSector: Regional - Northeast Banks | |
| MarketCap: 159.999 Millions | |
| Recent Price: 26.32 Smart Investing & Trading Score: 47 | |
| Day Percent Change: 0.48% Day Change: 0.13 | |
| Week Change: -0.6% Year-to-date Change: -10.8% | |
| ORRF Links: Profile News Message Board | |
| Charts:- Daily , Weekly | |
| Add ORRF to Watchlist: View: Get Complete ORRF Trend Analysis ➞ | |
 | NODK NI Holdings, Inc. |
| Sector: Financials | |
| SubSector: Property & Casualty Insurance | |
| MarketCap: 238.112 Millions | |
| Recent Price: 14.88 Smart Investing & Trading Score: 59 | |
| Day Percent Change: 0.07% Day Change: 0.01 | |
| Week Change: -0.6% Year-to-date Change: 14.6% | |
| NODK Links: Profile News Message Board | |
| Charts:- Daily , Weekly | |
| Add NODK to Watchlist: View: Get Complete NODK Trend Analysis ➞ | |
 | AI C3.ai, Inc. |
| Sector: Financials | |
| SubSector: REIT Mortgage | |
| MarketCap: 12467 Millions | |
| Recent Price: 22.69 Smart Investing & Trading Score: 57 | |
| Day Percent Change: 0.71% Day Change: 0.16 | |
| Week Change: -0.61% Year-to-date Change: -21.0% | |
| AI Links: Profile News Message Board | |
| Charts:- Daily , Weekly | |
| Add AI to Watchlist: View: Get Complete AI Trend Analysis ➞ | |
 | DCOM Dime Community Bancshares, Inc. |
| Sector: Financials | |
| SubSector: Savings & Loans | |
| MarketCap: 477.83 Millions | |
| Recent Price: 18.96 Smart Investing & Trading Score: 86 | |
| Day Percent Change: 4.18% Day Change: 0.76 | |
| Week Change: -0.63% Year-to-date Change: -29.6% | |
| DCOM Links: Profile News Message Board | |
| Charts:- Daily , Weekly | |
| Add DCOM to Watchlist: View: Get Complete DCOM Trend Analysis ➞ | |
 | IRT Independence Realty Trust, Inc. |
| Sector: Financials | |
| SubSector: REIT - Residential | |
| MarketCap: 980.161 Millions | |
| Recent Price: 15.76 Smart Investing & Trading Score: 61 | |
| Day Percent Change: -0.06% Day Change: -0.01 | |
| Week Change: -0.63% Year-to-date Change: 3.0% | |
| IRT Links: Profile News Message Board | |
| Charts:- Daily , Weekly | |
| Add IRT to Watchlist: View: Get Complete IRT Trend Analysis ➞ | |
 | HCI HCI Group, Inc. |
| Sector: Financials | |
| SubSector: Property & Casualty Insurance | |
| MarketCap: 297.412 Millions | |
| Recent Price: 114.26 Smart Investing & Trading Score: 68 | |
| Day Percent Change: 0.07% Day Change: 0.08 | |
| Week Change: -0.64% Year-to-date Change: 30.7% | |
| HCI Links: Profile News Message Board | |
| Charts:- Daily , Weekly | |
| Add HCI to Watchlist: View: Get Complete HCI Trend Analysis ➞ | |
 | DHIL Diamond Hill Investment Group, Inc. |
| Sector: Financials | |
| SubSector: Asset Management | |
| MarketCap: 316.203 Millions | |
| Recent Price: 150.50 Smart Investing & Trading Score: 80 | |
| Day Percent Change: 0.86% Day Change: 1.28 | |
| Week Change: -0.65% Year-to-date Change: -9.1% | |
| DHIL Links: Profile News Message Board | |
| Charts:- Daily , Weekly | |
| Add DHIL to Watchlist: View: Get Complete DHIL Trend Analysis ➞ | |
 | OCN Ocwen Financial Corporation |
| Sector: Financials | |
| SubSector: Mortgage Investment | |
| MarketCap: 73.7739 Millions | |
| Recent Price: 24.17 Smart Investing & Trading Score: 53 | |
| Day Percent Change: 3.56% Day Change: 0.83 | |
| Week Change: -0.66% Year-to-date Change: -21.4% | |
| OCN Links: Profile News Message Board | |
| Charts:- Daily , Weekly | |
| Add OCN to Watchlist: View: Get Complete OCN Trend Analysis ➞ | |
 | JXN Jackson Financial Inc. |
| Sector: Financials | |
| SubSector: Insurance - Life | |
| MarketCap: 2460 Millions | |
| Recent Price: 69.10 Smart Investing & Trading Score: 61 | |
| Day Percent Change: 1.14% Day Change: 0.78 | |
| Week Change: -0.66% Year-to-date Change: 34.4% | |
| JXN Links: Profile News Message Board | |
| Charts:- Daily , Weekly | |
| Add JXN to Watchlist: View: Get Complete JXN Trend Analysis ➞ | |
 | SHO Sunstone Hotel Investors, Inc. |
| Sector: Financials | |
| SubSector: REIT - Hotel/Motel | |
| MarketCap: 1861.04 Millions | |
| Recent Price: 10.23 Smart Investing & Trading Score: 25 | |
| Day Percent Change: 0.29% Day Change: 0.03 | |
| Week Change: -0.68% Year-to-date Change: -4.7% | |
| SHO Links: Profile News Message Board | |
| Charts:- Daily , Weekly | |
| Add SHO to Watchlist: View: Get Complete SHO Trend Analysis ➞ | |
 | HTH Hilltop Holdings Inc. |
| Sector: Financials | |
| SubSector: Mortgage Investment | |
| MarketCap: 1317.89 Millions | |
| Recent Price: 30.15 Smart Investing & Trading Score: 50 | |
| Day Percent Change: 3.04% Day Change: 0.89 | |
| Week Change: -0.69% Year-to-date Change: -14.4% | |
| HTH Links: Profile News Message Board | |
| Charts:- Daily , Weekly | |
| Add HTH to Watchlist: View: Get Complete HTH Trend Analysis ➞ | |
| For tabular summary view of above stock list: Summary View ➞ 0 - 25 , 25 - 50 , 50 - 75 , 75 - 100 , 100 - 125 , 125 - 150 , 150 - 175 , 175 - 200 , 200 - 225 , 225 - 250 , 250 - 275 , 275 - 300 , 300 - 325 , 325 - 350 , 350 - 375 , 375 - 400 | ||
| Click To Change The Sort Order: By Market Cap or Company Size Performance: Year-to-date, Week and Day | |
| Select Chart Type: | ||
| Too many stocks? View smallcap stocks filtered by marketcap & sector |
| Marketcap: All SmallCap Stocks (default-no microcap), Large, Mid-Range, Small & MicroCap |
| Sector: Tech, Finance, Energy, Staples, Retail, Industrial, Materials, Utilities & Medical |
|
Best Stocks Today 12Stocks.com |
© 2024 12Stocks.com Terms & Conditions Privacy Contact Us
All Information Provided Only For Education And Not To Be Used For Investing or Trading. See Terms & Conditions


One More Thing ... Get Best Stocks Delivered Daily!
Never Ever Miss A Move With Our Top Ten Stocks Lists
Find Best Stocks In Any Market - Bull or Bear Market
Take A Peek At Our Top Ten Stocks Lists: Daily, Weekly, Year-to-Date & Top Trends
Find Best Stocks In Any Market - Bull or Bear Market
Take A Peek At Our Top Ten Stocks Lists: Daily, Weekly, Year-to-Date & Top Trends
Smallcap Stocks With Best Up Trends [0-bearish to 100-bullish]: Surmodics [100], Rocky Brands[100], TransMedics Group[100], LendingClub [100], Summit [100], A10 s[100], Carpenter [100], UFP [100], PROCEPT BioRobotics[100], Xencor [100], Trinity Industries[100]
Best Smallcap Stocks Year-to-Date:
Janux [441.55%], Viking [310.69%], Longboard [259.25%], Alpine Immune[239.29%], Avidity Biosciences[185.4%], Bakkt [182.96%], Cullinan Oncology[175.33%], Arcutis Bio[173.68%], Vera [173.32%], Super Micro[159.73%], Y-mAbs [141.79%] Best Smallcap Stocks This Week:
Deciphera [73.11%], Eyenovia [45.65%], Cue Biopharma[39.56%], Seres [30.91%], Poseida [30.05%], P3 Health[29.62%], Phibro Animal[28.44%], TransMedics Group[27.72%], Surmodics [27.36%], LendingTree [26.36%], Rocky Brands[24.92%] Best Smallcap Stocks Daily:
Surmodics [29.74%], Rocky Brands[28.41%], TransMedics Group[24.93%], Ventyx Biosciences[24.63%], Eyenovia [21.84%], LendingClub [19.68%], Summit [19.59%], Powell Industries[18.89%], MiMedx Group[18.67%], CareDx [18.30%], A10 s[17.69%]