
 Login Sign Up


| |||||
 |  | ||||

| 12Stocks.com Market Intelligence |
Best S&P 500 Stocks
|
On this page, you will find the most comprehensive analysis of S&P 500 stocks and ETFs - from latest trends to performances to charts ➞. First, here are the year-to-date (YTD) performances of the most requested S&P 500 stocks at 12Stocks.com (click stock for review):
| Intel Corp 84% | ||
| Caterpillar Inc 38% | ||
| Goldman Sachs 37% | ||
| NVIDIA Corp 37% | ||
| Johnson & Johnson 31% | ||
| JPMorgan Chase 30% | ||
| Google Inc 30% | ||
| Boeing Co 27% | ||
| Microsoft 24% | ||
| Gilead 22% | ||
| Walmart Inc 13% | ||
| Chevron Corp 7% | ||
| Apple Inc 6% | ||
| McDonald's Corp 4% | ||
| Amazon.com Inc 1% | ||
| Starbucks Corp -5% | ||
| Merck & Co Inc -8% | ||
| Quick: S&P 500 Stocks Lists: Performances & Trends, S&P 500 Stock Charts
Sort S&P 500 stocks: Daily, Weekly, Year-to-Date, Market Cap & Trends. Filter S&P 500 stocks list by sector: Show all, Tech, Finance, Energy, Staples, Retail, Industrial, Materials, Utilities and HealthCare |
| 12Stocks.com S&P 500 Stocks Performances & Trends Daily Report | |||||||||
|
| 
The overall Smart Investing & Trading Score is 90 (0-bearish to 100-bullish) which puts S&P 500 index in short term bullish trend. The Smart Investing & Trading Score from previous trading session is 80 and an improvement of trend continues. | ||||||||
Here are the Smart Investing & Trading Scores of the most requested S&P 500 stocks at 12Stocks.com (click stock name for detailed review):
|


| 12Stocks.com: Top Performing S&P 500 Index Stocks | ||||||||||||||||||||||||||||||||||||||||||||||||
 The top performing S&P 500 Index stocks year to date are
Now, more recently, over last week, the top performing S&P 500 Index stocks on the move are


|
||||||||||||||||||||||||||||||||||||||||||||||||
| 12Stocks.com: Investing in S&P 500 Index with Stocks | |
|
The following table helps investors and traders sort through current performance and trends (as measured by Smart Investing & Trading Score) of various
stocks in the S&P 500 Index. Quick View: Move mouse or cursor over stock symbol (ticker) to view short-term technical chart and over stock name to view long term chart. Click on  to add stock symbol to your watchlist and to add stock symbol to your watchlist and  to view watchlist. Click on any ticker or stock name for detailed market intelligence report for that stock. to view watchlist. Click on any ticker or stock name for detailed market intelligence report for that stock. |
12Stocks.com Performance of Stocks in S&P 500 Index
| Ticker | Stock Name | Watchlist | Category | Recent Price | Smart Investing & Trading Score | Change % | YTD Change% |
| LLY | Lilly(Eli) & Co |   | Health Care | 819.85 | 100 | -0.67% | 5.77% |
| JNJ | Johnson & Johnson | | Health Care | 185.98 | 100 | -0.04% | 31.28% |
| ABBV | Abbvie Inc | | Health Care | 236.56 | 100 | -3.20% | 35.47% |
| UNH | Unitedhealth | | Health Care | 353.72 | 100 | 1.56% | -29.09% |
| ABT | Abbott | | Health Care | 132.99 | 20 | -0.36% | 18.93% |
| MRK | Merck & Co Inc | | Health Care | 89.51 | 100 | -0.69% | -8.05% |
| TMO | Thermo Fisher | | Health Care | 524.96 | 100 | -1.09% | 0.65% |
| ISRG | Intuitive Surgical | | Health Care | 443.01 | 30 | 1.13% | -15.46% |
| BSX | Boston Scientific | | Health Care | 96.22 | 10 | 0.39% | 7.65% |
| AMGN | AMGEN Inc | | Health Care | 297.40 | 100 | -0.37% | 16.65% |
| SYK | Stryker Corp | | Health Care | 366.40 | 10 | 0.62% | 2.60% |
| DHR | Danaher Corp | | Health Care | 210.33 | 100 | -1.20% | -8.19% |
| GILD | Gilead | | Health Care | 110.56 | 0 | -0.53% | 22.04% |
| PFE | Pfizer Inc | | Health Care | 27.08 | 100 | -0.48% | 7.24% |
| MDT | Medtronic | | Health Care | 95.48 | 60 | 0.71% | 20.96% |
| VRTX | Vertex | | Health Care | 408.85 | 80 | 1.15% | 0.76% |
| HCA | HCA Healthcare | | Health Care | 426.69 | 100 | 0.15% | 43.91% |
| BMY | Bristol-Myers | | Health Care | 45.73 | 80 | -3.58% | -16.62% |
| CVS | CVS Health | | Health Care | 77.45 | 100 | 0.75% | 81.16% |
| MCK | Mckesson | | Health Care | 758.70 | 50 | -0.83% | 34.28% |
| CI | Cigna | | Health Care | 296.98 | 80 | 1.83% | 9.25% |
| ELV | Elevance Health | | Health Care | 339.95 | 30 | 2.19% | -13.73% |
| ZTS | Zoetis Inc | | Health Care | 146.49 | 80 | -0.31% | -9.03% |
| REGN | Regeneron | | Health Care | 600.00 | 100 | 0.01% | -15.87% |
| COR | Cencora Inc | | Health Care | 308.57 | 60 | -1.03% | 37.88% |
| For chart view version of above stock list: Chart View ➞ 0 - 25 , 25 - 50 , 50 - 75 | ||
 | Click To Change The Sort Order: By Market Cap or Company Size Performance: Year-to-date, Week and Day |  |
|
Get the most comprehensive stock market coverage daily at 12Stocks.com ➞ Best Stocks Today ➞ Best Stocks Weekly ➞ Best Stocks Year-to-Date ➞ Best Stocks Trends ➞  Best Stocks Today 12Stocks.com Best Nasdaq Stocks ➞ Best S&P 500 Stocks ➞ Best Tech Stocks ➞ Best Biotech Stocks ➞ |
| Detailed Overview of S&P 500 Stocks |
| S&P 500 Technical Overview, Leaders & Laggards, Top S&P 500 ETF Funds & Detailed S&P 500 Stocks List, Charts, Trends & More |
| S&P 500: Technical Analysis, Trends & YTD Performance | |
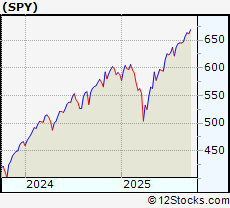
| S&P 500 index as represented by
SPY, an exchange-traded fund [ETF], holds basket of five hundred (mostly largecap) stocks from across all major sectors of the US stock market. The S&P 500 index (contains stocks like Apple and Exxon) is up by 15.1527% and is currently outperforming the overall market by 0.3948% year-to-date. Below is a quick view of technical charts and trends: | |
 SPY Weekly Chart |
|
| Long Term Trend: Very Good | |
| Medium Term Trend: Good | |
 SPY Daily Chart |
|
| Short Term Trend: Very Good | |
| Overall Trend Score: 90 | |
| YTD Performance: 15.1527% | |
| **Trend Scores & Views Are Only For Educational Purposes And Not For Investing | |
| 12Stocks.com: Investing in S&P 500 Index using Exchange Traded Funds | |
|
The following table shows list of key exchange traded funds (ETF) that
help investors track S&P 500 index. The following list also includes leveraged ETF funds that track twice or thrice the daily returns of S&P 500 indices. Short or inverse ETF funds move in the opposite direction to the index they track and are useful during market pullbacks or during bear markets. Quick View: Move mouse or cursor over ETF symbol (ticker) to view short-term technical chart and over ETF name to view long term chart. Click on ticker or stock name for detailed view. Click on to add stock symbol to your watchlist and to view watchlist. |
12Stocks.com List of ETFs that track S&P 500 Index
| Ticker | ETF Name | Watchlist | Recent Price | Smart Investing & Trading Score | Change % | Week % | Year-to-date % |
| SPY | SPDR S&P 500 ETF Trust | | 669.22 | 90 | 0.115192 | 1.22826 | 15.1527% |
| IVV | iShares Core S&P 500 ETF | | 672.50 | 90 | 0.0982377 | 1.24048 | 15.1922% |
| VOO | Vanguard S&P 500 ETF | | 615.25 | 90 | 0.107389 | 0.943396 | 15.2251% |
| OEF | iShares S&P 100 ETF | | 334.28 | 90 | 0.00598337 | 1.05505 | 16.5396% |
| SSO | ProShares Ultra S&P500 2x Shares | | 113.12 | 90 | 0.177117 | 2.334 | 23.4297% |
| UPRO | ProShares UltraPro S&P 500 ETF 3x Shares | | 113.01 | 90 | 0.275067 | 3.45112 | 29.2069% |
| SPXL | Direxion Daily S&P 500 Bull 3X Shares | | 214.76 | 90 | 0.28953 | 3.47386 | 29.2396% |
| SH | ProShares Short S&P500 -1x Shares | | 36.80 | 10 | -0.0543183 | -1.07527 | -11.8852% |
| SDS | ProShares UltraShort S&P500 -2x Shares | | 14.33 | 10 | -0.139373 | -2.1843 | -25.9516% |
| SPXU | ProShares UltraPro Short S&P 500 | | 13.34 | 10 | -0.224383 | -3.26323 | -40.0301% |
| SPXS | Direxion Daily S&P 500 Bear -3X Shares | | 37.50 | 70 | -0.239425 | 868.992 | 503.962% |
| 12Stocks.com: Charts, Trends, Fundamental Data and Performances of S&P 500 Stocks | |
|
We now take in-depth look at all S&P 500 stocks including charts, multi-period performances and overall trends (as measured by Smart Investing & Trading Score). One can sort S&P 500 stocks (click link to choose) by Daily, Weekly and by Year-to-Date performances. Also, one can sort by size of the company or by market capitalization. |
| Select Your Default Chart Type: | |||||
| |||||
| Click on stock symbol or name for detailed view. Click on to add stock symbol to your watchlist and to view watchlist. Quick View: Move mouse or cursor over "Daily" to quickly view daily technical stock chart and over "Weekly" to view weekly technical stock chart. | |||||

 | LLY Lilly(Eli) & Co |
| Sector: Health Care | |
| SubSector: Drug Manufacturers - General | |
| MarketCap: 688273 Millions | |
| Recent Price: 819.85 Smart Investing & Trading Score: 100 | |
| Day Percent Change: -0.674808% Day Change: -5.2 | |
| Week Change: 10.5143% Year-to-date Change: 5.8% | |
| LLY Links: Profile News Message Board | |
| Charts:- Daily , Weekly | |
| Add LLY to Watchlist: View: Get LLY Trend Analysis ➞ | |
 | JNJ Johnson & Johnson |
| Sector: Health Care | |
| SubSector: Drug Manufacturers - General | |
| MarketCap: 429720 Millions | |
| Recent Price: 185.98 Smart Investing & Trading Score: 100 | |
| Day Percent Change: -0.0376243% Day Change: -0.07 | |
| Week Change: 5.2578% Year-to-date Change: 31.3% | |
| JNJ Links: Profile News Message Board | |
| Charts:- Daily , Weekly | |
| Add JNJ to Watchlist: View: Get JNJ Trend Analysis ➞ | |
 | ABBV Abbvie Inc |
| Sector: Health Care | |
| SubSector: Drug Manufacturers - General | |
| MarketCap: 375500 Millions | |
| Recent Price: 236.56 Smart Investing & Trading Score: 100 | |
| Day Percent Change: -3.19993% Day Change: -6.41 | |
| Week Change: 7.53216% Year-to-date Change: 35.5% | |
| ABBV Links: Profile News Message Board | |
| Charts:- Daily , Weekly | |
| Add ABBV to Watchlist: View: Get ABBV Trend Analysis ➞ | |
 | UNH Unitedhealth Group Inc |
| Sector: Health Care | |
| SubSector: Healthcare Plans | |
| MarketCap: 285640 Millions | |
| Recent Price: 353.72 Smart Investing & Trading Score: 100 | |
| Day Percent Change: 1.55613% Day Change: 5.44 | |
| Week Change: 0.542907% Year-to-date Change: -29.1% | |
| UNH Links: Profile News Message Board | |
| Charts:- Daily , Weekly | |
| Add UNH to Watchlist: View: Get UNH Trend Analysis ➞ | |
 | ABT Abbott Laboratories |
| Sector: Health Care | |
| SubSector: Medical Devices | |
| MarketCap: 231377 Millions | |
| Recent Price: 132.99 Smart Investing & Trading Score: 20 | |
| Day Percent Change: -0.359631% Day Change: -0.27 | |
| Week Change: -0.672194% Year-to-date Change: 18.9% | |
| ABT Links: Profile News Message Board | |
| Charts:- Daily , Weekly | |
| Add ABT to Watchlist: View: Get ABT Trend Analysis ➞ | |
 | MRK Merck & Co Inc |
| Sector: Health Care | |
| SubSector: Drug Manufacturers - General | |
| MarketCap: 211587 Millions | |
| Recent Price: 89.51 Smart Investing & Trading Score: 100 | |
| Day Percent Change: -0.687895% Day Change: -1.1 | |
| Week Change: 12.3509% Year-to-date Change: -8.0% | |
| MRK Links: Profile News Message Board | |
| Charts:- Daily , Weekly | |
| Add MRK to Watchlist: View: Get MRK Trend Analysis ➞ | |
 | TMO Thermo Fisher Scientific Inc |
| Sector: Health Care | |
| SubSector: Diagnostics & Research | |
| MarketCap: 186012 Millions | |
| Recent Price: 524.96 Smart Investing & Trading Score: 100 | |
| Day Percent Change: -1.08718% Day Change: -2.56 | |
| Week Change: 12.1709% Year-to-date Change: 0.6% | |
| TMO Links: Profile News Message Board | |
| Charts:- Daily , Weekly | |
| Add TMO to Watchlist: View: Get TMO Trend Analysis ➞ | |
 | ISRG Intuitive Surgical Inc |
| Sector: Health Care | |
| SubSector: Medical Instruments & Supplies | |
| MarketCap: 167358 Millions | |
| Recent Price: 443.01 Smart Investing & Trading Score: 30 | |
| Day Percent Change: 1.1346% Day Change: 5.1 | |
| Week Change: -0.220726% Year-to-date Change: -15.5% | |
| ISRG Links: Profile News Message Board | |
| Charts:- Daily , Weekly | |
| Add ISRG to Watchlist: View: Get ISRG Trend Analysis ➞ | |
 | BSX Boston Scientific Corp |
| Sector: Health Care | |
| SubSector: Medical Devices | |
| MarketCap: 158873 Millions | |
| Recent Price: 96.22 Smart Investing & Trading Score: 10 | |
| Day Percent Change: 0.38602% Day Change: 0.93 | |
| Week Change: -1.8764% Year-to-date Change: 7.7% | |
| BSX Links: Profile News Message Board | |
| Charts:- Daily , Weekly | |
| Add BSX to Watchlist: View: Get BSX Trend Analysis ➞ | |
 | AMGN AMGEN Inc |
| Sector: Health Care | |
| SubSector: Drug Manufacturers - General | |
| MarketCap: 152701 Millions | |
| Recent Price: 297.40 Smart Investing & Trading Score: 100 | |
| Day Percent Change: -0.368509% Day Change: -2.21 | |
| Week Change: 6.51099% Year-to-date Change: 16.7% | |
| AMGN Links: Profile News Message Board | |
| Charts:- Daily , Weekly | |
| Add AMGN to Watchlist: View: Get AMGN Trend Analysis ➞ | |
 | SYK Stryker Corp |
| Sector: Health Care | |
| SubSector: Medical Devices | |
| MarketCap: 149983 Millions | |
| Recent Price: 366.40 Smart Investing & Trading Score: 10 | |
| Day Percent Change: 0.617877% Day Change: 1.65 | |
| Week Change: -1.29842% Year-to-date Change: 2.6% | |
| SYK Links: Profile News Message Board | |
| Charts:- Daily , Weekly | |
| Add SYK to Watchlist: View: Get SYK Trend Analysis ➞ | |
 | DHR Danaher Corp |
| Sector: Health Care | |
| SubSector: Diagnostics & Research | |
| MarketCap: 143361 Millions | |
| Recent Price: 210.33 Smart Investing & Trading Score: 100 | |
| Day Percent Change: -1.19786% Day Change: -1.46 | |
| Week Change: 13.1354% Year-to-date Change: -8.2% | |
| DHR Links: Profile News Message Board | |
| Charts:- Daily , Weekly | |
| Add DHR to Watchlist: View: Get DHR Trend Analysis ➞ | |
 | GILD Gilead Sciences, Inc |
| Sector: Health Care | |
| SubSector: Drug Manufacturers - General | |
| MarketCap: 142755 Millions | |
| Recent Price: 110.56 Smart Investing & Trading Score: 0 | |
| Day Percent Change: -0.530814% Day Change: -1.07 | |
| Week Change: -2.73599% Year-to-date Change: 22.0% | |
| GILD Links: Profile News Message Board | |
| Charts:- Daily , Weekly | |
| Add GILD to Watchlist: View: Get GILD Trend Analysis ➞ | |
 | PFE Pfizer Inc |
| Sector: Health Care | |
| SubSector: Drug Manufacturers - General | |
| MarketCap: 141456 Millions | |
| Recent Price: 27.08 Smart Investing & Trading Score: 100 | |
| Day Percent Change: -0.477766% Day Change: -0.18 | |
| Week Change: 12.4118% Year-to-date Change: 7.2% | |
| PFE Links: Profile News Message Board | |
| Charts:- Daily , Weekly | |
| Add PFE to Watchlist: View: Get PFE Trend Analysis ➞ | |
 | MDT Medtronic Plc |
| Sector: Health Care | |
| SubSector: Medical Devices | |
| MarketCap: 119162 Millions | |
| Recent Price: 95.48 Smart Investing & Trading Score: 60 | |
| Day Percent Change: 0.706676% Day Change: 0.75 | |
| Week Change: -0.271569% Year-to-date Change: 21.0% | |
| MDT Links: Profile News Message Board | |
| Charts:- Daily , Weekly | |
| Add MDT to Watchlist: View: Get MDT Trend Analysis ➞ | |
 | VRTX Vertex Pharmaceuticals, Inc |
| Sector: Health Care | |
| SubSector: Biotechnology | |
| MarketCap: 101561 Millions | |
| Recent Price: 408.85 Smart Investing & Trading Score: 80 | |
| Day Percent Change: 1.14792% Day Change: 3.2 | |
| Week Change: 8.5577% Year-to-date Change: 0.8% | |
| VRTX Links: Profile News Message Board | |
| Charts:- Daily , Weekly | |
| Add VRTX to Watchlist: View: Get VRTX Trend Analysis ➞ | |
 | HCA HCA Healthcare Inc |
| Sector: Health Care | |
| SubSector: Medical Care Facilities | |
| MarketCap: 98457.4 Millions | |
| Recent Price: 426.69 Smart Investing & Trading Score: 100 | |
| Day Percent Change: 0.145516% Day Change: 0.64 | |
| Week Change: 2.41707% Year-to-date Change: 43.9% | |
| HCA Links: Profile News Message Board | |
| Charts:- Daily , Weekly | |
| Add HCA to Watchlist: View: Get HCA Trend Analysis ➞ | |
 | BMY Bristol-Myers Squibb Co |
| Sector: Health Care | |
| SubSector: Drug Manufacturers - General | |
| MarketCap: 95950.5 Millions | |
| Recent Price: 45.73 Smart Investing & Trading Score: 80 | |
| Day Percent Change: -3.58423% Day Change: -1.45 | |
| Week Change: 3.55525% Year-to-date Change: -16.6% | |
| BMY Links: Profile News Message Board | |
| Charts:- Daily , Weekly | |
| Add BMY to Watchlist: View: Get BMY Trend Analysis ➞ | |
 | CVS CVS Health Corp |
| Sector: Health Care | |
| SubSector: Healthcare Plans | |
| MarketCap: 93577.1 Millions | |
| Recent Price: 77.45 Smart Investing & Trading Score: 100 | |
| Day Percent Change: 0.754521% Day Change: 0.66 | |
| Week Change: 1.40089% Year-to-date Change: 81.2% | |
| CVS Links: Profile News Message Board | |
| Charts:- Daily , Weekly | |
| Add CVS to Watchlist: View: Get CVS Trend Analysis ➞ | |
 | MCK Mckesson Corporation |
| Sector: Health Care | |
| SubSector: Medical Distribution | |
| MarketCap: 85501.8 Millions | |
| Recent Price: 758.70 Smart Investing & Trading Score: 50 | |
| Day Percent Change: -0.8339% Day Change: -3.81 | |
| Week Change: -0.24718% Year-to-date Change: 34.3% | |
| MCK Links: Profile News Message Board | |
| Charts:- Daily , Weekly | |
| Add MCK to Watchlist: View: Get MCK Trend Analysis ➞ | |
 | CI Cigna Group |
| Sector: Health Care | |
| SubSector: Healthcare Plans | |
| MarketCap: 81495.8 Millions | |
| Recent Price: 296.98 Smart Investing & Trading Score: 80 | |
| Day Percent Change: 1.82753% Day Change: 4.21 | |
| Week Change: 1.9044% Year-to-date Change: 9.2% | |
| CI Links: Profile News Message Board | |
| Charts:- Daily , Weekly | |
| Add CI to Watchlist: View: Get CI Trend Analysis ➞ | |
 | ELV Elevance Health Inc |
| Sector: Health Care | |
| SubSector: Healthcare Plans | |
| MarketCap: 70624.9 Millions | |
| Recent Price: 339.95 Smart Investing & Trading Score: 30 | |
| Day Percent Change: 2.19% Day Change: 7.29 | |
| Week Change: 6.7% Year-to-date Change: -13.7% | |
| ELV Links: Profile News Message Board | |
| Charts:- Daily , Weekly | |
| Add ELV to Watchlist: View: Get ELV Trend Analysis ➞ | |
 | ZTS Zoetis Inc |
| Sector: Health Care | |
| SubSector: Drug Manufacturers - Specialty & Generic | |
| MarketCap: 67948.9 Millions | |
| Recent Price: 146.49 Smart Investing & Trading Score: 80 | |
| Day Percent Change: -0.313032% Day Change: 0.68 | |
| Week Change: 3.40227% Year-to-date Change: -9.0% | |
| ZTS Links: Profile News Message Board | |
| Charts:- Daily , Weekly | |
| Add ZTS to Watchlist: View: Get ZTS Trend Analysis ➞ | |
 | REGN Regeneron Pharmaceuticals, Inc |
| Sector: Health Care | |
| SubSector: Biotechnology | |
| MarketCap: 60771.1 Millions | |
| Recent Price: 600.00 Smart Investing & Trading Score: 100 | |
| Day Percent Change: 0.010001% Day Change: -0.1 | |
| Week Change: 3.98974% Year-to-date Change: -15.9% | |
| REGN Links: Profile News Message Board | |
| Charts:- Daily , Weekly | |
| Add REGN to Watchlist: View: Get REGN Trend Analysis ➞ | |
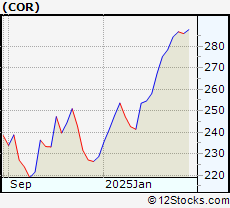 | COR Cencora Inc |
| Sector: Health Care | |
| SubSector: Medical Distribution | |
| MarketCap: 56709.3 Millions | |
| Recent Price: 308.57 Smart Investing & Trading Score: 60 | |
| Day Percent Change: -1.0264% Day Change: -3.06 | |
| Week Change: 0.0681022% Year-to-date Change: 37.9% | |
| COR Links: Profile News Message Board | |
| Charts:- Daily , Weekly | |
| Add COR to Watchlist: View: Get COR Trend Analysis ➞ | |
| For tabular summary view of above stock list: Summary View ➞ 0 - 25 , 25 - 50 , 50 - 75 | ||
| Click To Change The Sort Order: By Market Cap or Company Size Performance: Year-to-date, Week and Day | |
| Select Chart Type: | ||
|
Best Stocks Today 12Stocks.com |
© 2025 12Stocks.com Terms & Conditions Privacy Contact Us
All Information Provided Only For Education And Not To Be Used For Investing or Trading. See Terms & Conditions


One More Thing ... Get Best Stocks Delivered Daily!
Never Ever Miss A Move With Our Top Ten Stocks Lists
Find Best Stocks In Any Market - Bull or Bear Market
Take A Peek At Our Top Ten Stocks Lists: Daily, Weekly, Year-to-Date & Top Trends
Find Best Stocks In Any Market - Bull or Bear Market
Take A Peek At Our Top Ten Stocks Lists: Daily, Weekly, Year-to-Date & Top Trends
S&P 500 Stocks With Best Up Trends [0-bearish to 100-bullish]: Fair Isaac[100], Intel Corp[100], Bio-Techne Corp[100], DuPont de[100], First Solar[100], Centene Corp[100], Lam Research[100], Charles River[100], Applied Materials[100], Steel Dynamics[100], Teradyne Inc[100]
Best S&P 500 Stocks Year-to-Date:
Seagate [198.865%], Western Digital[181.204%], Newmont Corp[127.671%], Micron [110.87%], Lam Research[103.976%], Intel Corp[84.4708%], Warner Bros.[84.2%], NRG [82.3658%], CVS Health[81.156%], Amphenol Corp[79.8571%], KLA Corp[79.7904%] Best S&P 500 Stocks This Week:
Pioneer Natural[108.1%], Bio-Techne Corp[21.2222%], Electronic Arts[20.1076%], Western Digital[19.6645%], Intel Corp[19.4747%], Charles River[17.3369%], Fair Isaac[15.6495%], Lamb Weston[15.5663%], Lam Research[14.5184%], Seagate [13.8757%], Micron [13.6232%] Best S&P 500 Stocks Daily:
Fair Isaac[17.979%], Celanese Corp[6.98937%], Humana Inc[3.99157%], CF Industries[3.94539%], Eastman Chemical[3.88961%], Intel Corp[3.78408%], Albemarle Corp[3.7173%], Caesars Entertainment[3.66089%], Bio-Techne Corp[3.6215%], DuPont de[3.54129%], Advanced Micro[3.48759%]