
 Login Sign Up


| |||||
 |  | ||||

| 12Stocks.com Market Intelligence |
Best S&P 100 Stocks
| In a hurry? S&P 100 Stocks Lists: Performance Trends Table, Stock Charts
Sort S&P 100 stocks: Daily, Weekly, Year-to-Date, Market Cap & Trends. |
| 12Stocks.com S&P 100 Stocks Performances & Trends Daily | |||||||||
|
|  The overall Smart Investing & Trading Score is 83 (0-bearish to 100-bullish) which puts S&P 100 index in short term bullish trend. The Smart Investing & Trading Score from previous trading session is 30 and hence an improvement of trend.
| ||||||||
Here are the Smart Investing & Trading Scores of the most requested S&P 100 stocks at 12Stocks.com (click stock name for detailed review):
|


| 12Stocks.com: Top Performing S&P 100 Index Stocks | ||||||||||||||||||||||||||||||||||||||||||||||||
 The top performing S&P 100 Index stocks year to date are
Now, more recently, over last week, the top performing S&P 100 Index stocks on the move are


|
||||||||||||||||||||||||||||||||||||||||||||||||
| 12Stocks.com: Investing in S&P 100 Index with Stocks | |
|
The following table helps investors and traders sort through current performance and trends (as measured by Smart Investing & Trading Score) of various
stocks in the S&P 100 Index. Quick View: Move mouse or cursor over stock symbol (ticker) to view short-term technical chart and over stock name to view long term chart. Click on  to add stock symbol to your watchlist and to add stock symbol to your watchlist and  to view watchlist. Click on any ticker or stock name for detailed market intelligence report for that stock. to view watchlist. Click on any ticker or stock name for detailed market intelligence report for that stock. |
12Stocks.com Performance of Stocks in S&P 100 Index
| Ticker | Stock Name | Watchlist | Category | Recent Price | Smart Investing & Trading Score | Change % | YTD Change% |
| JPM | JPMorgan Chase |   | Financials | 190.51 | 56 | -0.60% | 12.00% |
| TGT | Target | | Services & Goods | 158.04 | 48 | -0.05% | 10.97% |
| GD | General Dynamics | | Industrials | 288.14 | 63 | 0.27% | 10.96% |
| BAC | Bank of America | | Financials | 37.25 | 76 | 1.00% | 10.63% |
| SCHW | Charles Schwab | | Financials | 76.04 | 100 | 0.94% | 10.52% |
| ORCL | Oracle | | Technology | 115.80 | 58 | 0.73% | 9.84% |
| BK | Bank of New York | | Financials | 57.00 | 78 | 0.71% | 9.51% |
| EMR | Emerson Electric | | Industrials | 106.54 | 23 | 0.12% | 9.46% |
| OEF | iShares S&P | | Utilities | 243.74 | 83 | 1.46% | 9.11% |
| COF | Capital One | | Financials | 142.41 | 49 | 0.42% | 8.61% |
| SO | Southern | | Utilities | 75.85 | 95 | 0.69% | 8.17% |
| MSFT | Microsoft | | Technology | 406.66 | 32 | 2.22% | 8.14% |
| AMGN | Amgen | | Health Care | 311.29 | 100 | 11.82% | 8.08% |
| MO | Altria | | Consumer Staples | 43.59 | 76 | -0.89% | 8.06% |
| TMO | Thermo Fisher | | Health Care | 572.38 | 60 | 0.20% | 7.84% |
| SPY | SPDR S&P | | Utilities | 511.29 | 60 | 1.24% | 7.57% |
| CVX | Chevron | | Energy | 160.25 | 59 | -0.30% | 7.43% |
| DHR | Danaher | | Industrials | 248.38 | 62 | 0.62% | 7.37% |
| PYPL | PayPal | | Financials | 65.70 | 63 | -1.91% | 6.99% |
| MET | MetLife | | Financials | 70.52 | 34 | 0.40% | 6.64% |
| ABBV | AbbVie | | Health Care | 163.79 | 40 | 1.85% | 5.69% |
| KO | Coca-Cola | | Consumer Staples | 62.17 | 76 | 0.29% | 5.50% |
| COP | ConocoPhillips | | Energy | 122.23 | 26 | -0.02% | 5.31% |
| TXN | Texas Instruments | | Technology | 178.91 | 88 | 1.77% | 4.96% |
| LOW | Lowe s | | Services & Goods | 232.13 | 47 | 1.11% | 4.30% |
| For chart view version of above stock list: Chart View ➞ 0 - 25 , 25 - 50 , 50 - 75 , 75 - 100 , 100 - 125 | ||
 | Click To Change The Sort Order: By Market Cap or Company Size Performance: Year-to-date, Week and Day |  |
|
Get the most comprehensive stock market coverage daily at 12Stocks.com ➞ Best Stocks Today ➞ Best Stocks Weekly ➞ Best Stocks Year-to-Date ➞ Best Stocks Trends ➞  Best Stocks Today 12Stocks.com Best Nasdaq Stocks ➞ Best S&P 500 Stocks ➞ Best Tech Stocks ➞ Best Biotech Stocks ➞ |
| Detailed Overview of S&P 100 Stocks |
| S&P 100 Technical Overview, Leaders & Laggards, Top S&P 100 ETF Funds & Detailed S&P 100 Stocks List, Charts, Trends & More |
| S&P 100: Technical Analysis, Trends & YTD Performance | |
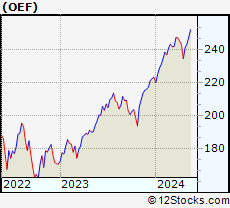
| S&P 100 index as represented by
OEF, an exchange-traded fund [ETF], holds basket of one hundred US (mostly largecap) stocks from across all major sectors of the US stock market. The S&P 100 index (contains stocks like Apple and Exxon) is up by 9.11% and is currently outperforming the overall market by 2.23% year-to-date. Below is a quick view of technical charts and trends: | |
 OEF Weekly Chart |
|
| Long Term Trend: Good | |
| Medium Term Trend: Good | |
 OEF Daily Chart |
|
| Short Term Trend: Very Good | |
| Overall Trend Score: 83 | |
| YTD Performance: 9.11% | |
| **Trend Scores & Views Are Only For Educational Purposes And Not For Investing | |
| 12Stocks.com: Investing in S&P 100 Index using Exchange Traded Funds | |
|
The following table shows list of key exchange traded funds (ETF) that
help investors track S&P 100 index. We have also included ETF funds that track S&P 500 index since it is market-cap weighted. The following list also includes leveraged ETF funds that track twice or thrice the daily returns of S&P 100 indices. Short or inverse ETF funds move in the opposite direction to the index they track and are useful during market pullbacks or during bear markets. Quick View: Move mouse or cursor over ETF symbol (ticker) to view short-term technical chart and over ETF name to view long term chart. Click on ticker or stock name for detailed view. Click on to add stock symbol to your watchlist and to view watchlist. |
12Stocks.com List of ETFs that track S&P 100 Index
| Ticker | ETF Name | Watchlist | Recent Price | Smart Investing & Trading Score | Change % | Week % | Year-to-date % |
| SPY | SPDR S&P 500 ETF | | 511.29 | 60 | 1.24 | 0.6 | 7.57% |
| SPXS | Direxion Daily S&P 500 Bear 3X ETF | | 9.46 | 23 | -3.57 | -1.56 | -18.1% |
| SH | ProShares Short S&P500 | | 12.23 | 41 | -1.21 | -0.41 | -5.85% |
| SDS | ProShares UltraShort S&P500 | | 26.25 | 28 | -2.42 | -1.06 | -12.27% |
| SPXU | ProShares UltraPro Short S&P500 | | 34.89 | 23 | -3.78 | -1.72 | -18.86% |
| UPRO | ProShares UltraPro S&P500 | | 64.69 | 52 | 3.72 | 1.36 | 18.18% |
| SPXL | Direxion Daily S&P500 Bull 3X ETF | | 122.86 | 52 | 3.73 | 1.42 | 18.15% |
| VOO | Vanguard 500 ETF | | 469.98 | 60 | 1.24 | 0.59 | 7.6% |
| SSO | ProShares Ultra S&P500 | | 73.46 | 60 | 2.51 | 1.03 | 12.89% |
| OEF | iShares S&P 100 | | 243.74 | 83 | 1.46 | 0.9 | 9.11% |
| 12Stocks.com: Charts, Trends, Fundamental Data and Performances of S&P 100 Stocks | |
|
We now take in-depth look at all S&P 100 stocks including charts, multi-period performances and overall trends (as measured by Smart Investing & Trading Score). One can sort S&P 100 stocks (click link to choose) by Daily, Weekly and by Year-to-Date performances. Also, one can sort by size of the company or by market capitalization. |
| Select Your Default Chart Type: | |||||
| |||||
| Click on stock symbol or name for detailed view. Click on to add stock symbol to your watchlist and to view watchlist. Quick View: Move mouse or cursor over "Daily" to quickly view daily technical stock chart and over "Weekly" to view weekly technical stock chart. | |||||
 | JPM JPMorgan Chase & Co. |
| Sector: Financials | |
| SubSector: Money Center Banks | |
| MarketCap: 279736 Millions | |
| Recent Price: 190.51 Smart Investing & Trading Score: 56 | |
| Day Percent Change: -0.60% Day Change: -1.15 | |
| Week Change: -1.54% Year-to-date Change: 12.0% | |
| JPM Links: Profile News Message Board | |
| Charts:- Daily , Weekly | |
| Add JPM to Watchlist: View: Get Complete JPM Trend Analysis ➞ | |
 | TGT Target Corporation |
| Sector: Services & Goods | |
| SubSector: Discount, Variety Stores | |
| MarketCap: 55980.6 Millions | |
| Recent Price: 158.04 Smart Investing & Trading Score: 48 | |
| Day Percent Change: -0.05% Day Change: -0.08 | |
| Week Change: -4.07% Year-to-date Change: 11.0% | |
| TGT Links: Profile News Message Board | |
| Charts:- Daily , Weekly | |
| Add TGT to Watchlist: View: Get Complete TGT Trend Analysis ➞ | |
 | GD General Dynamics Corporation |
| Sector: Industrials | |
| SubSector: Aerospace/Defense Products & Services | |
| MarketCap: 37063.8 Millions | |
| Recent Price: 288.14 Smart Investing & Trading Score: 63 | |
| Day Percent Change: 0.27% Day Change: 0.78 | |
| Week Change: 1.31% Year-to-date Change: 11.0% | |
| GD Links: Profile News Message Board | |
| Charts:- Daily , Weekly | |
| Add GD to Watchlist: View: Get Complete GD Trend Analysis ➞ | |
 | BAC Bank of America Corporation |
| Sector: Financials | |
| SubSector: Money Center Banks | |
| MarketCap: 189690 Millions | |
| Recent Price: 37.25 Smart Investing & Trading Score: 76 | |
| Day Percent Change: 1.00% Day Change: 0.37 | |
| Week Change: -1.53% Year-to-date Change: 10.6% | |
| BAC Links: Profile News Message Board | |
| Charts:- Daily , Weekly | |
| Add BAC to Watchlist: View: Get Complete BAC Trend Analysis ➞ | |
 | SCHW The Charles Schwab Corporation |
| Sector: Financials | |
| SubSector: Investment Brokerage - National | |
| MarketCap: 45115.8 Millions | |
| Recent Price: 76.04 Smart Investing & Trading Score: 100 | |
| Day Percent Change: 0.94% Day Change: 0.71 | |
| Week Change: 1.4% Year-to-date Change: 10.5% | |
| SCHW Links: Profile News Message Board | |
| Charts:- Daily , Weekly | |
| Add SCHW to Watchlist: View: Get Complete SCHW Trend Analysis ➞ | |
 | ORCL Oracle Corporation |
| Sector: Technology | |
| SubSector: Application Software | |
| MarketCap: 164530 Millions | |
| Recent Price: 115.80 Smart Investing & Trading Score: 58 | |
| Day Percent Change: 0.73% Day Change: 0.84 | |
| Week Change: -1.2% Year-to-date Change: 9.8% | |
| ORCL Links: Profile News Message Board | |
| Charts:- Daily , Weekly | |
| Add ORCL to Watchlist: View: Get Complete ORCL Trend Analysis ➞ | |
 | BK The Bank of New York Mellon Corporation |
| Sector: Financials | |
| SubSector: Asset Management | |
| MarketCap: 29807.5 Millions | |
| Recent Price: 57.00 Smart Investing & Trading Score: 78 | |
| Day Percent Change: 0.71% Day Change: 0.40 | |
| Week Change: -0.56% Year-to-date Change: 9.5% | |
| BK Links: Profile News Message Board | |
| Charts:- Daily , Weekly | |
| Add BK to Watchlist: View: Get Complete BK Trend Analysis ➞ | |
 | EMR Emerson Electric Co. |
| Sector: Industrials | |
| SubSector: Industrial Electrical Equipment | |
| MarketCap: 30457.9 Millions | |
| Recent Price: 106.54 Smart Investing & Trading Score: 23 | |
| Day Percent Change: 0.12% Day Change: 0.13 | |
| Week Change: -3.05% Year-to-date Change: 9.5% | |
| EMR Links: Profile News Message Board | |
| Charts:- Daily , Weekly | |
| Add EMR to Watchlist: View: Get Complete EMR Trend Analysis ➞ | |
 | OEF iShares S&P 100 |
| Sector: Utilities | |
| SubSector: Exchange Traded Fund | |
| MarketCap: 0 Millions | |
| Recent Price: 243.74 Smart Investing & Trading Score: 83 | |
| Day Percent Change: 1.46% Day Change: 3.51 | |
| Week Change: 0.9% Year-to-date Change: 9.1% | |
| OEF Links: Profile News Message Board | |
| Charts:- Daily , Weekly | |
| Add OEF to Watchlist: View: Get Complete OEF Trend Analysis ➞ | |
 | COF Capital One Financial Corporation |
| Sector: Financials | |
| SubSector: Credit Services | |
| MarketCap: 23094.2 Millions | |
| Recent Price: 142.41 Smart Investing & Trading Score: 49 | |
| Day Percent Change: 0.42% Day Change: 0.60 | |
| Week Change: -2.6% Year-to-date Change: 8.6% | |
| COF Links: Profile News Message Board | |
| Charts:- Daily , Weekly | |
| Add COF to Watchlist: View: Get Complete COF Trend Analysis ➞ | |
 | SO The Southern Company |
| Sector: Utilities | |
| SubSector: Electric Utilities | |
| MarketCap: 54483.6 Millions | |
| Recent Price: 75.85 Smart Investing & Trading Score: 95 | |
| Day Percent Change: 0.69% Day Change: 0.52 | |
| Week Change: 3.61% Year-to-date Change: 8.2% | |
| SO Links: Profile News Message Board | |
| Charts:- Daily , Weekly | |
| Add SO to Watchlist: View: Get Complete SO Trend Analysis ➞ | |
 | MSFT Microsoft Corporation |
| Sector: Technology | |
| SubSector: Business Software & Services | |
| MarketCap: 1154150 Millions | |
| Recent Price: 406.66 Smart Investing & Trading Score: 32 | |
| Day Percent Change: 2.22% Day Change: 8.82 | |
| Week Change: 0.08% Year-to-date Change: 8.1% | |
| MSFT Links: Profile News Message Board | |
| Charts:- Daily , Weekly | |
| Add MSFT to Watchlist: View: Get Complete MSFT Trend Analysis ➞ | |
 | AMGN Amgen Inc. |
| Sector: Health Care | |
| SubSector: Biotechnology | |
| MarketCap: 121030 Millions | |
| Recent Price: 311.29 Smart Investing & Trading Score: 100 | |
| Day Percent Change: 11.82% Day Change: 32.90 | |
| Week Change: 15.3% Year-to-date Change: 8.1% | |
| AMGN Links: Profile News Message Board | |
| Charts:- Daily , Weekly | |
| Add AMGN to Watchlist: View: Get Complete AMGN Trend Analysis ➞ | |
 | MO Altria Group, Inc. |
| Sector: Consumer Staples | |
| SubSector: Cigarettes | |
| MarketCap: 70806.3 Millions | |
| Recent Price: 43.59 Smart Investing & Trading Score: 76 | |
| Day Percent Change: -0.89% Day Change: -0.39 | |
| Week Change: 0.48% Year-to-date Change: 8.1% | |
| MO Links: Profile News Message Board | |
| Charts:- Daily , Weekly | |
| Add MO to Watchlist: View: Get Complete MO Trend Analysis ➞ | |
 | TMO Thermo Fisher Scientific Inc. |
| Sector: Health Care | |
| SubSector: Medical Laboratories & Research | |
| MarketCap: 112999 Millions | |
| Recent Price: 572.38 Smart Investing & Trading Score: 60 | |
| Day Percent Change: 0.20% Day Change: 1.13 | |
| Week Change: -0.21% Year-to-date Change: 7.8% | |
| TMO Links: Profile News Message Board | |
| Charts:- Daily , Weekly | |
| Add TMO to Watchlist: View: Get Complete TMO Trend Analysis ➞ | |
 | SPY SPDR S&P 500 ETF |
| Sector: Utilities | |
| SubSector: Exchange Traded Fund | |
| MarketCap: 0 Millions | |
| Recent Price: 511.29 Smart Investing & Trading Score: 60 | |
| Day Percent Change: 1.24% Day Change: 6.26 | |
| Week Change: 0.6% Year-to-date Change: 7.6% | |
| SPY Links: Profile News Message Board | |
| Charts:- Daily , Weekly | |
| Add SPY to Watchlist: View: Get Complete SPY Trend Analysis ➞ | |
 | CVX Chevron Corporation |
| Sector: Energy | |
| SubSector: Major Integrated Oil & Gas | |
| MarketCap: 121521 Millions | |
| Recent Price: 160.25 Smart Investing & Trading Score: 59 | |
| Day Percent Change: -0.30% Day Change: -0.48 | |
| Week Change: -3.4% Year-to-date Change: 7.4% | |
| CVX Links: Profile News Message Board | |
| Charts:- Daily , Weekly | |
| Add CVX to Watchlist: View: Get Complete CVX Trend Analysis ➞ | |
 | DHR Danaher Corporation |
| Sector: Industrials | |
| SubSector: Diversified Machinery | |
| MarketCap: 93210.3 Millions | |
| Recent Price: 248.38 Smart Investing & Trading Score: 62 | |
| Day Percent Change: 0.62% Day Change: 1.54 | |
| Week Change: 0.73% Year-to-date Change: 7.4% | |
| DHR Links: Profile News Message Board | |
| Charts:- Daily , Weekly | |
| Add DHR to Watchlist: View: Get Complete DHR Trend Analysis ➞ | |
 | PYPL PayPal Holdings, Inc. |
| Sector: Financials | |
| SubSector: Credit Services | |
| MarketCap: 108949 Millions | |
| Recent Price: 65.70 Smart Investing & Trading Score: 63 | |
| Day Percent Change: -1.91% Day Change: -1.28 | |
| Week Change: -0.39% Year-to-date Change: 7.0% | |
| PYPL Links: Profile News Message Board | |
| Charts:- Daily , Weekly | |
| Add PYPL to Watchlist: View: Get Complete PYPL Trend Analysis ➞ | |
 | MET MetLife, Inc. |
| Sector: Financials | |
| SubSector: Life Insurance | |
| MarketCap: 26272.9 Millions | |
| Recent Price: 70.52 Smart Investing & Trading Score: 34 | |
| Day Percent Change: 0.40% Day Change: 0.28 | |
| Week Change: 0.14% Year-to-date Change: 6.6% | |
| MET Links: Profile News Message Board | |
| Charts:- Daily , Weekly | |
| Add MET to Watchlist: View: Get Complete MET Trend Analysis ➞ | |
 | ABBV AbbVie Inc. |
| Sector: Health Care | |
| SubSector: Drug Manufacturers - Major | |
| MarketCap: 110080 Millions | |
| Recent Price: 163.79 Smart Investing & Trading Score: 40 | |
| Day Percent Change: 1.85% Day Change: 2.98 | |
| Week Change: 2.61% Year-to-date Change: 5.7% | |
| ABBV Links: Profile News Message Board | |
| Charts:- Daily , Weekly | |
| Add ABBV to Watchlist: View: Get Complete ABBV Trend Analysis ➞ | |
 | KO The Coca-Cola Company |
| Sector: Consumer Staples | |
| SubSector: Beverages - Soft Drinks | |
| MarketCap: 182046 Millions | |
| Recent Price: 62.17 Smart Investing & Trading Score: 76 | |
| Day Percent Change: 0.29% Day Change: 0.18 | |
| Week Change: 0.7% Year-to-date Change: 5.5% | |
| KO Links: Profile News Message Board | |
| Charts:- Daily , Weekly | |
| Add KO to Watchlist: View: Get Complete KO Trend Analysis ➞ | |
 | COP ConocoPhillips |
| Sector: Energy | |
| SubSector: Independent Oil & Gas | |
| MarketCap: 33504.3 Millions | |
| Recent Price: 122.23 Smart Investing & Trading Score: 26 | |
| Day Percent Change: -0.02% Day Change: -0.02 | |
| Week Change: -6.15% Year-to-date Change: 5.3% | |
| COP Links: Profile News Message Board | |
| Charts:- Daily , Weekly | |
| Add COP to Watchlist: View: Get Complete COP Trend Analysis ➞ | |
 | TXN Texas Instruments Incorporated |
| Sector: Technology | |
| SubSector: Semiconductor - Broad Line | |
| MarketCap: 99509.1 Millions | |
| Recent Price: 178.91 Smart Investing & Trading Score: 88 | |
| Day Percent Change: 1.77% Day Change: 3.11 | |
| Week Change: 0.81% Year-to-date Change: 5.0% | |
| TXN Links: Profile News Message Board | |
| Charts:- Daily , Weekly | |
| Add TXN to Watchlist: View: Get Complete TXN Trend Analysis ➞ | |
 | LOW Lowe s Companies, Inc. |
| Sector: Services & Goods | |
| SubSector: Home Improvement Stores | |
| MarketCap: 56084.2 Millions | |
| Recent Price: 232.13 Smart Investing & Trading Score: 47 | |
| Day Percent Change: 1.11% Day Change: 2.55 | |
| Week Change: 0.98% Year-to-date Change: 4.3% | |
| LOW Links: Profile News Message Board | |
| Charts:- Daily , Weekly | |
| Add LOW to Watchlist: View: Get Complete LOW Trend Analysis ➞ | |
| For tabular summary view of above stock list: Summary View ➞ 0 - 25 , 25 - 50 , 50 - 75 , 75 - 100 , 100 - 125 | ||
| Click To Change The Sort Order: By Market Cap or Company Size Performance: Year-to-date, Week and Day | |
| Select Chart Type: | ||
|
Best Stocks Today 12Stocks.com |
� 2024 12Stocks.com Terms & Conditions Privacy Contact Us
All Information Provided Only For Education And Not To Be Used For Investing or Trading. See Terms & Conditions


One More Thing ... Get Best Stocks Delivered Daily!
Never Ever Miss A Move With Our Top Ten Stocks Lists
Find Best Stocks In Any Market - Bull or Bear Market
Take A Peek At Our Top Ten Stocks Lists: Daily, Weekly, Year-to-Date & Top Trends
Find Best Stocks In Any Market - Bull or Bear Market
Take A Peek At Our Top Ten Stocks Lists: Daily, Weekly, Year-to-Date & Top Trends
S&P 100 Stocks With Best Up Trends [0-bearish to 100-bullish]: Amgen [100], Apple [100], NextEra Energy[100], Goldman Sachs[100], Duke Energy[100], Charles Schwab[100], Pfizer [100], QUALCOMM [100], Southern [95], Google [95], Google [95]
Best S&P 100 Stocks Year-to-Date:
NVIDIA [79.29%], General Electric[28.58%], Meta Platforms[27.74%], Eli Lilly[26.08%], Walt Disney[25.88%], General Motors[24.89%], QUALCOMM [24.21%], American Express[23.18%], Amazon.com [22.55%], Wells Fargo[21.78%], Google [19.91%] Best S&P 100 Stocks This Week:
Amgen [15.3%], Pfizer [9.49%], QUALCOMM [8.44%], Apple [8.32%], Tesla [7.67%], Boeing [7.52%], NextEra Energy[6.29%], American Tower[5.85%], 3M [5.79%], American [5.3%], Charter [4.45%] Best S&P 100 Stocks Daily:
Amgen [11.82%], Apple [5.98%], NVIDIA [3.46%], Broadcom [3.19%], Advanced Micro[3.04%], Booking [3.01%], Netflix [2.51%], Meta Platforms[2.34%], Microsoft [2.22%], Home Depot[2.18%], Adobe [2.02%]