
 Login Sign Up


| |||||
 |  | ||||

| 12Stocks.com Market Intelligence |
Best MidCap Stocks
|
| In a hurry? Mid Cap Stocks Lists: Performance Trends Table, Stock Charts
Sort midcap stocks: Daily, Weekly, Year-to-Date, Market Cap & Trends. Filter midcap stocks list by sector: Show all, Tech, Finance, Energy, Staples, Retail, Industrial, Materials, Utilities and HealthCare Filter midcap stocks list by size:All MidCap Large Mid-Range Small |
| 12Stocks.com Mid Cap Stocks Performances & Trends Daily | |||||||||
|
|  The overall Smart Investing & Trading Score is 45 (0-bearish to 100-bullish) which puts Mid Cap index in short term neutral trend. The Smart Investing & Trading Score from previous trading session is 38 and hence an improvement of trend.
| ||||||||
Here are the Smart Investing & Trading Scores of the most requested mid cap stocks at 12Stocks.com (click stock name for detailed review):
|


| 12Stocks.com: Top Performing Mid Cap Index Stocks | ||||||||||||||||||||||||||||||||||||||||||||||||
 The top performing Mid Cap Index stocks year to date are
Now, more recently, over last week, the top performing Mid Cap Index stocks on the move are


|
||||||||||||||||||||||||||||||||||||||||||||||||
| 12Stocks.com: Investing in Midcap Index with Stocks | |
|
The following table helps investors and traders sort through current performance and trends (as measured by Smart Investing & Trading Score) of various
stocks in the Midcap Index. Quick View: Move mouse or cursor over stock symbol (ticker) to view short-term technical chart and over stock name to view long term chart. Click on  to add stock symbol to your watchlist and to add stock symbol to your watchlist and  to view watchlist. Click on any ticker or stock name for detailed market intelligence report for that stock. to view watchlist. Click on any ticker or stock name for detailed market intelligence report for that stock. |
12Stocks.com Performance of Stocks in Midcap Index
| Ticker | Stock Name | Watchlist | Category | Recent Price | Smart Investing & Trading Score | Change % | YTD Change% |
| MTN | Vail Resorts |   | Services & Goods | 191.17 | 10 | 0.95% | -10.45% |
| WSO | Watsco | | Services & Goods | 450.71 | 73 | 0.67% | 5.19% |
| AAP | Advance Auto | | Services & Goods | 73.03 | 68 | 0.07% | 19.66% |
| NWSA | News | | Services & Goods | 23.82 | 10 | 0.11% | -2.95% |
| CASY | Casey s | | Services & Goods | 318.96 | 61 | -0.19% | 16.10% |
| IPG | Interpublic | | Services & Goods | 30.50 | 25 | 0.20% | -6.56% |
| DRI | Darden Restaurants | | Services & Goods | 151.15 | 0 | -1.47% | -8.00% |
| H | Hyatt Hotels | | Services & Goods | 149.01 | 25 | 0.15% | 14.26% |
| BFAM | Bright Horizons | | Services & Goods | 103.73 | 0 | 0.02% | 10.07% |
| MGM | MGM Resorts | | Services & Goods | 39.75 | 10 | 0.79% | -11.03% |
| ARMK | Aramark | | Services & Goods | 31.15 | 36 | -1.14% | 10.85% |
| NYT | New York | | Services & Goods | 43.33 | 47 | 0.70% | -11.55% |
| LSXMK | Liberty SiriusXM | | Services & Goods | 24.63 | 5 | 2.37% | -14.42% |
| EEFT | Euronet Worldwide | | Services & Goods | 104.42 | 59 | 1.69% | 2.89% |
| ACM | AECOM | | Services & Goods | 92.91 | 51 | 0.60% | 0.52% |
| FWONK | Formula One | | Services & Goods | 70.32 | 54 | 0.50% | 11.39% |
| CZR | Caesars Entertainment | | Services & Goods | 36.39 | 10 | 1.59% | -22.38% |
| CAVA | CAVA | | Services & Goods | 68.01 | 53 | -5.46% | 56.42% |
| DRVN | Driven | | Services & Goods | 14.23 | 46 | -0.73% | -0.84% |
| FCN | FTI Consulting | | Services & Goods | 212.54 | 66 | -0.60% | 6.72% |
| FYBR | Frontier | | Services & Goods | 23.06 | 35 | -0.45% | -8.62% |
| WEX | WEX | | Services & Goods | 209.41 | 10 | -0.88% | 7.64% |
| RHI | Robert Half | | Services & Goods | 69.25 | 42 | 0.16% | -21.24% |
| ETSY | Etsy | | Services & Goods | 69.74 | 67 | 1.56% | -13.95% |
| PLTK | Playtika Holding | | Services & Goods | 7.53 | 100 | 3.72% | -12.70% |
| For chart view version of above stock list: Chart View ➞ 0 - 25 , 25 - 50 , 50 - 75 , 75 - 100 , 100 - 125 , 125 - 150 | ||
 | Click To Change The Sort Order: By Market Cap or Company Size Performance: Year-to-date, Week and Day |  |
|
Get the most comprehensive stock market coverage daily at 12Stocks.com ➞ Best Stocks Today ➞ Best Stocks Weekly ➞ Best Stocks Year-to-Date ➞ Best Stocks Trends ➞  Best Stocks Today 12Stocks.com Best Nasdaq Stocks ➞ Best S&P 500 Stocks ➞ Best Tech Stocks ➞ Best Biotech Stocks ➞ |
| Detailed Overview of Midcap Stocks |
| Midcap Technical Overview, Leaders & Laggards, Top Midcap ETF Funds & Detailed Midcap Stocks List, Charts, Trends & More |
| Midcap: Technical Analysis, Trends & YTD Performance | |
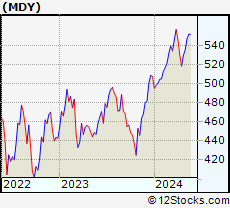
| MidCap segment as represented by
MDY, an exchange-traded fund [ETF], holds basket of about four hundred midcap stocks from across all major sectors of the US stock market. The midcap index (contains stocks like Green Mountain Coffee Roasters and Tractor Supply Company) is up by 3.12% and is currently underperforming the overall market by -1.42% year-to-date. Below is a quick view of technical charts and trends: | |
 MDY Weekly Chart |
|
| Long Term Trend: Good | |
| Medium Term Trend: Not Good | |
 MDY Daily Chart |
|
| Short Term Trend: Very Good | |
| Overall Trend Score: 45 | |
| YTD Performance: 3.12% | |
| **Trend Scores & Views Are Only For Educational Purposes And Not For Investing | |
| 12Stocks.com: Investing in Midcap Index using Exchange Traded Funds | |
|
The following table shows list of key exchange traded funds (ETF) that
help investors track Midcap index. The following list also includes leveraged ETF funds that track twice or thrice the daily returns of Midcap indices. Short or inverse ETF funds move in the opposite direction to the index they track and are useful during market pullbacks or during bear markets. Quick View: Move mouse or cursor over ETF symbol (ticker) to view short-term technical chart and over ETF name to view long term chart. Click on ticker or stock name for detailed view. Click on to add stock symbol to your watchlist and to view watchlist. |
12Stocks.com List of ETFs that track Midcap Index
| Ticker | ETF Name | Watchlist | Recent Price | Smart Investing & Trading Score | Change % | Week % | Year-to-date % |
| IJH | iShares Core S&P Mid-Cap | | 57.19 | 7 | 0.11 | -1.09 | 3.18% |
| MDY | SPDR S&P MidCap 400 ETF | | 523.21 | 45 | 0.09 | -1.17 | 3.12% |
| IWR | iShares Russell Mid-Cap | | 79.53 | 7 | -0.11 | -1.23 | 2.32% |
| IWP | iShares Russell Mid-Cap Growth | | 107.52 | 7 | 0.07 | -1.34 | 2.92% |
| IWS | iShares Russell Mid-Cap Value | | 118.71 | 7 | -0.13 | -1.07 | 2.08% |
| IJK | iShares S&P Mid-Cap 400 Growth | | 85.88 | 7 | 0.05 | -1.29 | 8.41% |
| IJJ | iShares S&P Mid-Cap 400 Value | | 111.45 | 22 | 0.35 | -0.7 | -2.27% |
| XMLV | PowerShares S&P MidCap Low Volatil ETF | | 54.86 | 47 | 0.77 | 0.38 | 3.16% |
| MVV | ProShares Ultra MidCap400 | | 61.31 | 17 | 2.37 | -0.2 | 5.91% |
| SMDD | ProShares UltraPro Short MidCap400 | | 12.29 | 88 | 0.66 | 3.89 | -8.72% |
| UMDD | ProShares UltraPro MidCap400 | | 23.07 | 0 | -0.82 | -3.71 | 3.36% |
| MZZ | ProShares UltraShort MidCap400 | | 11.80 | 46 | -0.17 | 1.03 | -6.13% |
| MYY | ProShares Short MidCap400 | | 20.99 | 70 | 0.38 | 0.96 | -2.17% |
| 12Stocks.com: Charts, Trends, Fundamental Data and Performances of MidCap Stocks | |
|
We now take in-depth look at all MidCap stocks including charts, multi-period performances and overall trends (as measured by Smart Investing & Trading Score). One can sort MidCap stocks (click link to choose) by Daily, Weekly and by Year-to-Date performances. Also, one can sort by size of the company or by market capitalization. |
| Select Your Default Chart Type: | |||||
| |||||
| Click on stock symbol or name for detailed view. Click on to add stock symbol to your watchlist and to view watchlist. Quick View: Move mouse or cursor over "Daily" to quickly view daily technical stock chart and over "Weekly" to view weekly technical stock chart. | |||||

 | MTN Vail Resorts, Inc. |
| Sector: Services & Goods | |
| SubSector: Resorts & Casinos | |
| MarketCap: 6259.64 Millions | |
| Recent Price: 191.17 Smart Investing & Trading Score: 10 | |
| Day Percent Change: 0.95% Day Change: 1.80 | |
| Week Change: -3.61% Year-to-date Change: -10.5% | |
| MTN Links: Profile News Message Board | |
| Charts:- Daily , Weekly | |
| Add MTN to Watchlist: View: Get Complete MTN Trend Analysis ➞ | |
 | WSO Watsco, Inc. |
| Sector: Services & Goods | |
| SubSector: Electronics Wholesale | |
| MarketCap: 6000.33 Millions | |
| Recent Price: 450.71 Smart Investing & Trading Score: 73 | |
| Day Percent Change: 0.67% Day Change: 2.99 | |
| Week Change: 1.69% Year-to-date Change: 5.2% | |
| WSO Links: Profile News Message Board | |
| Charts:- Daily , Weekly | |
| Add WSO to Watchlist: View: Get Complete WSO Trend Analysis ➞ | |
 | AAP Advance Auto Parts, Inc. |
| Sector: Services & Goods | |
| SubSector: Auto Parts Stores | |
| MarketCap: 5977.7 Millions | |
| Recent Price: 73.03 Smart Investing & Trading Score: 68 | |
| Day Percent Change: 0.07% Day Change: 0.05 | |
| Week Change: -2.81% Year-to-date Change: 19.7% | |
| AAP Links: Profile News Message Board | |
| Charts:- Daily , Weekly | |
| Add AAP to Watchlist: View: Get Complete AAP Trend Analysis ➞ | |
 | NWSA News Corporation |
| Sector: Services & Goods | |
| SubSector: Broadcasting - TV | |
| MarketCap: 5857.53 Millions | |
| Recent Price: 23.82 Smart Investing & Trading Score: 10 | |
| Day Percent Change: 0.11% Day Change: 0.02 | |
| Week Change: -1.63% Year-to-date Change: -3.0% | |
| NWSA Links: Profile News Message Board | |
| Charts:- Daily , Weekly | |
| Add NWSA to Watchlist: View: Get Complete NWSA Trend Analysis ➞ | |
 | CASY Casey s General Stores, Inc. |
| Sector: Services & Goods | |
| SubSector: Grocery Stores | |
| MarketCap: 5787.95 Millions | |
| Recent Price: 318.96 Smart Investing & Trading Score: 61 | |
| Day Percent Change: -0.19% Day Change: -0.62 | |
| Week Change: -0.33% Year-to-date Change: 16.1% | |
| CASY Links: Profile News Message Board | |
| Charts:- Daily , Weekly | |
| Add CASY to Watchlist: View: Get Complete CASY Trend Analysis ➞ | |
 | IPG The Interpublic Group of Companies, Inc. |
| Sector: Services & Goods | |
| SubSector: Advertising Agencies | |
| MarketCap: 5730.55 Millions | |
| Recent Price: 30.50 Smart Investing & Trading Score: 25 | |
| Day Percent Change: 0.20% Day Change: 0.06 | |
| Week Change: -3.08% Year-to-date Change: -6.6% | |
| IPG Links: Profile News Message Board | |
| Charts:- Daily , Weekly | |
| Add IPG to Watchlist: View: Get Complete IPG Trend Analysis ➞ | |
 | DRI Darden Restaurants, Inc. |
| Sector: Services & Goods | |
| SubSector: Restaurants | |
| MarketCap: 5623.1 Millions | |
| Recent Price: 151.15 Smart Investing & Trading Score: 0 | |
| Day Percent Change: -1.47% Day Change: -2.26 | |
| Week Change: -3.17% Year-to-date Change: -8.0% | |
| DRI Links: Profile News Message Board | |
| Charts:- Daily , Weekly | |
| Add DRI to Watchlist: View: Get Complete DRI Trend Analysis ➞ | |
 | H Hyatt Hotels Corporation |
| Sector: Services & Goods | |
| SubSector: Lodging | |
| MarketCap: 5525.56 Millions | |
| Recent Price: 149.01 Smart Investing & Trading Score: 25 | |
| Day Percent Change: 0.15% Day Change: 0.22 | |
| Week Change: -1.53% Year-to-date Change: 14.3% | |
| H Links: Profile News Message Board | |
| Charts:- Daily , Weekly | |
| Add H to Watchlist: View: Get Complete H Trend Analysis ➞ | |
 | BFAM Bright Horizons Family Solutions Inc. |
| Sector: Services & Goods | |
| SubSector: Personal Services | |
| MarketCap: 5487.65 Millions | |
| Recent Price: 103.73 Smart Investing & Trading Score: 0 | |
| Day Percent Change: 0.02% Day Change: 0.02 | |
| Week Change: -2.77% Year-to-date Change: 10.1% | |
| BFAM Links: Profile News Message Board | |
| Charts:- Daily , Weekly | |
| Add BFAM to Watchlist: View: Get Complete BFAM Trend Analysis ➞ | |
 | MGM MGM Resorts International |
| Sector: Services & Goods | |
| SubSector: Resorts & Casinos | |
| MarketCap: 5315.04 Millions | |
| Recent Price: 39.75 Smart Investing & Trading Score: 10 | |
| Day Percent Change: 0.79% Day Change: 0.31 | |
| Week Change: -3.26% Year-to-date Change: -11.0% | |
| MGM Links: Profile News Message Board | |
| Charts:- Daily , Weekly | |
| Add MGM to Watchlist: View: Get Complete MGM Trend Analysis ➞ | |
 | ARMK Aramark |
| Sector: Services & Goods | |
| SubSector: Specialty Eateries | |
| MarketCap: 5242.27 Millions | |
| Recent Price: 31.15 Smart Investing & Trading Score: 36 | |
| Day Percent Change: -1.14% Day Change: -0.36 | |
| Week Change: -3.71% Year-to-date Change: 10.9% | |
| ARMK Links: Profile News Message Board | |
| Charts:- Daily , Weekly | |
| Add ARMK to Watchlist: View: Get Complete ARMK Trend Analysis ➞ | |
 | NYT The New York Times Company |
| Sector: Services & Goods | |
| SubSector: Publishing - Newspapers | |
| MarketCap: 5188.22 Millions | |
| Recent Price: 43.33 Smart Investing & Trading Score: 47 | |
| Day Percent Change: 0.70% Day Change: 0.30 | |
| Week Change: 0.37% Year-to-date Change: -11.6% | |
| NYT Links: Profile News Message Board | |
| Charts:- Daily , Weekly | |
| Add NYT to Watchlist: View: Get Complete NYT Trend Analysis ➞ | |
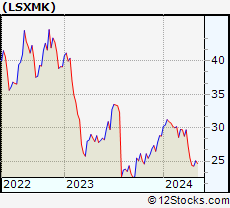 | LSXMK The Liberty SiriusXM Group |
| Sector: Services & Goods | |
| SubSector: Broadcasting - Radio | |
| MarketCap: 5183.95 Millions | |
| Recent Price: 24.63 Smart Investing & Trading Score: 5 | |
| Day Percent Change: 2.37% Day Change: 0.57 | |
| Week Change: 1.48% Year-to-date Change: -14.4% | |
| LSXMK Links: Profile News Message Board | |
| Charts:- Daily , Weekly | |
| Add LSXMK to Watchlist: View: Get Complete LSXMK Trend Analysis ➞ | |
 | EEFT Euronet Worldwide, Inc. |
| Sector: Services & Goods | |
| SubSector: Business Services | |
| MarketCap: 4809.62 Millions | |
| Recent Price: 104.42 Smart Investing & Trading Score: 59 | |
| Day Percent Change: 1.69% Day Change: 1.74 | |
| Week Change: 0.57% Year-to-date Change: 2.9% | |
| EEFT Links: Profile News Message Board | |
| Charts:- Daily , Weekly | |
| Add EEFT to Watchlist: View: Get Complete EEFT Trend Analysis ➞ | |
 | ACM AECOM |
| Sector: Services & Goods | |
| SubSector: Technical Services | |
| MarketCap: 4781.9 Millions | |
| Recent Price: 92.91 Smart Investing & Trading Score: 51 | |
| Day Percent Change: 0.60% Day Change: 0.55 | |
| Week Change: -1.21% Year-to-date Change: 0.5% | |
| ACM Links: Profile News Message Board | |
| Charts:- Daily , Weekly | |
| Add ACM to Watchlist: View: Get Complete ACM Trend Analysis ➞ | |
 | FWONK Formula One Group |
| Sector: Services & Goods | |
| SubSector: Broadcasting - TV | |
| MarketCap: 4677.53 Millions | |
| Recent Price: 70.32 Smart Investing & Trading Score: 54 | |
| Day Percent Change: 0.50% Day Change: 0.35 | |
| Week Change: 1.28% Year-to-date Change: 11.4% | |
| FWONK Links: Profile News Message Board | |
| Charts:- Daily , Weekly | |
| Add FWONK to Watchlist: View: Get Complete FWONK Trend Analysis ➞ | |
 | CZR Caesars Entertainment Corporation |
| Sector: Services & Goods | |
| SubSector: Resorts & Casinos | |
| MarketCap: 4618.44 Millions | |
| Recent Price: 36.39 Smart Investing & Trading Score: 10 | |
| Day Percent Change: 1.59% Day Change: 0.57 | |
| Week Change: -0.6% Year-to-date Change: -22.4% | |
| CZR Links: Profile News Message Board | |
| Charts:- Daily , Weekly | |
| Add CZR to Watchlist: View: Get Complete CZR Trend Analysis ➞ | |
 | CAVA CAVA Group, Inc. |
| Sector: Services & Goods | |
| SubSector: Restaurants | |
| MarketCap: 4510 Millions | |
| Recent Price: 68.01 Smart Investing & Trading Score: 53 | |
| Day Percent Change: -5.46% Day Change: -3.93 | |
| Week Change: -1.66% Year-to-date Change: 56.4% | |
| CAVA Links: Profile News Message Board | |
| Charts:- Daily , Weekly | |
| Add CAVA to Watchlist: View: Get Complete CAVA Trend Analysis ➞ | |
 | DRVN Driven Brands Holdings Inc. |
| Sector: Services & Goods | |
| SubSector: Auto & Truck Dealerships | |
| MarketCap: 4490 Millions | |
| Recent Price: 14.23 Smart Investing & Trading Score: 46 | |
| Day Percent Change: -0.73% Day Change: -0.11 | |
| Week Change: -1.15% Year-to-date Change: -0.8% | |
| DRVN Links: Profile News Message Board | |
| Charts:- Daily , Weekly | |
| Add DRVN to Watchlist: View: Get Complete DRVN Trend Analysis ➞ | |
 | FCN FTI Consulting, Inc. |
| Sector: Services & Goods | |
| SubSector: Management Services | |
| MarketCap: 4485.05 Millions | |
| Recent Price: 212.54 Smart Investing & Trading Score: 66 | |
| Day Percent Change: -0.60% Day Change: -1.29 | |
| Week Change: 0.56% Year-to-date Change: 6.7% | |
| FCN Links: Profile News Message Board | |
| Charts:- Daily , Weekly | |
| Add FCN to Watchlist: View: Get Complete FCN Trend Analysis ➞ | |
 | FYBR Frontier Communications Parent, Inc. |
| Sector: Services & Goods | |
| SubSector: Telecom Services | |
| MarketCap: 4460 Millions | |
| Recent Price: 23.06 Smart Investing & Trading Score: 35 | |
| Day Percent Change: -0.45% Day Change: -0.11 | |
| Week Change: 0.44% Year-to-date Change: -8.6% | |
| FYBR Links: Profile News Message Board | |
| Charts:- Daily , Weekly | |
| Add FYBR to Watchlist: View: Get Complete FYBR Trend Analysis ➞ | |
 | WEX WEX Inc. |
| Sector: Services & Goods | |
| SubSector: Business Services | |
| MarketCap: 4312.22 Millions | |
| Recent Price: 209.41 Smart Investing & Trading Score: 10 | |
| Day Percent Change: -0.88% Day Change: -1.85 | |
| Week Change: -3.31% Year-to-date Change: 7.6% | |
| WEX Links: Profile News Message Board | |
| Charts:- Daily , Weekly | |
| Add WEX to Watchlist: View: Get Complete WEX Trend Analysis ➞ | |
 | RHI Robert Half International Inc. |
| Sector: Services & Goods | |
| SubSector: Staffing & Outsourcing Services | |
| MarketCap: 4302 Millions | |
| Recent Price: 69.25 Smart Investing & Trading Score: 42 | |
| Day Percent Change: 0.16% Day Change: 0.11 | |
| Week Change: -0.14% Year-to-date Change: -21.2% | |
| RHI Links: Profile News Message Board | |
| Charts:- Daily , Weekly | |
| Add RHI to Watchlist: View: Get Complete RHI Trend Analysis ➞ | |
 | ETSY Etsy, Inc. |
| Sector: Services & Goods | |
| SubSector: Specialty Retail, Other | |
| MarketCap: 4263.24 Millions | |
| Recent Price: 69.74 Smart Investing & Trading Score: 67 | |
| Day Percent Change: 1.56% Day Change: 1.07 | |
| Week Change: 3.43% Year-to-date Change: -14.0% | |
| ETSY Links: Profile News Message Board | |
| Charts:- Daily , Weekly | |
| Add ETSY to Watchlist: View: Get Complete ETSY Trend Analysis ➞ | |
 | PLTK Playtika Holding Corp. |
| Sector: Services & Goods | |
| SubSector: Electronic Gaming & Multimedia | |
| MarketCap: 4260 Millions | |
| Recent Price: 7.53 Smart Investing & Trading Score: 100 | |
| Day Percent Change: 3.72% Day Change: 0.27 | |
| Week Change: 5.31% Year-to-date Change: -12.7% | |
| PLTK Links: Profile News Message Board | |
| Charts:- Daily , Weekly | |
| Add PLTK to Watchlist: View: Get Complete PLTK Trend Analysis ➞ | |
| For tabular summary view of above stock list: Summary View ➞ 0 - 25 , 25 - 50 , 50 - 75 , 75 - 100 , 100 - 125 , 125 - 150 | ||
| Click To Change The Sort Order: By Market Cap or Company Size Performance: Year-to-date, Week and Day | |
| Select Chart Type: | ||
|
Best Stocks Today 12Stocks.com |
© 2024 12Stocks.com Terms & Conditions Privacy Contact Us
All Information Provided Only For Education And Not To Be Used For Investing or Trading. See Terms & Conditions


One More Thing ... Get Best Stocks Delivered Daily!
Never Ever Miss A Move With Our Top Ten Stocks Lists
Find Best Stocks In Any Market - Bull or Bear Market
Take A Peek At Our Top Ten Stocks Lists: Daily, Weekly, Year-to-Date & Top Trends
Find Best Stocks In Any Market - Bull or Bear Market
Take A Peek At Our Top Ten Stocks Lists: Daily, Weekly, Year-to-Date & Top Trends
Midcap Stocks With Best Up Trends [0-bearish to 100-bullish]: Bio-Techne [100], Garmin [100], Brookfield Renewable[100], Amcor [100], United [100], Axalta Coating[100], DuPont de[100], Clean Harbors[100], Playtika Holding[100], Voya Financial[100], Tenet [100]
Best Midcap Stocks Year-to-Date:
Vistra Energy[99.53%], AppLovin [76.53%], ShockWave Medical[73%], EMCOR [64.9%], Constellation Energy[57.66%], CAVA [56.42%], Tenet [53.43%], Spotify [51.42%], Natera [50.27%], Wingstop [49.64%], Antero Resources[44%] Best Midcap Stocks This Week:
Tenet [20.62%], Pinterest [19.2%], Bio-Techne [14.64%], New York[14.48%], Garmin [13.92%], Sensata Technologies[11.46%], Brookfield Renewable[10.3%], Woodward [10.09%], Maravai LifeSciences[9.61%], Axalta Coating[9.58%], Amcor [9.25%] Best Midcap Stocks Daily:
New York[28.30%], Pinterest [21.02%], Bio-Techne [16.18%], Garmin [13.12%], Brookfield Renewable[10.63%], Amcor [9.62%], United [8.87%], Axalta Coating[8.81%], DuPont de[8.01%], Verisk Analytics[6.87%], Clean Harbors[6.81%]