
 Login Sign Up


| |||||
 |  | ||||

| 12Stocks.com Market Intelligence |
Best MidCap Stocks
|
| In a hurry? Mid Cap Stocks Lists: Performance Trends Table, Stock Charts
Sort midcap stocks: Daily, Weekly, Year-to-Date, Market Cap & Trends. Filter midcap stocks list by sector: Show all, Tech, Finance, Energy, Staples, Retail, Industrial, Materials, Utilities and HealthCare Filter midcap stocks list by size:All MidCap Large Mid-Range Small |
| 12Stocks.com Mid Cap Stocks Performances & Trends Daily | |||||||||
|
|  The overall Smart Investing & Trading Score is 36 (0-bearish to 100-bullish) which puts Mid Cap index in short term bearish to neutral trend. The Smart Investing & Trading Score from previous trading session is 26 and hence an improvement of trend.
| ||||||||
Here are the Smart Investing & Trading Scores of the most requested mid cap stocks at 12Stocks.com (click stock name for detailed review):
|


| 12Stocks.com: Top Performing Mid Cap Index Stocks | ||||||||||||||||||||||||||||||||||||||||||||||||
 The top performing Mid Cap Index stocks year to date are
Now, more recently, over last week, the top performing Mid Cap Index stocks on the move are


|
||||||||||||||||||||||||||||||||||||||||||||||||
| 12Stocks.com: Investing in Midcap Index with Stocks | |
|
The following table helps investors and traders sort through current performance and trends (as measured by Smart Investing & Trading Score) of various
stocks in the Midcap Index. Quick View: Move mouse or cursor over stock symbol (ticker) to view short-term technical chart and over stock name to view long term chart. Click on  to add stock symbol to your watchlist and to add stock symbol to your watchlist and  to view watchlist. Click on any ticker or stock name for detailed market intelligence report for that stock. to view watchlist. Click on any ticker or stock name for detailed market intelligence report for that stock. |
12Stocks.com Performance of Stocks in Midcap Index
| Ticker | Stock Name | Watchlist | Category | Recent Price | Smart Investing & Trading Score | Change % | YTD Change% |
| FOXA | Fox |   | Services & Goods | 30.74 | 47 | 0.92% | 3.61% |
| QS | QuantumScape | | Services & Goods | 5.57 | 30 | 0.09% | -19.93% |
| LCID | Lucid | | Services & Goods | 2.46 | 42 | 1.23% | -41.08% |
| ROL | Rollins | | Services & Goods | 42.45 | 0 | -1.29% | -2.78% |
| GWW | W.W. Grainger | | Services & Goods | 937.63 | 36 | -1.29% | 13.15% |
| DPZ | Domino s | | Services & Goods | 481.10 | 36 | -0.20% | 16.71% |
| OMC | Omnicom | | Services & Goods | 92.15 | 68 | -0.32% | 6.52% |
| CCL | Carnival | | Services & Goods | 14.28 | 32 | 1.13% | -22.98% |
| TRU | TransUnion | | Services & Goods | 67.52 | 23 | -3.03% | -1.73% |
| TW | Tradeweb Markets | | Services & Goods | 100.90 | 51 | 0.59% | 11.03% |
| BURL | Burlington Stores | | Services & Goods | 179.46 | 10 | -0.25% | -7.72% |
| J | Jacobs Engineering | | Services & Goods | 143.26 | 41 | 0.20% | 10.37% |
| TSCO | Tractor Supply | | Services & Goods | 246.80 | 68 | -0.24% | 14.77% |
| ULTA | Ulta Beauty | | Services & Goods | 426.06 | 10 | 0.36% | -13.05% |
| BAH | Booz Allen | | Services & Goods | 139.53 | 0 | -0.52% | 9.08% |
| QGEN | QIAGEN N.V | | Services & Goods | 39.23 | 10 | -0.01% | -9.68% |
| GPC | Genuine Parts | | Services & Goods | 161.45 | 100 | 12.06% | 16.57% |
| ALLE | Allegion | | Services & Goods | 124.82 | 23 | -0.76% | -1.48% |
| LYV | Live Nation | | Services & Goods | 90.24 | 26 | -1.72% | -3.59% |
| KMX | CarMax | | Services & Goods | 67.86 | 10 | -0.98% | -11.57% |
| EXPE | Expedia | | Services & Goods | 128.04 | 8 | -0.54% | -15.65% |
| RCL | Royal Caribbean | | Services & Goods | 127.50 | 25 | -0.37% | -1.54% |
| SCI | Service | | Services & Goods | 68.10 | 36 | -0.60% | -0.51% |
| HSIC | Henry Schein | | Services & Goods | 69.70 | 0 | -0.71% | -7.94% |
| WYNN | Wynn Resorts | | Services & Goods | 96.06 | 26 | -1.46% | 5.43% |
| For chart view version of above stock list: Chart View ➞ 0 - 25 , 25 - 50 , 50 - 75 , 75 - 100 , 100 - 125 , 125 - 150 | ||
 | Click To Change The Sort Order: By Market Cap or Company Size Performance: Year-to-date, Week and Day |  |
|
Get the most comprehensive stock market coverage daily at 12Stocks.com ➞ Best Stocks Today ➞ Best Stocks Weekly ➞ Best Stocks Year-to-Date ➞ Best Stocks Trends ➞  Best Stocks Today 12Stocks.com Best Nasdaq Stocks ➞ Best S&P 500 Stocks ➞ Best Tech Stocks ➞ Best Biotech Stocks ➞ |
| Detailed Overview of Midcap Stocks |
| Midcap Technical Overview, Leaders & Laggards, Top Midcap ETF Funds & Detailed Midcap Stocks List, Charts, Trends & More |
| Midcap: Technical Analysis, Trends & YTD Performance | |
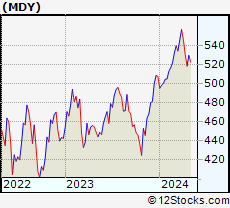
| MidCap segment as represented by
MDY, an exchange-traded fund [ETF], holds basket of about four hundred midcap stocks from across all major sectors of the US stock market. The midcap index (contains stocks like Green Mountain Coffee Roasters and Tractor Supply Company) is up by 1.74% and is currently underperforming the overall market by -2.29% year-to-date. Below is a quick view of technical charts and trends: | |
 MDY Weekly Chart |
|
| Long Term Trend: Good | |
| Medium Term Trend: Not Good | |
 MDY Daily Chart |
|
| Short Term Trend: Not Good | |
| Overall Trend Score: 36 | |
| YTD Performance: 1.74% | |
| **Trend Scores & Views Are Only For Educational Purposes And Not For Investing | |
| 12Stocks.com: Investing in Midcap Index using Exchange Traded Funds | |
|
The following table shows list of key exchange traded funds (ETF) that
help investors track Midcap index. The following list also includes leveraged ETF funds that track twice or thrice the daily returns of Midcap indices. Short or inverse ETF funds move in the opposite direction to the index they track and are useful during market pullbacks or during bear markets. Quick View: Move mouse or cursor over ETF symbol (ticker) to view short-term technical chart and over ETF name to view long term chart. Click on ticker or stock name for detailed view. Click on to add stock symbol to your watchlist and to view watchlist. |
12Stocks.com List of ETFs that track Midcap Index
| Ticker | ETF Name | Watchlist | Recent Price | Smart Investing & Trading Score | Change % | Week % | Year-to-date % |
| IJH | iShares Core S&P Mid-Cap | | 56.38 | 41 | -0.24 | -2.62 | 1.7% |
| IWR | iShares Russell Mid-Cap | | 78.60 | 36 | -0.28 | -2.51 | 1.12% |
| MDY | SPDR S&P MidCap 400 ETF | | 516.21 | 36 | -0.20 | -2.59 | 1.74% |
| IWP | iShares Russell Mid-Cap Growth | | 106.30 | 36 | -0.67 | -3.22 | 1.76% |
| IWS | iShares Russell Mid-Cap Value | | 117.10 | 41 | -0.26 | -2.33 | 0.7% |
| IJK | iShares S&P Mid-Cap 400 Growth | | 84.83 | 41 | -0.60 | -3.03 | 7.08% |
| IJJ | iShares S&P Mid-Cap 400 Value | | 109.20 | 23 | -0.22 | -2.49 | -4.24% |
| XMLV | PowerShares S&P MidCap Low Volatil ETF | | 53.52 | 54 | 0.29 | -1.34 | 0.65% |
| UMDD | ProShares UltraPro MidCap400 | | 22.16 | 36 | -1.31 | -8.34 | -0.74% |
| MVV | ProShares Ultra MidCap400 | | 58.42 | 36 | -0.70 | -5.36 | 0.92% |
| SMDD | ProShares UltraPro Short MidCap400 | | 12.75 | 64 | 1.67 | 8.51 | -5.3% |
| MYY | ProShares Short MidCap400 | | 21.11 | 69 | -0.50 | 1.95 | -1.63% |
| MZZ | ProShares UltraShort MidCap400 | | 12.15 | 34 | 0.70 | 4.73 | -3.35% |
| 12Stocks.com: Charts, Trends, Fundamental Data and Performances of MidCap Stocks | |
|
We now take in-depth look at all MidCap stocks including charts, multi-period performances and overall trends (as measured by Smart Investing & Trading Score). One can sort MidCap stocks (click link to choose) by Daily, Weekly and by Year-to-Date performances. Also, one can sort by size of the company or by market capitalization. |
| Select Your Default Chart Type: | |||||
| |||||
| Click on stock symbol or name for detailed view. Click on to add stock symbol to your watchlist and to view watchlist. Quick View: Move mouse or cursor over "Daily" to quickly view daily technical stock chart and over "Weekly" to view weekly technical stock chart. | |||||

 | FOXA Fox Corporation |
| Sector: Services & Goods | |
| SubSector: Entertainment - Diversified | |
| MarketCap: 13440.7 Millions | |
| Recent Price: 30.74 Smart Investing & Trading Score: 47 | |
| Day Percent Change: 0.92% Day Change: 0.28 | |
| Week Change: 0% Year-to-date Change: 3.6% | |
| FOXA Links: Profile News Message Board | |
| Charts:- Daily , Weekly | |
| Add FOXA to Watchlist: View: Get Complete FOXA Trend Analysis ➞ | |
 | QS QuantumScape Corporation |
| Sector: Services & Goods | |
| SubSector: Auto Parts | |
| MarketCap: 13137 Millions | |
| Recent Price: 5.57 Smart Investing & Trading Score: 30 | |
| Day Percent Change: 0.09% Day Change: 0.01 | |
| Week Change: -4.22% Year-to-date Change: -19.9% | |
| QS Links: Profile News Message Board | |
| Charts:- Daily , Weekly | |
| Add QS to Watchlist: View: Get Complete QS Trend Analysis ➞ | |
 | LCID Lucid Group, Inc. |
| Sector: Services & Goods | |
| SubSector: Auto Manufacturers | |
| MarketCap: 12910 Millions | |
| Recent Price: 2.46 Smart Investing & Trading Score: 42 | |
| Day Percent Change: 1.23% Day Change: 0.03 | |
| Week Change: -1.2% Year-to-date Change: -41.1% | |
| LCID Links: Profile News Message Board | |
| Charts:- Daily , Weekly | |
| Add LCID to Watchlist: View: Get Complete LCID Trend Analysis ➞ | |
 | ROL Rollins, Inc. |
| Sector: Services & Goods | |
| SubSector: Business Services | |
| MarketCap: 12827.4 Millions | |
| Recent Price: 42.45 Smart Investing & Trading Score: 0 | |
| Day Percent Change: -1.29% Day Change: -0.55 | |
| Week Change: -4.27% Year-to-date Change: -2.8% | |
| ROL Links: Profile News Message Board | |
| Charts:- Daily , Weekly | |
| Add ROL to Watchlist: View: Get Complete ROL Trend Analysis ➞ | |
 | GWW W.W. Grainger, Inc. |
| Sector: Services & Goods | |
| SubSector: Industrial Equipment Wholesale | |
| MarketCap: 12794.8 Millions | |
| Recent Price: 937.63 Smart Investing & Trading Score: 36 | |
| Day Percent Change: -1.29% Day Change: -12.29 | |
| Week Change: -2.83% Year-to-date Change: 13.2% | |
| GWW Links: Profile News Message Board | |
| Charts:- Daily , Weekly | |
| Add GWW to Watchlist: View: Get Complete GWW Trend Analysis ➞ | |
 | DPZ Domino s Pizza, Inc. |
| Sector: Services & Goods | |
| SubSector: Restaurants | |
| MarketCap: 12166 Millions | |
| Recent Price: 481.10 Smart Investing & Trading Score: 36 | |
| Day Percent Change: -0.20% Day Change: -0.95 | |
| Week Change: -2.87% Year-to-date Change: 16.7% | |
| DPZ Links: Profile News Message Board | |
| Charts:- Daily , Weekly | |
| Add DPZ to Watchlist: View: Get Complete DPZ Trend Analysis ➞ | |
 | OMC Omnicom Group Inc. |
| Sector: Services & Goods | |
| SubSector: Advertising Agencies | |
| MarketCap: 11813.5 Millions | |
| Recent Price: 92.15 Smart Investing & Trading Score: 68 | |
| Day Percent Change: -0.32% Day Change: -0.30 | |
| Week Change: 1.72% Year-to-date Change: 6.5% | |
| OMC Links: Profile News Message Board | |
| Charts:- Daily , Weekly | |
| Add OMC to Watchlist: View: Get Complete OMC Trend Analysis ➞ | |
 | CCL Carnival Corporation & Plc |
| Sector: Services & Goods | |
| SubSector: Resorts & Casinos | |
| MarketCap: 11725.4 Millions | |
| Recent Price: 14.28 Smart Investing & Trading Score: 32 | |
| Day Percent Change: 1.13% Day Change: 0.16 | |
| Week Change: -0.56% Year-to-date Change: -23.0% | |
| CCL Links: Profile News Message Board | |
| Charts:- Daily , Weekly | |
| Add CCL to Watchlist: View: Get Complete CCL Trend Analysis ➞ | |
 | TRU TransUnion |
| Sector: Services & Goods | |
| SubSector: Business Services | |
| MarketCap: 11457.2 Millions | |
| Recent Price: 67.52 Smart Investing & Trading Score: 23 | |
| Day Percent Change: -3.03% Day Change: -2.11 | |
| Week Change: -8.22% Year-to-date Change: -1.7% | |
| TRU Links: Profile News Message Board | |
| Charts:- Daily , Weekly | |
| Add TRU to Watchlist: View: Get Complete TRU Trend Analysis ➞ | |
 | TW Tradeweb Markets Inc. |
| Sector: Services & Goods | |
| SubSector: Management Services | |
| MarketCap: 9913.35 Millions | |
| Recent Price: 100.90 Smart Investing & Trading Score: 51 | |
| Day Percent Change: 0.59% Day Change: 0.59 | |
| Week Change: -1.2% Year-to-date Change: 11.0% | |
| TW Links: Profile News Message Board | |
| Charts:- Daily , Weekly | |
| Add TW to Watchlist: View: Get Complete TW Trend Analysis ➞ | |
 | BURL Burlington Stores, Inc. |
| Sector: Services & Goods | |
| SubSector: Discount, Variety Stores | |
| MarketCap: 9801.42 Millions | |
| Recent Price: 179.46 Smart Investing & Trading Score: 10 | |
| Day Percent Change: -0.25% Day Change: -0.45 | |
| Week Change: -5.6% Year-to-date Change: -7.7% | |
| BURL Links: Profile News Message Board | |
| Charts:- Daily , Weekly | |
| Add BURL to Watchlist: View: Get Complete BURL Trend Analysis ➞ | |
 | J Jacobs Engineering Group Inc. |
| Sector: Services & Goods | |
| SubSector: Technical Services | |
| MarketCap: 9714.8 Millions | |
| Recent Price: 143.26 Smart Investing & Trading Score: 41 | |
| Day Percent Change: 0.20% Day Change: 0.28 | |
| Week Change: -0.96% Year-to-date Change: 10.4% | |
| J Links: Profile News Message Board | |
| Charts:- Daily , Weekly | |
| Add J to Watchlist: View: Get Complete J Trend Analysis ➞ | |
 | TSCO Tractor Supply Company |
| Sector: Services & Goods | |
| SubSector: Specialty Retail, Other | |
| MarketCap: 9692.94 Millions | |
| Recent Price: 246.80 Smart Investing & Trading Score: 68 | |
| Day Percent Change: -0.24% Day Change: -0.59 | |
| Week Change: 0.78% Year-to-date Change: 14.8% | |
| TSCO Links: Profile News Message Board | |
| Charts:- Daily , Weekly | |
| Add TSCO to Watchlist: View: Get Complete TSCO Trend Analysis ➞ | |
 | ULTA Ulta Beauty, Inc. |
| Sector: Services & Goods | |
| SubSector: Specialty Retail, Other | |
| MarketCap: 9429.94 Millions | |
| Recent Price: 426.06 Smart Investing & Trading Score: 10 | |
| Day Percent Change: 0.36% Day Change: 1.51 | |
| Week Change: -3.68% Year-to-date Change: -13.1% | |
| ULTA Links: Profile News Message Board | |
| Charts:- Daily , Weekly | |
| Add ULTA to Watchlist: View: Get Complete ULTA Trend Analysis ➞ | |
 | BAH Booz Allen Hamilton Holding Corporation |
| Sector: Services & Goods | |
| SubSector: Management Services | |
| MarketCap: 9037.35 Millions | |
| Recent Price: 139.53 Smart Investing & Trading Score: 0 | |
| Day Percent Change: -0.52% Day Change: -0.73 | |
| Week Change: -3.16% Year-to-date Change: 9.1% | |
| BAH Links: Profile News Message Board | |
| Charts:- Daily , Weekly | |
| Add BAH to Watchlist: View: Get Complete BAH Trend Analysis ➞ | |
 | QGEN QIAGEN N.V. |
| Sector: Services & Goods | |
| SubSector: Research Services | |
| MarketCap: 8698.94 Millions | |
| Recent Price: 39.23 Smart Investing & Trading Score: 10 | |
| Day Percent Change: -0.01% Day Change: 0.00 | |
| Week Change: -2.38% Year-to-date Change: -9.7% | |
| QGEN Links: Profile News Message Board | |
| Charts:- Daily , Weekly | |
| Add QGEN to Watchlist: View: Get Complete QGEN Trend Analysis ➞ | |
 | GPC Genuine Parts Company |
| Sector: Services & Goods | |
| SubSector: Auto Parts Stores | |
| MarketCap: 8605.9 Millions | |
| Recent Price: 161.45 Smart Investing & Trading Score: 100 | |
| Day Percent Change: 12.06% Day Change: 17.38 | |
| Week Change: 11.05% Year-to-date Change: 16.6% | |
| GPC Links: Profile News Message Board | |
| Charts:- Daily , Weekly | |
| Add GPC to Watchlist: View: Get Complete GPC Trend Analysis ➞ | |
 | ALLE Allegion plc |
| Sector: Services & Goods | |
| SubSector: Security & Protection Services | |
| MarketCap: 8515.93 Millions | |
| Recent Price: 124.82 Smart Investing & Trading Score: 23 | |
| Day Percent Change: -0.76% Day Change: -0.96 | |
| Week Change: -2.04% Year-to-date Change: -1.5% | |
| ALLE Links: Profile News Message Board | |
| Charts:- Daily , Weekly | |
| Add ALLE to Watchlist: View: Get Complete ALLE Trend Analysis ➞ | |
 | LYV Live Nation Entertainment, Inc. |
| Sector: Services & Goods | |
| SubSector: Entertainment - Diversified | |
| MarketCap: 8457.17 Millions | |
| Recent Price: 90.24 Smart Investing & Trading Score: 26 | |
| Day Percent Change: -1.72% Day Change: -1.58 | |
| Week Change: -10.69% Year-to-date Change: -3.6% | |
| LYV Links: Profile News Message Board | |
| Charts:- Daily , Weekly | |
| Add LYV to Watchlist: View: Get Complete LYV Trend Analysis ➞ | |
 | KMX CarMax, Inc. |
| Sector: Services & Goods | |
| SubSector: Auto Dealerships | |
| MarketCap: 8121.71 Millions | |
| Recent Price: 67.86 Smart Investing & Trading Score: 10 | |
| Day Percent Change: -0.98% Day Change: -0.67 | |
| Week Change: -4.97% Year-to-date Change: -11.6% | |
| KMX Links: Profile News Message Board | |
| Charts:- Daily , Weekly | |
| Add KMX to Watchlist: View: Get Complete KMX Trend Analysis ➞ | |
 | EXPE Expedia Group, Inc. |
| Sector: Services & Goods | |
| SubSector: Lodging | |
| MarketCap: 8052.96 Millions | |
| Recent Price: 128.04 Smart Investing & Trading Score: 8 | |
| Day Percent Change: -0.54% Day Change: -0.69 | |
| Week Change: -3.89% Year-to-date Change: -15.7% | |
| EXPE Links: Profile News Message Board | |
| Charts:- Daily , Weekly | |
| Add EXPE to Watchlist: View: Get Complete EXPE Trend Analysis ➞ | |
 | RCL Royal Caribbean Cruises Ltd. |
| Sector: Services & Goods | |
| SubSector: Resorts & Casinos | |
| MarketCap: 7294.14 Millions | |
| Recent Price: 127.50 Smart Investing & Trading Score: 25 | |
| Day Percent Change: -0.37% Day Change: -0.47 | |
| Week Change: -0.13% Year-to-date Change: -1.5% | |
| RCL Links: Profile News Message Board | |
| Charts:- Daily , Weekly | |
| Add RCL to Watchlist: View: Get Complete RCL Trend Analysis ➞ | |
 | SCI Service Corporation International |
| Sector: Services & Goods | |
| SubSector: Personal Services | |
| MarketCap: 7216.05 Millions | |
| Recent Price: 68.10 Smart Investing & Trading Score: 36 | |
| Day Percent Change: -0.60% Day Change: -0.41 | |
| Week Change: -2.45% Year-to-date Change: -0.5% | |
| SCI Links: Profile News Message Board | |
| Charts:- Daily , Weekly | |
| Add SCI to Watchlist: View: Get Complete SCI Trend Analysis ➞ | |
 | HSIC Henry Schein, Inc. |
| Sector: Services & Goods | |
| SubSector: Medical Equipment Wholesale | |
| MarketCap: 6760.9 Millions | |
| Recent Price: 69.70 Smart Investing & Trading Score: 0 | |
| Day Percent Change: -0.71% Day Change: -0.50 | |
| Week Change: -1.84% Year-to-date Change: -7.9% | |
| HSIC Links: Profile News Message Board | |
| Charts:- Daily , Weekly | |
| Add HSIC to Watchlist: View: Get Complete HSIC Trend Analysis ➞ | |
 | WYNN Wynn Resorts, Limited |
| Sector: Services & Goods | |
| SubSector: Resorts & Casinos | |
| MarketCap: 6643.34 Millions | |
| Recent Price: 96.06 Smart Investing & Trading Score: 26 | |
| Day Percent Change: -1.46% Day Change: -1.42 | |
| Week Change: -5.06% Year-to-date Change: 5.4% | |
| WYNN Links: Profile News Message Board | |
| Charts:- Daily , Weekly | |
| Add WYNN to Watchlist: View: Get Complete WYNN Trend Analysis ➞ | |
| For tabular summary view of above stock list: Summary View ➞ 0 - 25 , 25 - 50 , 50 - 75 , 75 - 100 , 100 - 125 , 125 - 150 | ||
| Click To Change The Sort Order: By Market Cap or Company Size Performance: Year-to-date, Week and Day | |
| Select Chart Type: | ||
|
Best Stocks Today 12Stocks.com |
© 2024 12Stocks.com Terms & Conditions Privacy Contact Us
All Information Provided Only For Education And Not To Be Used For Investing or Trading. See Terms & Conditions


One More Thing ... Get Best Stocks Delivered Daily!
Never Ever Miss A Move With Our Top Ten Stocks Lists
Find Best Stocks In Any Market - Bull or Bear Market
Take A Peek At Our Top Ten Stocks Lists: Daily, Weekly, Year-to-Date & Top Trends
Find Best Stocks In Any Market - Bull or Bear Market
Take A Peek At Our Top Ten Stocks Lists: Daily, Weekly, Year-to-Date & Top Trends
Midcap Stocks With Best Up Trends [0-bearish to 100-bullish]: Genuine Parts[100], United Airlines[100], Alaska Air[100], Medical Properties[100], HEICO [100], Generac [93], Bunge [93], Flowers Foods[93], Pilgrim s[90], Coupang [90], DT Midstream[88]
Best Midcap Stocks Year-to-Date:
AppLovin [77.99%], ShockWave Medical[71.87%], Vistra Energy[70.53%], Constellation Energy[59.78%], EMCOR [55.86%], Spotify [54.88%], Pure Storage[44.7%], CAVA [44.09%], Natera [40.32%], Wingstop [39.48%], Williams-Sonoma [39.1%] Best Midcap Stocks This Week:
Medical Properties[23.68%], United Airlines[22.68%], Globe Life[11.66%], Genuine Parts[11.05%], AMC Entertainment[10.38%], Advance Auto[8.55%], Alaska Air[8.28%], Iridium [7.36%], American Airlines[7.22%], agilon health[5.96%], Flowers Foods[5.66%] Best Midcap Stocks Daily:
Genuine Parts[12.06%], Iridium [7.18%], Ally Financial[6.98%], Manpower [6.56%], Coinbase Global[5.90%], United Airlines[5.21%], Ginkgo Bioworks[5.13%], agilon health[4.69%], Alaska Air[4.68%], Globe Life[4.35%], Rocket [4.17%]