
 Login Sign Up


| |||||
 |  | ||||

| 12Stocks.com Market Intelligence |
Best MidCap Stocks
|
| In a hurry? Mid Cap Stocks Lists: Performance Trends Table, Stock Charts
Sort midcap stocks: Daily, Weekly, Year-to-Date, Market Cap & Trends. Filter midcap stocks list by sector: Show all, Tech, Finance, Energy, Staples, Retail, Industrial, Materials, Utilities and HealthCare Filter midcap stocks list by size:All MidCap Large Mid-Range Small |
| 12Stocks.com Mid Cap Stocks Performances & Trends Daily | |||||||||
|
|  The overall Smart Investing & Trading Score is 100 (0-bearish to 100-bullish) which puts Mid Cap index in short term bullish trend. The Smart Investing & Trading Score from previous trading session is 60 and hence an improvement of trend.
| ||||||||
Here are the Smart Investing & Trading Scores of the most requested mid cap stocks at 12Stocks.com (click stock name for detailed review):
|


| 12Stocks.com: Top Performing Mid Cap Index Stocks | ||||||||||||||||||||||||||||||||||||||||||||||||
 The top performing Mid Cap Index stocks year to date are
Now, more recently, over last week, the top performing Mid Cap Index stocks on the move are


|
||||||||||||||||||||||||||||||||||||||||||||||||
| 12Stocks.com: Investing in Midcap Index with Stocks | |
|
The following table helps investors and traders sort through current performance and trends (as measured by Smart Investing & Trading Score) of various
stocks in the Midcap Index. Quick View: Move mouse or cursor over stock symbol (ticker) to view short-term technical chart and over stock name to view long term chart. Click on  to add stock symbol to your watchlist and to add stock symbol to your watchlist and  to view watchlist. Click on any ticker or stock name for detailed market intelligence report for that stock. to view watchlist. Click on any ticker or stock name for detailed market intelligence report for that stock. |
12Stocks.com Performance of Stocks in Midcap Index
| Ticker | Stock Name | Watchlist | Category | Recent Price | Smart Investing & Trading Score | Change % | YTD Change% |
| NFE | New Fortress |   | Utilities | 2.46 | 40 | 6.67 | -84.13% |
| TROW | T. Rowe | | Financials | 111.64 | 100 | 5.95 | -1.86% |
| M | Macy s | | Services & Goods | 17.24 | 100 | 5.90 | 13.89% |
| WDC | Western Digital | | Technology | 89.97 | 100 | 4.62 | 83.10% |
| BLDR | Builders FirstSource | | Industrials | 142.62 | 90 | 4.61 | -14.74% |
| HAL | Halliburton | | Energy | 22.47 | 50 | 4.08 | -12.30% |
| APLS | Apellis | | Health Care | 27.57 | 80 | 3.91 | -13.44% |
| IPGP | IPG Photonics | | Technology | 81.82 | 80 | 3.83 | 8.11% |
| KSS | Kohl s | | Services & Goods | 16.42 | 90 | 3.60 | 27.85% |
| SOFI | SoFi Technologies | | Financials | 25.54 | 70 | 3.60 | 51.49% |
| TNDM | Tandem Diabetes | | Health Care | 12.51 | 40 | 3.46 | -69.32% |
| PHM | Pulte | | Industrials | 137.9 | 100 | 3.45 | 21.72% |
| GPC | Genuine Parts | | Services & Goods | 140.89 | 100 | 3.39 | 23.20% |
| ENTG | Entegris | | Technology | 83.74 | 20 | 3.37 | -16.85% |
| DAR | Darling Ingredients | | Industrials | 33.96 | 20 | 3.31 | -5.55% |
| DXCM | DexCom | | Health Care | 81.44 | 50 | 3.19 | -6.21% |
| MHK | Mohawk Industries | | Consumer Staples | 134.68 | 100 | 3.14 | 10.12% |
| CPRT | Copart | | Services & Goods | 49.62 | 90 | 3.12 | -14.34% |
| RGLD | Royal Gold | | Materials | 179.58 | 100 | 2.97 | 33.68% |
| APA | Apache | | Energy | 23.34 | 80 | 2.91 | 9.65% |
| BKR | Baker Hughes | | Services & Goods | 46.29 | 100 | 2.87 | 1.90% |
| SSRM | SSR Mining | | Materials | 19.31 | 100 | 2.86 | 143.10% |
| WAT | Waters | | Health Care | 298.29 | 60 | 2.84 | -28.21% |
| CE | Celanese | | Materials | 45.9 | 40 | 2.82 | -35.27% |
| HXL | Hexcel | | Industrials | 63.15 | 100 | 2.77 | 0.43% |
| For chart view version of above stock list: Chart View ➞ 0 - 25 , 25 - 50 , 50 - 75 , 75 - 100 , 100 - 125 , 125 - 150 , 150 - 175 , 175 - 200 , 200 - 225 , 225 - 250 , 250 - 275 , 275 - 300 , 300 - 325 , 325 - 350 , 350 - 375 , 375 - 400 , 400 - 425 , 425 - 450 , 450 - 475 , 475 - 500 , 500 - 525 , 525 - 550 , 550 - 575 , 575 - 600 , 600 - 625 , 625 - 650 , 650 - 675 , 675 - 700 , 700 - 725 , 725 - 750 | ||
 | Click To Change The Sort Order: By Market Cap or Company Size Performance: Year-to-date, Week and Day |  |
|
Get the most comprehensive stock market coverage daily at 12Stocks.com ➞ Best Stocks Today ➞ Best Stocks Weekly ➞ Best Stocks Year-to-Date ➞ Best Stocks Trends ➞  Best Stocks Today 12Stocks.com Best Nasdaq Stocks ➞ Best S&P 500 Stocks ➞ Best Tech Stocks ➞ Best Biotech Stocks ➞ |
| Detailed Overview of Midcap Stocks |
| Midcap Technical Overview, Leaders & Laggards, Top Midcap ETF Funds & Detailed Midcap Stocks List, Charts, Trends & More |
| Midcap: Technical Analysis, Trends & YTD Performance | |
| MidCap segment as represented by
MDY, an exchange-traded fund [ETF], holds basket of about four hundred midcap stocks from across all major sectors of the US stock market. The midcap index (contains stocks like Green Mountain Coffee Roasters and Tractor Supply Company) is up by 2.17% and is currently underperforming the overall market by -5.75% year-to-date. Below is a quick view of technical charts and trends: | |
 MDY Weekly Chart |
|
| Long Term Trend: Very Good | |
| Medium Term Trend: Very Good | |
 MDY Daily Chart |
|
| Short Term Trend: Very Good | |
| Overall Trend Score: 100 | |
| YTD Performance: 2.17% | |
| **Trend Scores & Views Are Only For Educational Purposes And Not For Investing | |
| 12Stocks.com: Investing in Midcap Index using Exchange Traded Funds | |
|
The following table shows list of key exchange traded funds (ETF) that
help investors track Midcap index. The following list also includes leveraged ETF funds that track twice or thrice the daily returns of Midcap indices. Short or inverse ETF funds move in the opposite direction to the index they track and are useful during market pullbacks or during bear markets. Quick View: Move mouse or cursor over ETF symbol (ticker) to view short-term technical chart and over ETF name to view long term chart. Click on ticker or stock name for detailed view. Click on to add stock symbol to your watchlist and to view watchlist. |
12Stocks.com List of ETFs that track Midcap Index
| Ticker | ETF Name | Watchlist | Recent Price | Smart Investing & Trading Score | Change % | Week % | Year-to-date % |
| IJH | iShares Core S&P Mid-Cap | | 65.16 | 100 | -0.16 | -0.66 | 2.43% |
| IWP | iShares Russell Mid-Cap Growth | | 142.91 | 90 | -0.27 | -0.38 | 10.06% |
| IWR | iShares Russell Mid-Cap | | 96.06 | 90 | -0.23 | -0.42 | 6.99% |
| MDY | SPDR S&P MidCap 400 ETF | | 600.07 | 100 | 1.45 | 0.82 | 2.17% |
| IWS | iShares Russell Mid-Cap Value | | 138.59 | 90 | -0.26 | -0.48 | 5.79% |
| IJK | iShares S&P Mid-Cap 400 Growth | | 95.11 | 100 | -0.05 | -0.79 | 2.49% |
| IJJ | iShares S&P Mid-Cap 400 Value | | 130.39 | 100 | -0.12 | -0.36 | 2.26% |
| XMLV | PowerShares S&P MidCap Low Volatil ETF | | 63.98 | 70 | -0.09 | 0.49 | 5.47% |
| SMDD | ProShares UltraPro Short MidCap400 | | 13.48 | 10 | -8.74 | -8.32 | -15.52% |
| MVV | ProShares Ultra MidCap400 | | 69.03 | 100 | -0.21 | -1.49 | -3% |
| UMDD | ProShares UltraPro MidCap400 | | 25.54 | 90 | 8.21 | 7.41 | -12.48% |
| MYY | ProShares Short MidCap400 | | 18.02 | 0 | -2.72 | -2.55 | -0.57% |
| MZZ | ProShares UltraShort MidCap400 | | 8.40 | 10 | -5.71 | -5.39 | -6.57% |
| 12Stocks.com: Charts, Trends, Fundamental Data and Performances of MidCap Stocks | |
|
We now take in-depth look at all MidCap stocks including charts, multi-period performances and overall trends (as measured by Smart Investing & Trading Score). One can sort MidCap stocks (click link to choose) by Daily, Weekly and by Year-to-Date performances. Also, one can sort by size of the company or by market capitalization. |
| Select Your Default Chart Type: | |||||
| |||||
| Click on stock symbol or name for detailed view. Click on to add stock symbol to your watchlist and to view watchlist. Quick View: Move mouse or cursor over "Daily" to quickly view daily technical stock chart and over "Weekly" to view weekly technical stock chart. | |||||

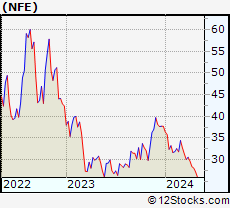 | NFE New Fortress Energy LLC |
| Sector: Utilities | |
| SubSector: Gas Utilities | |
| MarketCap: 1533.87 Millions | |
| Recent Price: 2.46 Smart Investing & Trading Score: 40 | |
| Day Percent Change: 6.67% Day Change: 0.15 | |
| Week Change: 0.42% Year-to-date Change: -84.1% | |
| NFE Links: Profile News Message Board | |
| Charts:- Daily , Weekly | |
| Add NFE to Watchlist: View: Get Complete NFE Trend Analysis ➞ | |
 | TROW T. Rowe Price Group, Inc. |
| Sector: Financials | |
| SubSector: Asset Management | |
| MarketCap: 24530 Millions | |
| Recent Price: 111.64 Smart Investing & Trading Score: 100 | |
| Day Percent Change: 5.95% Day Change: 6.27 | |
| Week Change: 3.74% Year-to-date Change: -1.9% | |
| TROW Links: Profile News Message Board | |
| Charts:- Daily , Weekly | |
| Add TROW to Watchlist: View: Get Complete TROW Trend Analysis ➞ | |
 | M Macy s, Inc. |
| Sector: Services & Goods | |
| SubSector: Department Stores | |
| MarketCap: 2391.72 Millions | |
| Recent Price: 17.24 Smart Investing & Trading Score: 100 | |
| Day Percent Change: 5.9% Day Change: 0.96 | |
| Week Change: 30.31% Year-to-date Change: 13.9% | |
| M Links: Profile News Message Board | |
| Charts:- Daily , Weekly | |
| Add M to Watchlist: View: Get Complete M Trend Analysis ➞ | |
 | WDC Western Digital Corporation |
| Sector: Technology | |
| SubSector: Data Storage Devices | |
| MarketCap: 10712.9 Millions | |
| Recent Price: 89.97 Smart Investing & Trading Score: 100 | |
| Day Percent Change: 4.62% Day Change: 3.97 | |
| Week Change: 11.99% Year-to-date Change: 83.1% | |
| WDC Links: Profile News Message Board | |
| Charts:- Daily , Weekly | |
| Add WDC to Watchlist: View: Get Complete WDC Trend Analysis ➞ | |
 | BLDR Builders FirstSource, Inc. |
| Sector: Industrials | |
| SubSector: General Building Materials | |
| MarketCap: 1714.63 Millions | |
| Recent Price: 142.62 Smart Investing & Trading Score: 90 | |
| Day Percent Change: 4.61% Day Change: 6.29 | |
| Week Change: 2.84% Year-to-date Change: -14.7% | |
| BLDR Links: Profile News Message Board | |
| Charts:- Daily , Weekly | |
| Add BLDR to Watchlist: View: Get Complete BLDR Trend Analysis ➞ | |
 | HAL Halliburton Company |
| Sector: Energy | |
| SubSector: Oil & Gas Equipment & Services | |
| MarketCap: 5419.41 Millions | |
| Recent Price: 22.47 Smart Investing & Trading Score: 50 | |
| Day Percent Change: 4.08% Day Change: 0.88 | |
| Week Change: -1.14% Year-to-date Change: -12.3% | |
| HAL Links: Profile News Message Board | |
| Charts:- Daily , Weekly | |
| Add HAL to Watchlist: View: Get Complete HAL Trend Analysis ➞ | |
 | APLS Apellis Pharmaceuticals, Inc. |
| Sector: Health Care | |
| SubSector: Biotechnology | |
| MarketCap: 2030.95 Millions | |
| Recent Price: 27.57 Smart Investing & Trading Score: 80 | |
| Day Percent Change: 3.91% Day Change: 1.04 | |
| Week Change: 0% Year-to-date Change: -13.4% | |
| APLS Links: Profile News Message Board | |
| Charts:- Daily , Weekly | |
| Add APLS to Watchlist: View: Get Complete APLS Trend Analysis ➞ | |
 | IPGP IPG Photonics Corporation |
| Sector: Technology | |
| SubSector: Semiconductor Equipment & Materials | |
| MarketCap: 6059.38 Millions | |
| Recent Price: 81.82 Smart Investing & Trading Score: 80 | |
| Day Percent Change: 3.83% Day Change: 2.9 | |
| Week Change: -1.06% Year-to-date Change: 8.1% | |
| IPGP Links: Profile News Message Board | |
| Charts:- Daily , Weekly | |
| Add IPGP to Watchlist: View: Get Complete IPGP Trend Analysis ➞ | |
 | KSS Kohl s Corporation |
| Sector: Services & Goods | |
| SubSector: Department Stores | |
| MarketCap: 3068 Millions | |
| Recent Price: 16.42 Smart Investing & Trading Score: 90 | |
| Day Percent Change: 3.6% Day Change: 0.57 | |
| Week Change: 9.03% Year-to-date Change: 27.9% | |
| KSS Links: Profile News Message Board | |
| Charts:- Daily , Weekly | |
| Add KSS to Watchlist: View: Get Complete KSS Trend Analysis ➞ | |
 | SOFI SoFi Technologies, Inc. |
| Sector: Financials | |
| SubSector: Credit Services | |
| MarketCap: 7990 Millions | |
| Recent Price: 25.54 Smart Investing & Trading Score: 70 | |
| Day Percent Change: 3.6% Day Change: 0.81 | |
| Week Change: 0.17% Year-to-date Change: 51.5% | |
| SOFI Links: Profile News Message Board | |
| Charts:- Daily , Weekly | |
| Add SOFI to Watchlist: View: Get Complete SOFI Trend Analysis ➞ | |
 | TNDM Tandem Diabetes Care, Inc. |
| Sector: Health Care | |
| SubSector: Medical Instruments & Supplies | |
| MarketCap: 3359.1 Millions | |
| Recent Price: 12.51 Smart Investing & Trading Score: 40 | |
| Day Percent Change: 3.46% Day Change: 0.37 | |
| Week Change: 3.66% Year-to-date Change: -69.3% | |
| TNDM Links: Profile News Message Board | |
| Charts:- Daily , Weekly | |
| Add TNDM to Watchlist: View: Get Complete TNDM Trend Analysis ➞ | |
 | PHM PulteGroup, Inc. |
| Sector: Industrials | |
| SubSector: Residential Construction | |
| MarketCap: 6186.46 Millions | |
| Recent Price: 137.9 Smart Investing & Trading Score: 100 | |
| Day Percent Change: 3.45% Day Change: 4.6 | |
| Week Change: 4.45% Year-to-date Change: 21.7% | |
| PHM Links: Profile News Message Board | |
| Charts:- Daily , Weekly | |
| Add PHM to Watchlist: View: Get Complete PHM Trend Analysis ➞ | |
 | GPC Genuine Parts Company |
| Sector: Services & Goods | |
| SubSector: Auto Parts Stores | |
| MarketCap: 8605.9 Millions | |
| Recent Price: 140.89 Smart Investing & Trading Score: 100 | |
| Day Percent Change: 3.39% Day Change: 4.62 | |
| Week Change: 1.12% Year-to-date Change: 23.2% | |
| GPC Links: Profile News Message Board | |
| Charts:- Daily , Weekly | |
| Add GPC to Watchlist: View: Get Complete GPC Trend Analysis ➞ | |
 | ENTG Entegris, Inc. |
| Sector: Technology | |
| SubSector: Semiconductor Equipment & Materials | |
| MarketCap: 5890.38 Millions | |
| Recent Price: 83.74 Smart Investing & Trading Score: 20 | |
| Day Percent Change: 3.37% Day Change: 2.68 | |
| Week Change: 4.08% Year-to-date Change: -16.9% | |
| ENTG Links: Profile News Message Board | |
| Charts:- Daily , Weekly | |
| Add ENTG to Watchlist: View: Get Complete ENTG Trend Analysis ➞ | |
 | DAR Darling Ingredients Inc. |
| Sector: Industrials | |
| SubSector: Waste Management | |
| MarketCap: 3075.28 Millions | |
| Recent Price: 33.96 Smart Investing & Trading Score: 20 | |
| Day Percent Change: 3.31% Day Change: 1.02 | |
| Week Change: 2.84% Year-to-date Change: -5.6% | |
| DAR Links: Profile News Message Board | |
| Charts:- Daily , Weekly | |
| Add DAR to Watchlist: View: Get Complete DAR Trend Analysis ➞ | |
 | DXCM DexCom, Inc. |
| Sector: Health Care | |
| SubSector: Medical Laboratories & Research | |
| MarketCap: 19559 Millions | |
| Recent Price: 81.44 Smart Investing & Trading Score: 50 | |
| Day Percent Change: 3.19% Day Change: 2.52 | |
| Week Change: 8.1% Year-to-date Change: -6.2% | |
| DXCM Links: Profile News Message Board | |
| Charts:- Daily , Weekly | |
| Add DXCM to Watchlist: View: Get Complete DXCM Trend Analysis ➞ | |
 | MHK Mohawk Industries, Inc. |
| Sector: Consumer Staples | |
| SubSector: Home Furnishings & Fixtures | |
| MarketCap: 4682.25 Millions | |
| Recent Price: 134.68 Smart Investing & Trading Score: 100 | |
| Day Percent Change: 3.14% Day Change: 4.1 | |
| Week Change: 1.5% Year-to-date Change: 10.1% | |
| MHK Links: Profile News Message Board | |
| Charts:- Daily , Weekly | |
| Add MHK to Watchlist: View: Get Complete MHK Trend Analysis ➞ | |
 | CPRT Copart, Inc. |
| Sector: Services & Goods | |
| SubSector: Auto Dealerships | |
| MarketCap: 15462.1 Millions | |
| Recent Price: 49.62 Smart Investing & Trading Score: 90 | |
| Day Percent Change: 3.12% Day Change: 1.5 | |
| Week Change: 1.66% Year-to-date Change: -14.3% | |
| CPRT Links: Profile News Message Board | |
| Charts:- Daily , Weekly | |
| Add CPRT to Watchlist: View: Get Complete CPRT Trend Analysis ➞ | |
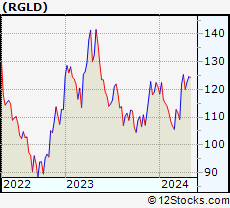 | RGLD Royal Gold, Inc. |
| Sector: Materials | |
| SubSector: Gold | |
| MarketCap: 5110.09 Millions | |
| Recent Price: 179.58 Smart Investing & Trading Score: 100 | |
| Day Percent Change: 2.97% Day Change: 5.04 | |
| Week Change: 3.03% Year-to-date Change: 33.7% | |
| RGLD Links: Profile News Message Board | |
| Charts:- Daily , Weekly | |
| Add RGLD to Watchlist: View: Get Complete RGLD Trend Analysis ➞ | |
 | APA Apache Corporation |
| Sector: Energy | |
| SubSector: Independent Oil & Gas | |
| MarketCap: 1937.53 Millions | |
| Recent Price: 23.34 Smart Investing & Trading Score: 80 | |
| Day Percent Change: 2.91% Day Change: 0.66 | |
| Week Change: 0.52% Year-to-date Change: 9.7% | |
| APA Links: Profile News Message Board | |
| Charts:- Daily , Weekly | |
| Add APA to Watchlist: View: Get Complete APA Trend Analysis ➞ | |
 | BKR Baker Hughes Company |
| Sector: Services & Goods | |
| SubSector: Technical Services | |
| MarketCap: 1330 Millions | |
| Recent Price: 46.29 Smart Investing & Trading Score: 100 | |
| Day Percent Change: 2.87% Day Change: 1.29 | |
| Week Change: 1.96% Year-to-date Change: 1.9% | |
| BKR Links: Profile News Message Board | |
| Charts:- Daily , Weekly | |
| Add BKR to Watchlist: View: Get Complete BKR Trend Analysis ➞ | |
 | SSRM SSR Mining Inc. |
| Sector: Materials | |
| SubSector: Gold | |
| MarketCap: 1546.09 Millions | |
| Recent Price: 19.31 Smart Investing & Trading Score: 100 | |
| Day Percent Change: 2.86% Day Change: 0.47 | |
| Week Change: 5.22% Year-to-date Change: 143.1% | |
| SSRM Links: Profile News Message Board | |
| Charts:- Daily , Weekly | |
| Add SSRM to Watchlist: View: Get Complete SSRM Trend Analysis ➞ | |
 | WAT Waters Corporation |
| Sector: Health Care | |
| SubSector: Medical Instruments & Supplies | |
| MarketCap: 11882 Millions | |
| Recent Price: 298.29 Smart Investing & Trading Score: 60 | |
| Day Percent Change: 2.84% Day Change: 8.23 | |
| Week Change: -1.16% Year-to-date Change: -28.2% | |
| WAT Links: Profile News Message Board | |
| Charts:- Daily , Weekly | |
| Add WAT to Watchlist: View: Get Complete WAT Trend Analysis ➞ | |
 | CE Celanese Corporation |
| Sector: Materials | |
| SubSector: Chemicals - Major Diversified | |
| MarketCap: 8521.06 Millions | |
| Recent Price: 45.9 Smart Investing & Trading Score: 40 | |
| Day Percent Change: 2.82% Day Change: 1.26 | |
| Week Change: -3.63% Year-to-date Change: -35.3% | |
| CE Links: Profile News Message Board | |
| Charts:- Daily , Weekly | |
| Add CE to Watchlist: View: Get Complete CE Trend Analysis ➞ | |
 | HXL Hexcel Corporation |
| Sector: Industrials | |
| SubSector: Aerospace/Defense Products & Services | |
| MarketCap: 2905.51 Millions | |
| Recent Price: 63.15 Smart Investing & Trading Score: 100 | |
| Day Percent Change: 2.77% Day Change: 1.68 | |
| Week Change: -0.08% Year-to-date Change: 0.4% | |
| HXL Links: Profile News Message Board | |
| Charts:- Daily , Weekly | |
| Add HXL to Watchlist: View: Get Complete HXL Trend Analysis ➞ | |
| For tabular summary view of above stock list: Summary View ➞ 0 - 25 , 25 - 50 , 50 - 75 , 75 - 100 , 100 - 125 , 125 - 150 , 150 - 175 , 175 - 200 , 200 - 225 , 225 - 250 , 250 - 275 , 275 - 300 , 300 - 325 , 325 - 350 , 350 - 375 , 375 - 400 , 400 - 425 , 425 - 450 , 450 - 475 , 475 - 500 , 500 - 525 , 525 - 550 , 550 - 575 , 575 - 600 , 600 - 625 , 625 - 650 , 650 - 675 , 675 - 700 , 700 - 725 , 725 - 750 | ||
| Click To Change The Sort Order: By Market Cap or Company Size Performance: Year-to-date, Week and Day | |
| Select Chart Type: | ||
|
Best Stocks Today 12Stocks.com |
© 2025 12Stocks.com Terms & Conditions Privacy Contact Us
All Information Provided Only For Education And Not To Be Used For Investing or Trading. See Terms & Conditions


One More Thing ... Get Best Stocks Delivered Daily!
Never Ever Miss A Move With Our Top Ten Stocks Lists
Find Best Stocks In Any Market - Bull or Bear Market
Take A Peek At Our Top Ten Stocks Lists: Daily, Weekly, Year-to-Date & Top Trends
Find Best Stocks In Any Market - Bull or Bear Market
Take A Peek At Our Top Ten Stocks Lists: Daily, Weekly, Year-to-Date & Top Trends
Midcap Stocks With Best Up Trends [0-bearish to 100-bullish]: T. Rowe[100], Macy s[100], Western Digital[100], Pulte [100], Genuine Parts[100], Mohawk Industries[100], Royal Gold[100], Baker Hughes[100], SSR Mining[100], Hexcel [100], D.R. Horton[100]
Best Midcap Stocks Year-to-Date:
MP Materials[337.69%], Viasat [212.75%], Robinhood Markets[185.29%], SSR Mining[143.1%], Celsius [135.65%], Palantir Technologies[106.51%], Alnylam [98.7%], Roblox [98.5%], Avis Budget[86.43%], Western Digital[83.1%], Cloudflare [79.02%] Best Midcap Stocks This Week:
Sunrun [40.65%], Macy s[30.31%], agilon health[16.04%], Nu [13.82%], Western Digital[11.99%], Celsius [9.53%], Kohl s[9.03%], ICU Medical[8.8%], Inspire Medical[8.32%], Lyft [8.14%], DexCom [8.1%] Best Midcap Stocks Daily:
New Fortress[6.67%], T. Rowe[5.95%], Macy s[5.9%], Western Digital[4.62%], Builders FirstSource[4.61%], Halliburton [4.08%], Apellis [3.91%], IPG Photonics[3.83%], Kohl s[3.6%], SoFi Technologies[3.6%], Tandem Diabetes[3.46%]