
 Login Sign Up


| |||||
 |  | ||||

| 12Stocks.com Market Intelligence |
Best Latin America Stocks
|
|
| Quick Read: Top Latin America Stocks By Performances & Trends: Daily, Weekly, Year-to-Date, Market Cap (Size) & Technical Trends | |||
| Best Latin America Views: Quick Browse View, Summary & Slide Show | |||
| 12Stocks.com Latin America Stocks Performances & Trends Daily | |||||||||
|
|  The overall market intelligence score is 70 (0-bearish to 100-bullish) which puts Latin America index in short term neutral to bullish trend. The market intelligence score from previous trading session is 70 and an improvement of trend continues.
| ||||||||
| Here are the market intelligence trend scores of the most requested Latin America stocks at 12Stocks.com (click stock name for detailed review): | |
| Scroll down this page for most comprehensive review of Latin America stocks by performance, trends, technical analysis, charts, fund plays & more | |


| 12Stocks.com: Top Performing Latin America Index Stocks | ||||||||||||||||||||||||||||||||||||||||||||
 The top performing Latin America Index stocks year to date are
Now, more recently, over last week, the top performing Latin America Index stocks on the move are


|
||||||||||||||||||||||||||||||||||||||||||||
| 12Stocks.com: Investing in Latin America Index with Stocks | |
|
The following table helps investors and traders sort through current performance and trends (as measured by market intelligence score) of various
stocks in the Latin America Index. Quick View: Move mouse or cursor over stock symbol (ticker) to view short-term technical chart and over stock name to view long term chart. Click on  to add stock symbol to your watchlist and to add stock symbol to your watchlist and  to view watchlist. Click on any ticker or stock name for detailed market intelligence report for that stock. to view watchlist. Click on any ticker or stock name for detailed market intelligence report for that stock. |
12Stocks.com Performance of Stocks in Latin America Index
| Ticker | Stock Name | Watchlist | Category | Recent Price | Market Intelligence Score | Change % | YTD Change% |
| AUPH | Aurinia |   | Health Care | 12.09 | 100 | -30.38 | 33.74% |
| AQN | Algonquin Power | | Utilities | 5.82 | 60 | -30.76 | 33.97% |
| AQN | Algonquin Power | | Utilities | 5.87 | 60 | -30.76 | 33.97% |
| TLRY | Tilray | | Health Care | 1.18 | 100 | -36.26 | -6.02% |
| GGB | Gerdau S.A | | Materials | 3.03 | 40 | -38.72 | 6.69% |
| GGB | Gerdau S.A | | Materials | 2.96 | 40 | -38.72 | 6.69% |
| CNQ | Canadian Natural | | Energy | 29.94 | 0 | -40.26 | -0.47% |
| CNQ | Canadian Natural | | Energy | 29.79 | 0 | -40.26 | -0.47% |
| BLDP | Ballard Power | | Industrials | 1.87 | 60 | -57.66 | 12.65% |
| BLDP | Ballard Power | | Industrials | 1.83 | 60 | -57.66 | 12.65% |
| TV | Grupo Televisa | | Services & Goods | 2.38 | 50 | -58.66 | 48.44% |
| TV | Grupo Televisa | | Services & Goods | 2.35 | 50 | -58.66 | 48.44% |
| To view more stocks, click on Next / Previous arrows or select different range: 0 - 25 , 25 - 50 , 50 - 75 , 75 - 100 , 100 - 125 , 125 - 150 , 150 - 175 , 175 - 200 , 200 - 225 , 225 - 250 , 250 - 275 , 275 - 300 , 300 - 325 , 325 - 350 | ||
 | Click To Change The Sort Order: By Market Cap or Company Size Performance: Year-to-date, Week and Day |  |
| Detailed Overview Of Latin America Stocks |
| Latin America Technical Overview, Leaders & Laggards, Top Latin America ETF Funds & Detailed Latin America Stocks List, Charts, Trends & More |
| Latin America: Technical Analysis, Trends & YTD Performance | |
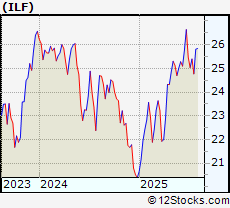
 ILF Weekly Chart |
|
| Long Term Trend: Very Good | |
| Medium Term Trend: Very Good | |
 ILF Daily Chart |
|
| Short Term Trend: Very Good | |
| Overall Trend Score: 70 | |
| YTD Performance: 27.9% | |
| **Trend Scores & Views Are Only For Educational Purposes And Not For Investing | |
| 12Stocks.com: Investing in Latin America Index using Exchange Traded Funds | |
|
The following table shows list of key exchange traded funds (ETF) that
help investors play Latin America stock market. For detailed view, check out our ETF Funds section of our website. Quick View: Move mouse or cursor over ETF symbol (ticker) to view short-term technical chart and over ETF name to view long term chart. Click on ticker or stock name for detailed view. Click on to add stock symbol to your watchlist and to view watchlist. |
12Stocks.com List of ETFs that track Latin America Index
| Ticker | ETF Name | Watchlist | Recent Price | Market Intelligence Score | Change % | Week % | Year-to-date % |
| ILF | Latin America 40 | | 26.13 | 70 | -2.49 | 2.83 | 27.9% |
| ILF | Latin America 40 | | 25.85 | 70 | -2.49 | 2.83 | 27.9% |
| EWC | Canada | | 47.64 | 60 | 1.94 | -0.19 | 19.01% |
| EWC | Canada | | 47.33 | 60 | 1.94 | -0.19 | 19.01% |
| FLN | Latin America AlphaDEX | | 19.95 | 60 | 1.56 | 2.77 | 34.66% |
| EWZ | Brazil | | 28.18 | 70 | 2.44 | 2.66 | 27.52% |
| EWZ | Brazil | | 27.89 | 70 | 2.44 | 2.66 | 27.52% |
| EWW | Mexico | | 61.99 | 20 | -11.13 | 2.02 | 34.79% |
| EWW | Mexico | | 60.99 | 20 | -11.13 | 2.02 | 34.79% |
| ARGT | Argentina | | 83.91 | 20 | 1.66 | -0.89 | 3.94% |
| EWZS | Brazil Small-Cap | | 12.72 | 70 | -12.63 | 2.58 | 38.9% |
| EWZS | Brazil Small-Cap | | 12.64 | 70 | -12.63 | 2.58 | 38.9% |
| BRF | Brazil Small-Cap | | 14.97 | 50 | 4.34 | 1.72 | 36.16% |
| BRF | Brazil Small-Cap | | 14.91 | 50 | 4.34 | 1.72 | 36.16% |
| BZQ | Short Brazil | | 10.99 | 20 | -4.75 | -5.5 | -41.6% |
| BZQ | Short Brazil | | 11.22 | 20 | -4.75 | -5.5 | -41.6% |
| BRZU | Brazil Bull 3X | | 61.61 | 70 | 4.77 | 4.85 | 50.76% |
| BRZU | Brazil Bull 3X | | 60.54 | 70 | 4.77 | 4.85 | 50.76% |
| 12Stocks.com: Charts, Trends, Fundamental Data and Performances of Latin America Stocks | |
|
We now take in-depth look at all Latin America stocks including charts, multi-period performances and overall trends (as measured by market intelligence score). One can sort Latin America stocks (click link to choose) by Daily, Weekly and by Year-to-Date performances. Also, one can sort by size of the company or by market capitalization. |
| Select Your Default Chart Type: | |||||
| |||||
| Click on stock symbol or name for detailed view. Click on to add stock symbol to your watchlist and to view watchlist. Quick View: Move mouse or cursor over "Daily" to quickly view daily technical stock chart and over "Weekly" to view weekly technical stock chart. | |||||

 | AUPH Aurinia Pharmaceuticals Inc. |
| Sector: Health Care | |
| SubSector: Biotechnology | |
| MarketCap: 1319.75 Millions | |
| Recent Price: 12.09 Market Intelligence Score: 100 | |
| Day Percent Change: -30.38% Day Change: -2.95 | |
| Week Change: 3.45% Year-to-date Change: 33.7% | |
| AUPH Links: Profile News Message Board | |
| Charts:- Daily , Weekly | |
| Add AUPH to Watchlist: View: Get Complete AUPH Trend Analysis ➞ | |
 | AQN Algonquin Power & Utilities Corp. |
| Sector: Utilities | |
| SubSector: Diversified Utilities | |
| MarketCap: 5916.4 Millions | |
| Recent Price: 5.82 Market Intelligence Score: 60 | |
| Day Percent Change: -30.76% Day Change: -2.39 | |
| Week Change: -1.36% Year-to-date Change: 34.0% | |
| AQN Links: Profile News Message Board | |
| Charts:- Daily , Weekly | |
| Add AQN to Watchlist: View: Get Complete AQN Trend Analysis ➞ | |
| AQN Algonquin Power & Utilities Corp. |
| Sector: Utilities | |
| SubSector: Diversified Utilities | |
| MarketCap: 5916.4 Millions | |
| Recent Price: 5.87 Market Intelligence Score: 60 | |
| Day Percent Change: -30.76% Day Change: -2.39 | |
| Week Change: -1.36% Year-to-date Change: 34.0% | |
| AQN Links: Profile News Message Board | |
| Charts:- Daily , Weekly | |
| Add AQN to Watchlist: View: Get Complete AQN Trend Analysis ➞ | |
 | TLRY Tilray, Inc. |
| Sector: Health Care | |
| SubSector: Drug Manufacturers - Other | |
| MarketCap: 452.533 Millions | |
| Recent Price: 1.18 Market Intelligence Score: 100 | |
| Day Percent Change: -36.26% Day Change: -1.1 | |
| Week Change: 102.53% Year-to-date Change: -6.0% | |
| TLRY Links: Profile News Message Board | |
| Charts:- Daily , Weekly | |
| Add TLRY to Watchlist: View: Get Complete TLRY Trend Analysis ➞ | |
 | GGB Gerdau S.A. |
| Sector: Materials | |
| SubSector: Steel & Iron | |
| MarketCap: 3607.48 Millions | |
| Recent Price: 3.03 Market Intelligence Score: 40 | |
| Day Percent Change: -38.72% Day Change: -2.11 | |
| Week Change: 5.21% Year-to-date Change: 6.7% | |
| GGB Links: Profile News Message Board | |
| Charts:- Daily , Weekly | |
| Add GGB to Watchlist: View: Get Complete GGB Trend Analysis ➞ | |
| GGB Gerdau S.A. |
| Sector: Materials | |
| SubSector: Steel & Iron | |
| MarketCap: 3607.48 Millions | |
| Recent Price: 2.96 Market Intelligence Score: 40 | |
| Day Percent Change: -38.72% Day Change: -2.11 | |
| Week Change: 5.21% Year-to-date Change: 6.7% | |
| GGB Links: Profile News Message Board | |
| Charts:- Daily , Weekly | |
| Add GGB to Watchlist: View: Get Complete GGB Trend Analysis ➞ | |
 | CNQ Canadian Natural Resources Limited |
| Sector: Energy | |
| SubSector: Independent Oil & Gas | |
| MarketCap: 11925.2 Millions | |
| Recent Price: 29.94 Market Intelligence Score: 0 | |
| Day Percent Change: -40.26% Day Change: -24.55 | |
| Week Change: -4.47% Year-to-date Change: -0.5% | |
| CNQ Links: Profile News Message Board | |
| Charts:- Daily , Weekly | |
| Add CNQ to Watchlist: View: Get Complete CNQ Trend Analysis ➞ | |
| CNQ Canadian Natural Resources Limited |
| Sector: Energy | |
| SubSector: Independent Oil & Gas | |
| MarketCap: 11925.2 Millions | |
| Recent Price: 29.79 Market Intelligence Score: 0 | |
| Day Percent Change: -40.26% Day Change: -24.55 | |
| Week Change: -4.47% Year-to-date Change: -0.5% | |
| CNQ Links: Profile News Message Board | |
| Charts:- Daily , Weekly | |
| Add CNQ to Watchlist: View: Get Complete CNQ Trend Analysis ➞ | |
 | BLDP Ballard Power Systems Inc. |
| Sector: Industrials | |
| SubSector: Industrial Electrical Equipment | |
| MarketCap: 2124.79 Millions | |
| Recent Price: 1.87 Market Intelligence Score: 60 | |
| Day Percent Change: -57.66% Day Change: -2.71 | |
| Week Change: 2.19% Year-to-date Change: 12.7% | |
| BLDP Links: Profile News Message Board | |
| Charts:- Daily , Weekly | |
| Add BLDP to Watchlist: View: Get Complete BLDP Trend Analysis ➞ | |
| BLDP Ballard Power Systems Inc. |
| Sector: Industrials | |
| SubSector: Industrial Electrical Equipment | |
| MarketCap: 2124.79 Millions | |
| Recent Price: 1.83 Market Intelligence Score: 60 | |
| Day Percent Change: -57.66% Day Change: -2.71 | |
| Week Change: 2.19% Year-to-date Change: 12.7% | |
| BLDP Links: Profile News Message Board | |
| Charts:- Daily , Weekly | |
| Add BLDP to Watchlist: View: Get Complete BLDP Trend Analysis ➞ | |
 | TV Grupo Televisa, S.A.B. |
| Sector: Services & Goods | |
| SubSector: Broadcasting - TV | |
| MarketCap: 3740.43 Millions | |
| Recent Price: 2.38 Market Intelligence Score: 50 | |
| Day Percent Change: -58.66% Day Change: -2.88 | |
| Week Change: -2.06% Year-to-date Change: 48.4% | |
| TV Links: Profile News Message Board | |
| Charts:- Daily , Weekly | |
| Add TV to Watchlist: View: Get Complete TV Trend Analysis ➞ | |
| TV Grupo Televisa, S.A.B. |
| Sector: Services & Goods | |
| SubSector: Broadcasting - TV | |
| MarketCap: 3740.43 Millions | |
| Recent Price: 2.35 Market Intelligence Score: 50 | |
| Day Percent Change: -58.66% Day Change: -2.88 | |
| Week Change: -2.06% Year-to-date Change: 48.4% | |
| TV Links: Profile News Message Board | |
| Charts:- Daily , Weekly | |
| Add TV to Watchlist: View: Get Complete TV Trend Analysis ➞ | |
| To view more stocks, click on Next / Previous arrows or select different range: 0 - 25 , 25 - 50 , 50 - 75 , 75 - 100 , 100 - 125 , 125 - 150 , 150 - 175 , 175 - 200 , 200 - 225 , 225 - 250 , 250 - 275 , 275 - 300 , 300 - 325 , 325 - 350 | ||
| Click To Change The Sort Order: By Market Cap or Company Size Performance: Year-to-date, Week and Day | |
| Select Chart Type: | ||
 Best Stocks Today 12Stocks.com |
© 2025 12Stocks.com Terms & Conditions Privacy Contact Us
All Information Provided Only For Education And Not To Be Used For Investing or Trading. See Terms & Conditions


One More Thing ... Get Best Stocks Delivered Daily!
Never Ever Miss A Move With Our Top Ten Stocks Lists
Find Best Stocks In Any Market - Bull or Bear Market
Take A Peek At Our Top Ten Stocks Lists: Daily, Weekly, Year-to-Date & Top Trends
Find Best Stocks In Any Market - Bull or Bear Market
Take A Peek At Our Top Ten Stocks Lists: Daily, Weekly, Year-to-Date & Top Trends
Latin America Stocks With Best Up Trends [0-bearish to 100-bullish]: Ritchie Bros.[100], Ritchie Bros.[100], Xenon [100], Xenon [100], Aurora Cannabis[100], BRP [100], Telefonica Brasil[100], Telefonica Brasil[100], Magna [100], Magna [100], Equinox Gold[100]
Best Latin America Stocks Year-to-Date:
Lavoro [208647%], Gold Royalty[152.89%], Dominion Diamond[136.57%], Dominion Diamond[136.57%], SSR Mining[134.91%], D-Wave Quantum[122.02%], Celestica [121.26%], Celestica [121.26%], Vasta Platform[115%], Kinross Gold[106.47%], Kinross Gold[106.47%] Best Latin America Stocks This Week:
Lavoro [493678%], Tilray [102.53%], Canopy Growth[56.19%], Aurora Cannabis[30.58%], Cronos [24.76%], Bausch Health[24.48%], Hudbay Minerals[23.29%], Hudbay Minerals[23.29%], SunOpta [21.39%], SunOpta [21.39%], StoneCo [17.08%] Best Latin America Stocks Daily:
Embraer S.A[128.34%], Embraer S.A[128.34%], Grupo Financiero[107.29%], Grupo Financiero[107.29%], Banco BBVA[78.27%], Transportadora de[58.85%], Transportadora de[58.85%], Zymeworks [56.24%], MercadoLibre [50.58%], MercadoLibre [50.58%], Ritchie Bros.[47.48%]