
 Login Sign Up


| |||||
 |  | ||||

| 12Stocks.com Market Intelligence |
Best Latin America Stocks
|
|
| Quick Read: Top Latin America Stocks By Performances & Trends: Daily, Weekly, Year-to-Date, Market Cap (Size) & Technical Trends | |||
| Best Latin America Views: Quick Browse View, Summary & Slide Show | |||
| 12Stocks.com Latin America Stocks Performances & Trends Daily | |||||||||
|
|  The overall market intelligence score is 40 (0-bearish to 100-bullish) which puts Latin America index in short term bearish to neutral trend. The market intelligence score from previous trading session is 50 and a deterioration of trend continues.
| ||||||||
Here are the market intelligence trend scores of the most requested Latin America stocks at 12Stocks.com (click stock name for detailed review):
| |||||||||||||||||||||||||
| Scroll down this page for most comprehensive review of Latin America stocks by performance, trends, technical analysis, charts, fund plays & more | |||||||||||||||||||||||||


| 12Stocks.com: Top Performing Latin America Index Stocks | ||||||||||||||||||||||||||||||||||||||||||||||||
 The top performing Latin America Index stocks year to date are
Now, more recently, over last week, the top performing Latin America Index stocks on the move are


|
||||||||||||||||||||||||||||||||||||||||||||||||
| 12Stocks.com: Investing in Latin America Index with Stocks | |
|
The following table helps investors and traders sort through current performance and trends (as measured by market intelligence score) of various
stocks in the Latin America Index. Quick View: Move mouse or cursor over stock symbol (ticker) to view short-term technical chart and over stock name to view long term chart. Click on  to add stock symbol to your watchlist and to add stock symbol to your watchlist and  to view watchlist. Click on any ticker or stock name for detailed market intelligence report for that stock. to view watchlist. Click on any ticker or stock name for detailed market intelligence report for that stock. |
12Stocks.com Performance of Stocks in Latin America Index
| Ticker | Stock Name | Watchlist | Category | Recent Price | Market Intelligence Score | Change % | YTD Change% |
| CCJ | Cameco Corp |   | Energy | 84.17 | 60 | -0.04% | 61.37% |
| SLF | Sun Life | | Financials | 60.34 | 80 | 0.33% | 4.52% |
| PBR-A | Petroleo Brasileiro | | Energy | 11.62 | 70 | -0.09% | 0.00% |
| CVE | Cenovus Energy | | Energy | 16.98 | 70 | 1.37% | 13.12% |
| QSR | Restaurant Brands | | Services & Goods | 68.48 | 100 | 1.18% | 6.42% |
| CLS | Celestica | | Technology | 233.67 | 40 | -6.87% | 151.07% |
| BBDO | Banco Bradesco | | Financials | 2.90 | 80 | 4.32% | 70.48% |
| NTR | Nutrien | | Materials | 59.35 | 90 | -0.67% | 33.77% |
| KGC | Kinross Gold | | Materials | 25.03 | 70 | 0.32% | 154.54% |
| TU | Telus Corp | | Technology | 15.69 | 10 | 0.71% | 19.37% |
| FTS | Fortis | | Utilities | 50.28 | 60 | 0.00% | 23.84% |
| BCE | BCE | | Technology | 23.36 | 40 | 0.56% | 4.83% |
| ABX | Barrick Gold | | Materials | 13.54 | 30 | 0.00% | 0.00% |
| PBA | Pembina Pipeline | | Energy | 42.09 | 100 | 6.02% | 16.41% |
| GIB | CGI | | Technology | 91.65 | 50 | 1.54% | -15.90% |
| LULU | Lululemon Athletica | | Services & Goods | 175.59 | 50 | -1.46% | -52.84% |
| BSBR | Banco Santander | | Financials | 5.49 | 60 | 0.92% | 44.76% |
| VIV | Telefonica Brasil | | Technology | 12.41 | 30 | -0.56% | 67.75% |
| RCI | Rogers | | Technology | 34.75 | 60 | -1.14% | 17.41% |
| FMX | Fomento Economico | | Consumer Staples | 95.71 | 50 | -0.63% | 17.59% |
| GFL | GFL Environmental | | Industrials | 46.63 | 0 | -0.28% | 4.61% |
| TECK | Teck Resources | | Materials | 43.23 | 60 | -0.35% | 6.13% |
| EBR | Centrais Eletricas | | Utilities | 9.83 | 60 | 0.20% | 75.14% |
| SBS | Companhia de | | Utilities | 23.99 | 30 | 0.17% | 72.06% |
| POT | Potash | | Materials | 831.27 | 80 | 2.11% | 0.00% |
| To view more stocks, click on Next / Previous arrows or select different range: 0 - 25 , 25 - 50 , 50 - 75 , 75 - 100 , 100 - 125 , 125 - 150 , 150 - 175 , 175 - 200 , 200 - 225 , 225 - 250 , 250 - 275 , 275 - 300 , 300 - 325 | ||
 | Click To Change The Sort Order: By Market Cap or Company Size Performance: Year-to-date, Week and Day |  |
| Detailed Overview Of Latin America Stocks |
| Latin America Technical Overview, Leaders & Laggards, Top Latin America ETF Funds & Detailed Latin America Stocks List, Charts, Trends & More |
| Latin America: Technical Analysis, Trends & YTD Performance | |
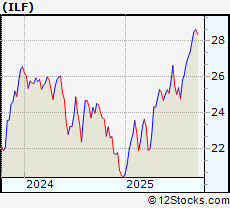
 ILF Weekly Chart |
|
| Long Term Trend: Very Good | |
| Medium Term Trend: Very Good | |
 ILF Daily Chart |
|
| Short Term Trend: Not Good | |
| Overall Trend Score: 40 | |
| YTD Performance: 37.4889% | |
| **Trend Scores & Views Are Only For Educational Purposes And Not For Investing | |
| 12Stocks.com: Investing in Latin America Index using Exchange Traded Funds | |
|
The following table shows list of key exchange traded funds (ETF) that
help investors play Latin America stock market. For detailed view, check out our ETF Funds section of our website. Quick View: Move mouse or cursor over ETF symbol (ticker) to view short-term technical chart and over ETF name to view long term chart. Click on ticker or stock name for detailed view. Click on to add stock symbol to your watchlist and to view watchlist. |
12Stocks.com List of ETFs that track Latin America Index
| Ticker | ETF Name | Watchlist | Recent Price | Market Intelligence Score | Change % | Week % | Year-to-date % |
| LBJ | Latin America Bull | | 60.40 | 50 | 0 | 0 | 0% |
| DBBR | Brazil Hedgd Eq | | 54.06 | 70 | -0.478645 | 0.632911 | 0% |
| FBZ | Brazil AlphaDEX | | 11.52 | 30 | 0 | 0 | 29.5955% |
| 12Stocks.com: Charts, Trends, Fundamental Data and Performances of Latin America Stocks | |
|
We now take in-depth look at all Latin America stocks including charts, multi-period performances and overall trends (as measured by market intelligence score). One can sort Latin America stocks (click link to choose) by Daily, Weekly and by Year-to-Date performances. Also, one can sort by size of the company or by market capitalization. |
| Select Your Default Chart Type: | |||||
| |||||
| Click on stock symbol or name for detailed view. Click on to add stock symbol to your watchlist and to view watchlist. Quick View: Move mouse or cursor over "Daily" to quickly view daily technical stock chart and over "Weekly" to view weekly technical stock chart. | |||||

 | CCJ Cameco Corp |
| Sector: Energy | |
| SubSector: Uranium | |
| MarketCap: 33024.3 Millions | |
| Recent Price: 84.17 Market Intelligence Score: 60 | |
| Day Percent Change: -0.0356295% Day Change: 0.99 | |
| Week Change: -1.73943% Year-to-date Change: 61.4% | |
| CCJ Links: Profile News Message Board | |
| Charts:- Daily , Weekly | |
| Add CCJ to Watchlist: View: Get Complete CCJ Trend Analysis ➞ | |
 | SLF Sun Life Financial, Inc |
| Sector: Financials | |
| SubSector: Insurance - Diversified | |
| MarketCap: 32445.3 Millions | |
| Recent Price: 60.34 Market Intelligence Score: 80 | |
| Day Percent Change: 0.332557% Day Change: 0.16 | |
| Week Change: 2.25386% Year-to-date Change: 4.5% | |
| SLF Links: Profile News Message Board | |
| Charts:- Daily , Weekly | |
| Add SLF to Watchlist: View: Get Complete SLF Trend Analysis ➞ | |
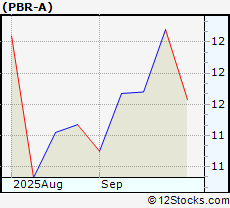 | PBR-A Petroleo Brasileiro S.A. Petrobras ADR |
| Sector: Energy | |
| SubSector: Oil & Gas Integrated | |
| MarketCap: 29893.9 Millions | |
| Recent Price: 11.62 Market Intelligence Score: 70 | |
| Day Percent Change: -0.09% Day Change: -0.01 | |
| Week Change: -3.81% Year-to-date Change: 0.0% | |
| PBR-A Links: Profile News Message Board | |
| Charts:- Daily , Weekly | |
| Add PBR-A to Watchlist: View: Get Complete PBR-A Trend Analysis ➞ | |
 | CVE Cenovus Energy Inc |
| Sector: Energy | |
| SubSector: Oil & Gas Integrated | |
| MarketCap: 28706 Millions | |
| Recent Price: 16.98 Market Intelligence Score: 70 | |
| Day Percent Change: 1.37313% Day Change: 0.14 | |
| Week Change: -4.0678% Year-to-date Change: 13.1% | |
| CVE Links: Profile News Message Board | |
| Charts:- Daily , Weekly | |
| Add CVE to Watchlist: View: Get Complete CVE Trend Analysis ➞ | |
 | QSR Restaurant Brands International Inc |
| Sector: Services & Goods | |
| SubSector: Restaurants | |
| MarketCap: 28696.9 Millions | |
| Recent Price: 68.48 Market Intelligence Score: 100 | |
| Day Percent Change: 1.18203% Day Change: 0.43 | |
| Week Change: 6.07187% Year-to-date Change: 6.4% | |
| QSR Links: Profile News Message Board | |
| Charts:- Daily , Weekly | |
| Add QSR to Watchlist: View: Get Complete QSR Trend Analysis ➞ | |
 | CLS Celestica, Inc |
| Sector: Technology | |
| SubSector: Electronic Components | |
| MarketCap: 27915.5 Millions | |
| Recent Price: 233.67 Market Intelligence Score: 40 | |
| Day Percent Change: -6.87099% Day Change: -11.41 | |
| Week Change: -4.48414% Year-to-date Change: 151.1% | |
| CLS Links: Profile News Message Board | |
| Charts:- Daily , Weekly | |
| Add CLS to Watchlist: View: Get Complete CLS Trend Analysis ➞ | |
 | BBDO Banco Bradesco S.A. |
| Sector: Financials | |
| SubSector: Foreign Regional Banks | |
| MarketCap: 27711.4 Millions | |
| Recent Price: 2.90 Market Intelligence Score: 80 | |
| Day Percent Change: 4.31655% Day Change: -0.03 | |
| Week Change: 2.16304% Year-to-date Change: 70.5% | |
| BBDO Links: Profile News Message Board | |
| Charts:- Daily , Weekly | |
| Add BBDO to Watchlist: View: Get Complete BBDO Trend Analysis ➞ | |
 | NTR Nutrien Ltd |
| Sector: Materials | |
| SubSector: Agricultural Inputs | |
| MarketCap: 27509.1 Millions | |
| Recent Price: 59.35 Market Intelligence Score: 90 | |
| Day Percent Change: -0.669456% Day Change: 0.19 | |
| Week Change: 2.06363% Year-to-date Change: 33.8% | |
| NTR Links: Profile News Message Board | |
| Charts:- Daily , Weekly | |
| Add NTR to Watchlist: View: Get Complete NTR Trend Analysis ➞ | |
 | KGC Kinross Gold Corp |
| Sector: Materials | |
| SubSector: Gold | |
| MarketCap: 26947.2 Millions | |
| Recent Price: 25.03 Market Intelligence Score: 70 | |
| Day Percent Change: 0.320641% Day Change: 0.12 | |
| Week Change: 5.87986% Year-to-date Change: 154.5% | |
| KGC Links: Profile News Message Board | |
| Charts:- Daily , Weekly | |
| Add KGC to Watchlist: View: Get Complete KGC Trend Analysis ➞ | |
 | TU Telus Corp |
| Sector: Technology | |
| SubSector: Telecom Services | |
| MarketCap: 25269.2 Millions | |
| Recent Price: 15.69 Market Intelligence Score: 10 | |
| Day Percent Change: 0.706033% Day Change: 0.14 | |
| Week Change: 0.255591% Year-to-date Change: 19.4% | |
| TU Links: Profile News Message Board | |
| Charts:- Daily , Weekly | |
| Add TU to Watchlist: View: Get Complete TU Trend Analysis ➞ | |
 | FTS Fortis Inc |
| Sector: Utilities | |
| SubSector: Utilities - Regulated Electric | |
| MarketCap: 24792.2 Millions | |
| Recent Price: 50.28 Market Intelligence Score: 60 | |
| Day Percent Change: 0% Day Change: 0.35 | |
| Week Change: 1.63736% Year-to-date Change: 23.8% | |
| FTS Links: Profile News Message Board | |
| Charts:- Daily , Weekly | |
| Add FTS to Watchlist: View: Get Complete FTS Trend Analysis ➞ | |
 | BCE BCE Inc |
| Sector: Technology | |
| SubSector: Telecom Services | |
| MarketCap: 22787.6 Millions | |
| Recent Price: 23.36 Market Intelligence Score: 40 | |
| Day Percent Change: 0.559621% Day Change: 0.18 | |
| Week Change: 1.3449% Year-to-date Change: 4.8% | |
| BCE Links: Profile News Message Board | |
| Charts:- Daily , Weekly | |
| Add BCE to Watchlist: View: Get Complete BCE Trend Analysis ➞ | |
 | ABX Barrick Gold Corporation |
| Sector: Materials | |
| SubSector: Gold | |
| MarketCap: 22158.3 Millions | |
| Recent Price: 13.54 Market Intelligence Score: 30 | |
| Day Percent Change: 0% Day Change: -9999 | |
| Week Change: 0% Year-to-date Change: 0.0% | |
| ABX Links: Profile News Message Board | |
| Charts:- Daily , Weekly | |
| Add ABX to Watchlist: View: Get Complete ABX Trend Analysis ➞ | |
 | PBA Pembina Pipeline Corporation |
| Sector: Energy | |
| SubSector: Oil & Gas Midstream | |
| MarketCap: 22063.7 Millions | |
| Recent Price: 42.09 Market Intelligence Score: 100 | |
| Day Percent Change: 6.02015% Day Change: 0.26 | |
| Week Change: 3.72104% Year-to-date Change: 16.4% | |
| PBA Links: Profile News Message Board | |
| Charts:- Daily , Weekly | |
| Add PBA to Watchlist: View: Get Complete PBA Trend Analysis ➞ | |
 | GIB CGI Inc |
| Sector: Technology | |
| SubSector: Information Technology Services | |
| MarketCap: 21345.4 Millions | |
| Recent Price: 91.65 Market Intelligence Score: 50 | |
| Day Percent Change: 1.54% Day Change: 0.95 | |
| Week Change: 3.69993% Year-to-date Change: -15.9% | |
| GIB Links: Profile News Message Board | |
| Charts:- Daily , Weekly | |
| Add GIB to Watchlist: View: Get Complete GIB Trend Analysis ➞ | |
 | LULU Lululemon Athletica inc |
| Sector: Services & Goods | |
| SubSector: Apparel Retail | |
| MarketCap: 20756.9 Millions | |
| Recent Price: 175.59 Market Intelligence Score: 50 | |
| Day Percent Change: -1.46465% Day Change: -1.75 | |
| Week Change: 2.08127% Year-to-date Change: -52.8% | |
| LULU Links: Profile News Message Board | |
| Charts:- Daily , Weekly | |
| Add LULU to Watchlist: View: Get Complete LULU Trend Analysis ➞ | |
 | BSBR Banco Santander (Brasil) S.A. ADR |
| Sector: Financials | |
| SubSector: Banks - Regional | |
| MarketCap: 20321.1 Millions | |
| Recent Price: 5.49 Market Intelligence Score: 60 | |
| Day Percent Change: 0.919118% Day Change: -0.03 | |
| Week Change: 2.80899% Year-to-date Change: 44.8% | |
| BSBR Links: Profile News Message Board | |
| Charts:- Daily , Weekly | |
| Add BSBR to Watchlist: View: Get Complete BSBR Trend Analysis ➞ | |
 | VIV Telefonica Brasil S.A., ADR |
| Sector: Technology | |
| SubSector: Telecom Services | |
| MarketCap: 19900.9 Millions | |
| Recent Price: 12.41 Market Intelligence Score: 30 | |
| Day Percent Change: -0.560897% Day Change: -0.22 | |
| Week Change: 0.812348% Year-to-date Change: 67.7% | |
| VIV Links: Profile News Message Board | |
| Charts:- Daily , Weekly | |
| Add VIV to Watchlist: View: Get Complete VIV Trend Analysis ➞ | |
 | RCI Rogers Communications Inc |
| Sector: Technology | |
| SubSector: Telecom Services | |
| MarketCap: 19388.8 Millions | |
| Recent Price: 34.75 Market Intelligence Score: 60 | |
| Day Percent Change: -1.13798% Day Change: -0.02 | |
| Week Change: -0.940707% Year-to-date Change: 17.4% | |
| RCI Links: Profile News Message Board | |
| Charts:- Daily , Weekly | |
| Add RCI to Watchlist: View: Get Complete RCI Trend Analysis ➞ | |
 | FMX Fomento Economico Mexicano S.A.B. de C.V. ADR |
| Sector: Consumer Staples | |
| SubSector: Beverages - Brewers | |
| MarketCap: 17575.6 Millions | |
| Recent Price: 95.71 Market Intelligence Score: 50 | |
| Day Percent Change: -0.633306% Day Change: -0.51 | |
| Week Change: -1.25864% Year-to-date Change: 17.6% | |
| FMX Links: Profile News Message Board | |
| Charts:- Daily , Weekly | |
| Add FMX to Watchlist: View: Get Complete FMX Trend Analysis ➞ | |
 | GFL GFL Environmental Inc |
| Sector: Industrials | |
| SubSector: Waste Management | |
| MarketCap: 17404.5 Millions | |
| Recent Price: 46.63 Market Intelligence Score: 0 | |
| Day Percent Change: -0.278015% Day Change: -0.02 | |
| Week Change: -0.0857082% Year-to-date Change: 4.6% | |
| GFL Links: Profile News Message Board | |
| Charts:- Daily , Weekly | |
| Add GFL to Watchlist: View: Get Complete GFL Trend Analysis ➞ | |
 | TECK Teck Resources Ltd |
| Sector: Materials | |
| SubSector: Other Industrial Metals & Mining | |
| MarketCap: 16774.2 Millions | |
| Recent Price: 43.23 Market Intelligence Score: 60 | |
| Day Percent Change: -0.345781% Day Change: 0.33 | |
| Week Change: 8.15612% Year-to-date Change: 6.1% | |
| TECK Links: Profile News Message Board | |
| Charts:- Daily , Weekly | |
| Add TECK to Watchlist: View: Get Complete TECK Trend Analysis ➞ | |
 | EBR Centrais Eletricas Brasileiras S.A. ADR |
| Sector: Utilities | |
| SubSector: Utilities - Renewable | |
| MarketCap: 16657.1 Millions | |
| Recent Price: 9.83 Market Intelligence Score: 60 | |
| Day Percent Change: 0.203874% Day Change: -0.09 | |
| Week Change: 4.57447% Year-to-date Change: 75.1% | |
| EBR Links: Profile News Message Board | |
| Charts:- Daily , Weekly | |
| Add EBR to Watchlist: View: Get Complete EBR Trend Analysis ➞ | |
 | SBS Companhia de Saneamento Basico do Estado de Sao Paulo. ADR |
| Sector: Utilities | |
| SubSector: Utilities - Regulated Water | |
| MarketCap: 15830.1 Millions | |
| Recent Price: 23.99 Market Intelligence Score: 30 | |
| Day Percent Change: 0.167015% Day Change: -0.18 | |
| Week Change: -0.290939% Year-to-date Change: 72.1% | |
| SBS Links: Profile News Message Board | |
| Charts:- Daily , Weekly | |
| Add SBS to Watchlist: View: Get Complete SBS Trend Analysis ➞ | |
 | POT Potash Corporation of Saskatchewan Inc. |
| Sector: Materials | |
| SubSector: Agricultural Chemicals | |
| MarketCap: 14493.6 Millions | |
| Recent Price: 831.27 Market Intelligence Score: 80 | |
| Day Percent Change: 2.10782% Day Change: -9999 | |
| Week Change: 77.1788% Year-to-date Change: 0.0% | |
| POT Links: Profile News Message Board | |
| Charts:- Daily , Weekly | |
| Add POT to Watchlist: View: Get Complete POT Trend Analysis ➞ | |
| To view more stocks, click on Next / Previous arrows or select different range: 0 - 25 , 25 - 50 , 50 - 75 , 75 - 100 , 100 - 125 , 125 - 150 , 150 - 175 , 175 - 200 , 200 - 225 , 225 - 250 , 250 - 275 , 275 - 300 , 300 - 325 | ||
| Click To Change The Sort Order: By Market Cap or Company Size Performance: Year-to-date, Week and Day | |
| Select Chart Type: | ||
 Best Stocks Today 12Stocks.com |
© 2025 12Stocks.com Terms & Conditions Privacy Contact Us
All Information Provided Only For Education And Not To Be Used For Investing or Trading. See Terms & Conditions


One More Thing ... Get Best Stocks Delivered Daily!
Never Ever Miss A Move With Our Top Ten Stocks Lists
Find Best Stocks In Any Market - Bull or Bear Market
Take A Peek At Our Top Ten Stocks Lists: Daily, Weekly, Year-to-Date & Top Trends
Find Best Stocks In Any Market - Bull or Bear Market
Take A Peek At Our Top Ten Stocks Lists: Daily, Weekly, Year-to-Date & Top Trends
Latin America Stocks With Best Up Trends [0-bearish to 100-bullish]: Lithium Americas[100], Ballard Power[100], Tower[100], Northern Dynasty[100], Shopify [100], McEwen [100], Pembina Pipeline[100], Vermilion Energy[100], Transalta Corp[100], Silvercorp Metals[100], Hudbay Minerals[100]
Best Latin America Stocks Year-to-Date:
Americas Gold[912.82%], Avino Silver[463.366%], Tower[297.028%], Gold Royalty[208.871%], Lithium Americas[195.425%], EMX Royalty[185.632%], New Gold[180.534%], Kinross Gold[154.541%], Celestica [151.069%], Iamgold Corp[137.993%], Silvercorp Metals[122.866%] Best Latin America Stocks This Week:
Companhia Brasileira[18587.4%], Cosan [16415.2%], Crescent Point[4066.17%], Golden Star[1837.95%], Grupo Financiero[1283.52%], Alexco Resource[690.301%], Yamana Gold[625.812%], Novelion [579.167%], Turquoise Hill[433.11%], Enerplus [415.601%], Nevsun Resources[402.516%] Best Latin America Stocks Daily:
Lithium Americas[31.7784%], Ballard Power[22.7826%], Tower[11.976%], Northern Dynasty[8.19672%], Platinum [8.13953%], Novelion [7.37813%], Grupo Simec[7.34127%], Shopify [6.50363%], McEwen [6.02923%], Pembina Pipeline[6.02015%], Vermilion Energy[5.81542%]