
 Login Sign Up


| |||||
 |  | ||||

| 12Stocks.com Market Intelligence |
Best Healthcare Stocks
 | "Discover best trending healthcare stocks with 12Stocks.com." |
| - Subu Vdaygiri, Founder, 12Stocks.com |
| In a hurry? Healthcare Stocks Lists: Performance Trends Table, Stock Charts
Sort Healthcare stocks: Daily, Weekly, Year-to-Date, Market Cap & Trends. Filter Healthcare stocks list by size:All Healthcare Large Mid-Range Small |
| 12Stocks.com Healthcare Stocks Performances & Trends Daily | |||||||||
|
|  The overall Smart Investing & Trading Score is 38 (0-bearish to 100-bullish) which puts Healthcare sector in short term bearish to neutral trend. The Smart Investing & Trading Score from previous trading session is 52 and hence a deterioration of trend.
| ||||||||
Here are the Smart Investing & Trading Scores of the most requested Healthcare stocks at 12Stocks.com (click stock name for detailed review):
|


| 12Stocks.com: Investing in Healthcare sector with Stocks | |
|
The following table helps investors and traders sort through current performance and trends (as measured by Smart Investing & Trading Score) of various
stocks in the Healthcare sector. Quick View: Move mouse or cursor over stock symbol (ticker) to view short-term Technical chart and over stock name to view long term chart. Click on  to add stock symbol to your watchlist and to add stock symbol to your watchlist and  to view watchlist. Click on any ticker or stock name for detailed market intelligence report for that stock. to view watchlist. Click on any ticker or stock name for detailed market intelligence report for that stock. |
12Stocks.com Performance of Stocks in Healthcare Sector
| Ticker | Stock Name | Watchlist | Category | Recent Price | Smart Investing & Trading Score | Change % | YTD Change% |
| LNTH | Lantheus |   | Equipment | 65.20 | 81 | -0.02% | 5.16% |
| HCM | Hutchison China | | Pharmaceutical | 18.99 | 85 | 3.15% | 4.86% |
| KOD | Kodiak Sciences | | Biotechnology | 3.18 | 10 | -5.92% | 4.61% |
| WST | West | | Instruments | 368.18 | 61 | -4.55% | 4.56% |
| NBIX | Neurocrine Biosciences | | Biotechnology | 137.76 | 63 | -0.87% | 4.55% |
| ENSG | Ensign | | Long-Term | 117.29 | 51 | -1.14% | 4.53% |
| PGEN | Precigen | | Biotechnology | 1.40 | 55 | -1.41% | 4.48% |
| BAX | Baxter | | Instruments | 40.23 | 53 | -1.71% | 4.06% |
| HALO | Halozyme | | Biotechnology | 38.46 | 68 | -1.69% | 4.06% |
| IRTC | iRhythm Technologies | | Instruments | 111.27 | 67 | -4.43% | 3.95% |
| CYH | Community Health | | Hospitals | 3.25 | 74 | 7.26% | 3.83% |
| BLFS | BioLife | | Instruments | 16.86 | 86 | -1.92% | 3.75% |
| GDRX | GoodRx | | Health Information | 6.94 | 71 | -0.29% | 3.74% |
| RPHM | Reneo | | Biotechnology | 1.68 | 43 | 0.30% | 3.70% |
| FATE | Fate | | Biotechnology | 3.87 | 15 | -10.00% | 3.48% |
| AIQ | Alliance | | Laboratories | 32.19 | 44 | -0.83% | 3.24% |
| CTMX | CytomX | | Biotechnology | 1.60 | 44 | -1.84% | 3.23% |
| HAE | Haemonetics | | Instruments | 87.66 | 100 | 1.67% | 2.51% |
| GPCR | Structure | | Biotechnology | 38.98 | 27 | 8.13% | 2.38% |
| LQDA | Liquidia Technologies | | Biotechnology | 12.31 | 23 | -1.91% | 2.33% |
| VMD | Viemed | | Equipment | 8.02 | 25 | -0.87% | 2.17% |
| HLN | Haleon | | Drug Manufacturers - Specialty & Generic | 8.40 | 76 | 0.60% | 2.07% |
| SOPH | SOPHiA GENETICS | | Health Information | 4.95 | 53 | -1.20% | 2.06% |
| VBIV | VBI Vaccines | | Biotechnology | 0.60 | 17 | 1.59% | 2.03% |
| CNC | Centene | | Insurance | 75.68 | 93 | -0.67% | 1.98% |
| For chart view version of above stock list: Chart View ➞ 0 - 25 , 25 - 50 , 50 - 75 , 75 - 100 , 100 - 125 , 125 - 150 , 150 - 175 , 175 - 200 , 200 - 225 , 225 - 250 , 250 - 275 , 275 - 300 , 300 - 325 , 325 - 350 , 350 - 375 , 375 - 400 , 400 - 425 , 425 - 450 , 450 - 475 , 475 - 500 , 500 - 525 , 525 - 550 , 550 - 575 , 575 - 600 , 600 - 625 , 625 - 650 , 650 - 675 , 675 - 700 , 700 - 725 | ||
 | Click To Change The Sort Order: By Market Cap or Company Size Performance: Year-to-date, Week and Day |  |
|
Get the most comprehensive stock market coverage daily at 12Stocks.com ➞ Best Stocks Today ➞ Best Stocks Weekly ➞ Best Stocks Year-to-Date ➞ Best Stocks Trends ➞  Best Stocks Today 12Stocks.com Best Nasdaq Stocks ➞ Best S&P 500 Stocks ➞ Best Tech Stocks ➞ Best Biotech Stocks ➞ |
| Detailed Overview of Healthcare Stocks |
| Healthcare Technical Overview, Leaders & Laggards, Top Healthcare ETF Funds & Detailed Healthcare Stocks List, Charts, Trends & More |
| Healthcare Sector: Technical Analysis, Trends & YTD Performance | |
| Healthcare sector is composed of stocks
from pharmaceutical, biotech, diagnostics labs, insurance providers
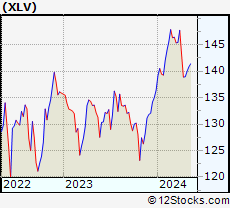
and healthcare services. Healthcare sector, as represented by XLV, an exchange-traded fund [ETF] that holds basket of Healthcare stocks (e.g, Merck, Amgen) is up by 2.6% and is currently underperforming the overall market by -2.56% year-to-date. Below is a quick view of Technical charts and trends: |
|
 XLV Weekly Chart |
|
| Long Term Trend: Not Good | |
| Medium Term Trend: Not Good | |
 XLV Daily Chart |
|
| Short Term Trend: Very Good | |
| Overall Trend Score: 38 | |
| YTD Performance: 2.6% | |
| **Trend Scores & Views Are Only For Educational Purposes And Not For Investing | |
| 12Stocks.com: Top Performing Healthcare Sector Stocks | ||||||||||||||||||||||||||||||||||||||||||||||||
 The top performing Healthcare sector stocks year to date are
Now, more recently, over last week, the top performing Healthcare sector stocks on the move are


|
||||||||||||||||||||||||||||||||||||||||||||||||
| 12Stocks.com: Investing in Healthcare Sector using Exchange Traded Funds | |
|
The following table shows list of key exchange traded funds (ETF) that
help investors track Healthcare Index. For detailed view, check out our ETF Funds section of our website. Quick View: Move mouse or cursor over ETF symbol (ticker) to view short-term Technical chart and over ETF name to view long term chart. Click on ticker or stock name for detailed view. Click on to add stock symbol to your watchlist and to view watchlist. |
12Stocks.com List of ETFs that track Healthcare Index
| Ticker | ETF Name | Watchlist | Recent Price | Smart Investing & Trading Score | Change % | Week % | Year-to-date % |
| XLV | Health Care | | 139.92 | 38 | -0.67 | 0.7 | 2.6% |
| XBI | Biotech | | 82.22 | 25 | -2.05 | -0.74 | -7.92% |
| IBB | Biotechnology | | 125.67 | 18 | -1.64 | 0.76 | -7.49% |
| BBH | Biotech | | 154.61 | 49 | -1.73 | 1.48 | -6.47% |
| VHT | Health Care | | 255.24 | 45 | -0.79 | 0.75 | 1.81% |
| IYH | Healthcare | | 58.68 | 45 | -0.69 | 0.89 | 2.5% |
| IHF | Healthcare Providers | | 52.11 | 55 | -0.29 | -0.19 | -0.76% |
| IHI | Medical Devices | | 55.27 | 43 | -0.66 | 1.67 | 2.41% |
| BIB | Biotechnology | | 48.83 | 32 | -2.69 | 1.31 | -14.41% |
| BIS | Short Biotech | | 20.59 | 61 | 2.49 | -1.46 | 13.95% |
| XHE | Health Care Equipment | | 81.77 | 28 | -1.73 | 0.62 | -2.96% |
| CURE | Healthcare Bull 3X | | 105.32 | 25 | -2.35 | 1.92 | 3.52% |
| LABU | Biotech Bull 3X | | 83.72 | 25 | -6.35 | -2.71 | -31.36% |
| LABD | Biotech Bear 3X | | 11.03 | 75 | 6.36 | 2.13 | 13.83% |
| PSCH | SmallCap Health Care | | 40.31 | 35 | -1.98 | 0.32 | -5.82% |
| XHS | Health Care Services | | 87.68 | 68 | -1.15 | 0.68 | -1.43% |
| PTH | DWA Healthcare Momentum | | 39.60 | 46 | -0.08 | 0.18 | 1.18% |
| BTEC | Principal Healthcare Innovators | | 34.21 | 32 | 0.02 | 1.04 | -5.83% |
| RXL | Health Care | | 94.52 | 17 | -1.55 | 1.39 | 3.41% |
| RXD | Short Health Care | | 11.46 | 71 | 0.98 | -1.59 | -3.94% |
| 12Stocks.com: Charts, Trends, Fundamental Data and Performances of Healthcare Stocks | |
|
We now take in-depth look at all Healthcare stocks including charts, multi-period performances and overall trends (as measured by Smart Investing & Trading Score). One can sort Healthcare stocks (click link to choose) by Daily, Weekly and by Year-to-Date performances. Also, one can sort by size of the company or by market capitalization. |
| Select Your Default Chart Type: | |||||
| |||||
| Click on stock symbol or name for detailed view. Click on to add stock symbol to your watchlist and to view watchlist. Quick View: Move mouse or cursor over "Daily" to quickly view daily Technical stock chart and over "Weekly" to view weekly Technical stock chart. | |||||

 | LNTH Lantheus Holdings, Inc. |
| Sector: Health Care | |
| SubSector: Medical Appliances & Equipment | |
| MarketCap: 467.18 Millions | |
| Recent Price: 65.20 Smart Investing & Trading Score: 81 | |
| Day Percent Change: -0.02% Day Change: -0.01 | |
| Week Change: 2.18% Year-to-date Change: 5.2% | |
| LNTH Links: Profile News Message Board | |
| Charts:- Daily , Weekly | |
| Add LNTH to Watchlist: View: Get Complete LNTH Trend Analysis ➞ | |
 | HCM Hutchison China MediTech Limited |
| Sector: Health Care | |
| SubSector: Drug Manufacturers - Major | |
| MarketCap: 2324.43 Millions | |
| Recent Price: 18.99 Smart Investing & Trading Score: 85 | |
| Day Percent Change: 3.15% Day Change: 0.58 | |
| Week Change: 15.16% Year-to-date Change: 4.9% | |
| HCM Links: Profile News Message Board | |
| Charts:- Daily , Weekly | |
| Add HCM to Watchlist: View: Get Complete HCM Trend Analysis ➞ | |
 | KOD Kodiak Sciences Inc. |
| Sector: Health Care | |
| SubSector: Biotechnology | |
| MarketCap: 2132.15 Millions | |
| Recent Price: 3.18 Smart Investing & Trading Score: 10 | |
| Day Percent Change: -5.92% Day Change: -0.20 | |
| Week Change: -5.36% Year-to-date Change: 4.6% | |
| KOD Links: Profile News Message Board | |
| Charts:- Daily , Weekly | |
| Add KOD to Watchlist: View: Get Complete KOD Trend Analysis ➞ | |
 | WST West Pharmaceutical Services, Inc. |
| Sector: Health Care | |
| SubSector: Medical Instruments & Supplies | |
| MarketCap: 9989 Millions | |
| Recent Price: 368.18 Smart Investing & Trading Score: 61 | |
| Day Percent Change: -4.55% Day Change: -17.55 | |
| Week Change: -1.04% Year-to-date Change: 4.6% | |
| WST Links: Profile News Message Board | |
| Charts:- Daily , Weekly | |
| Add WST to Watchlist: View: Get Complete WST Trend Analysis ➞ | |
 | NBIX Neurocrine Biosciences, Inc. |
| Sector: Health Care | |
| SubSector: Biotechnology | |
| MarketCap: 7897.85 Millions | |
| Recent Price: 137.76 Smart Investing & Trading Score: 63 | |
| Day Percent Change: -0.87% Day Change: -1.21 | |
| Week Change: 4.36% Year-to-date Change: 4.6% | |
| NBIX Links: Profile News Message Board | |
| Charts:- Daily , Weekly | |
| Add NBIX to Watchlist: View: Get Complete NBIX Trend Analysis ➞ | |
 | ENSG The Ensign Group, Inc. |
| Sector: Health Care | |
| SubSector: Long-Term Care Facilities | |
| MarketCap: 2053.76 Millions | |
| Recent Price: 117.29 Smart Investing & Trading Score: 51 | |
| Day Percent Change: -1.14% Day Change: -1.35 | |
| Week Change: -0.82% Year-to-date Change: 4.5% | |
| ENSG Links: Profile News Message Board | |
| Charts:- Daily , Weekly | |
| Add ENSG to Watchlist: View: Get Complete ENSG Trend Analysis ➞ | |
 | PGEN Precigen, Inc. |
| Sector: Health Care | |
| SubSector: Biotechnology | |
| MarketCap: 564.785 Millions | |
| Recent Price: 1.40 Smart Investing & Trading Score: 55 | |
| Day Percent Change: -1.41% Day Change: -0.02 | |
| Week Change: 5.26% Year-to-date Change: 4.5% | |
| PGEN Links: Profile News Message Board | |
| Charts:- Daily , Weekly | |
| Add PGEN to Watchlist: View: Get Complete PGEN Trend Analysis ➞ | |
 | BAX Baxter International Inc. |
| Sector: Health Care | |
| SubSector: Medical Instruments & Supplies | |
| MarketCap: 39955.8 Millions | |
| Recent Price: 40.23 Smart Investing & Trading Score: 53 | |
| Day Percent Change: -1.71% Day Change: -0.70 | |
| Week Change: 1.93% Year-to-date Change: 4.1% | |
| BAX Links: Profile News Message Board | |
| Charts:- Daily , Weekly | |
| Add BAX to Watchlist: View: Get Complete BAX Trend Analysis ➞ | |
 | HALO Halozyme Therapeutics, Inc. |
| Sector: Health Care | |
| SubSector: Biotechnology | |
| MarketCap: 2383.75 Millions | |
| Recent Price: 38.46 Smart Investing & Trading Score: 68 | |
| Day Percent Change: -1.69% Day Change: -0.66 | |
| Week Change: -0.47% Year-to-date Change: 4.1% | |
| HALO Links: Profile News Message Board | |
| Charts:- Daily , Weekly | |
| Add HALO to Watchlist: View: Get Complete HALO Trend Analysis ➞ | |
 | IRTC iRhythm Technologies, Inc. |
| Sector: Health Care | |
| SubSector: Medical Instruments & Supplies | |
| MarketCap: 2167.9 Millions | |
| Recent Price: 111.27 Smart Investing & Trading Score: 67 | |
| Day Percent Change: -4.43% Day Change: -5.16 | |
| Week Change: -0.73% Year-to-date Change: 4.0% | |
| IRTC Links: Profile News Message Board | |
| Charts:- Daily , Weekly | |
| Add IRTC to Watchlist: View: Get Complete IRTC Trend Analysis ➞ | |
 | CYH Community Health Systems, Inc. |
| Sector: Health Care | |
| SubSector: Hospitals | |
| MarketCap: 371.546 Millions | |
| Recent Price: 3.25 Smart Investing & Trading Score: 74 | |
| Day Percent Change: 7.26% Day Change: 0.22 | |
| Week Change: 13.64% Year-to-date Change: 3.8% | |
| CYH Links: Profile News Message Board | |
| Charts:- Daily , Weekly | |
| Add CYH to Watchlist: View: Get Complete CYH Trend Analysis ➞ | |
 | BLFS BioLife Solutions, Inc. |
| Sector: Health Care | |
| SubSector: Medical Instruments & Supplies | |
| MarketCap: 264.36 Millions | |
| Recent Price: 16.86 Smart Investing & Trading Score: 86 | |
| Day Percent Change: -1.92% Day Change: -0.33 | |
| Week Change: 6.31% Year-to-date Change: 3.8% | |
| BLFS Links: Profile News Message Board | |
| Charts:- Daily , Weekly | |
| Add BLFS to Watchlist: View: Get Complete BLFS Trend Analysis ➞ | |
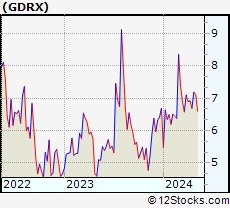 | GDRX GoodRx Holdings, Inc. |
| Sector: Health Care | |
| SubSector: Health Information Services | |
| MarketCap: 15197 Millions | |
| Recent Price: 6.94 Smart Investing & Trading Score: 71 | |
| Day Percent Change: -0.29% Day Change: -0.02 | |
| Week Change: 3.74% Year-to-date Change: 3.7% | |
| GDRX Links: Profile News Message Board | |
| Charts:- Daily , Weekly | |
| Add GDRX to Watchlist: View: Get Complete GDRX Trend Analysis ➞ | |
 | RPHM Reneo Pharmaceuticals, Inc. |
| Sector: Health Care | |
| SubSector: Biotechnology | |
| MarketCap: 233 Millions | |
| Recent Price: 1.68 Smart Investing & Trading Score: 43 | |
| Day Percent Change: 0.30% Day Change: 0.00 | |
| Week Change: -3.45% Year-to-date Change: 3.7% | |
| RPHM Links: Profile News Message Board | |
| Charts:- Daily , Weekly | |
| Add RPHM to Watchlist: View: Get Complete RPHM Trend Analysis ➞ | |
 | FATE Fate Therapeutics, Inc. |
| Sector: Health Care | |
| SubSector: Biotechnology | |
| MarketCap: 2022.45 Millions | |
| Recent Price: 3.87 Smart Investing & Trading Score: 15 | |
| Day Percent Change: -10.00% Day Change: -0.43 | |
| Week Change: -19.21% Year-to-date Change: 3.5% | |
| FATE Links: Profile News Message Board | |
| Charts:- Daily , Weekly | |
| Add FATE to Watchlist: View: Get Complete FATE Trend Analysis ➞ | |
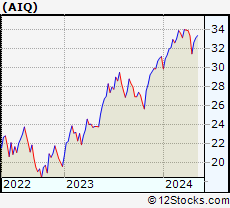 | AIQ Alliance Healthcare Services, Inc. |
| Sector: Health Care | |
| SubSector: Medical Laboratories & Research | |
| MarketCap: 105.79 Millions | |
| Recent Price: 32.19 Smart Investing & Trading Score: 44 | |
| Day Percent Change: -0.83% Day Change: -0.27 | |
| Week Change: 2.32% Year-to-date Change: 3.2% | |
| AIQ Links: Profile News Message Board | |
| Charts:- Daily , Weekly | |
| Add AIQ to Watchlist: View: Get Complete AIQ Trend Analysis ➞ | |
 | CTMX CytomX Therapeutics, Inc. |
| Sector: Health Care | |
| SubSector: Biotechnology | |
| MarketCap: 264.885 Millions | |
| Recent Price: 1.60 Smart Investing & Trading Score: 44 | |
| Day Percent Change: -1.84% Day Change: -0.03 | |
| Week Change: -4.19% Year-to-date Change: 3.2% | |
| CTMX Links: Profile News Message Board | |
| Charts:- Daily , Weekly | |
| Add CTMX to Watchlist: View: Get Complete CTMX Trend Analysis ➞ | |
 | HAE Haemonetics Corporation |
| Sector: Health Care | |
| SubSector: Medical Instruments & Supplies | |
| MarketCap: 4500.7 Millions | |
| Recent Price: 87.66 Smart Investing & Trading Score: 100 | |
| Day Percent Change: 1.67% Day Change: 1.44 | |
| Week Change: 7.9% Year-to-date Change: 2.5% | |
| HAE Links: Profile News Message Board | |
| Charts:- Daily , Weekly | |
| Add HAE to Watchlist: View: Get Complete HAE Trend Analysis ➞ | |
 | GPCR Structure Therapeutics Inc. |
| Sector: Health Care | |
| SubSector: Biotechnology | |
| MarketCap: 1530 Millions | |
| Recent Price: 38.98 Smart Investing & Trading Score: 27 | |
| Day Percent Change: 8.13% Day Change: 2.93 | |
| Week Change: 7.21% Year-to-date Change: 2.4% | |
| GPCR Links: Profile News Message Board | |
| Charts:- Daily , Weekly | |
| Add GPCR to Watchlist: View: Get Complete GPCR Trend Analysis ➞ | |
 | LQDA Liquidia Technologies, Inc. |
| Sector: Health Care | |
| SubSector: Biotechnology | |
| MarketCap: 80.4785 Millions | |
| Recent Price: 12.31 Smart Investing & Trading Score: 23 | |
| Day Percent Change: -1.91% Day Change: -0.24 | |
| Week Change: -7.51% Year-to-date Change: 2.3% | |
| LQDA Links: Profile News Message Board | |
| Charts:- Daily , Weekly | |
| Add LQDA to Watchlist: View: Get Complete LQDA Trend Analysis ➞ | |
 | VMD Viemed Healthcare, Inc. |
| Sector: Health Care | |
| SubSector: Medical Appliances & Equipment | |
| MarketCap: 177.28 Millions | |
| Recent Price: 8.02 Smart Investing & Trading Score: 25 | |
| Day Percent Change: -0.87% Day Change: -0.07 | |
| Week Change: 1.78% Year-to-date Change: 2.2% | |
| VMD Links: Profile News Message Board | |
| Charts:- Daily , Weekly | |
| Add VMD to Watchlist: View: Get Complete VMD Trend Analysis ➞ | |
 | HLN Haleon plc |
| Sector: Health Care | |
| SubSector: Drug Manufacturers - Specialty & Generic | |
| MarketCap: 38310 Millions | |
| Recent Price: 8.40 Smart Investing & Trading Score: 76 | |
| Day Percent Change: 0.60% Day Change: 0.05 | |
| Week Change: 2.19% Year-to-date Change: 2.1% | |
| HLN Links: Profile News Message Board | |
| Charts:- Daily , Weekly | |
| Add HLN to Watchlist: View: Get Complete HLN Trend Analysis ➞ | |
 | SOPH SOPHiA GENETICS SA |
| Sector: Health Care | |
| SubSector: Health Information Services | |
| MarketCap: 278 Millions | |
| Recent Price: 4.95 Smart Investing & Trading Score: 53 | |
| Day Percent Change: -1.20% Day Change: -0.06 | |
| Week Change: -0.2% Year-to-date Change: 2.1% | |
| SOPH Links: Profile News Message Board | |
| Charts:- Daily , Weekly | |
| Add SOPH to Watchlist: View: Get Complete SOPH Trend Analysis ➞ | |
 | VBIV VBI Vaccines Inc. |
| Sector: Health Care | |
| SubSector: Biotechnology | |
| MarketCap: 139.785 Millions | |
| Recent Price: 0.60 Smart Investing & Trading Score: 17 | |
| Day Percent Change: 1.59% Day Change: 0.01 | |
| Week Change: -5.41% Year-to-date Change: 2.0% | |
| VBIV Links: Profile News Message Board | |
| Charts:- Daily , Weekly | |
| Add VBIV to Watchlist: View: Get Complete VBIV Trend Analysis ➞ | |
 | CNC Centene Corporation |
| Sector: Health Care | |
| SubSector: Health Care Plans | |
| MarketCap: 29075 Millions | |
| Recent Price: 75.68 Smart Investing & Trading Score: 93 | |
| Day Percent Change: -0.67% Day Change: -0.51 | |
| Week Change: 0.71% Year-to-date Change: 2.0% | |
| CNC Links: Profile News Message Board | |
| Charts:- Daily , Weekly | |
| Add CNC to Watchlist: View: Get Complete CNC Trend Analysis ➞ | |
| For tabular summary view of above stock list: Summary View ➞ 0 - 25 , 25 - 50 , 50 - 75 , 75 - 100 , 100 - 125 , 125 - 150 , 150 - 175 , 175 - 200 , 200 - 225 , 225 - 250 , 250 - 275 , 275 - 300 , 300 - 325 , 325 - 350 , 350 - 375 , 375 - 400 , 400 - 425 , 425 - 450 , 450 - 475 , 475 - 500 , 500 - 525 , 525 - 550 , 550 - 575 , 575 - 600 , 600 - 625 , 625 - 650 , 650 - 675 , 675 - 700 , 700 - 725 | ||
| Click To Change The Sort Order: By Market Cap or Company Size Performance: Year-to-date, Week and Day | |
| Select Chart Type: | ||
|
Best Stocks Today 12Stocks.com |
© 2024 12Stocks.com Terms & Conditions Privacy Contact Us
All Information Provided Only For Education And Not To Be Used For Investing or Trading. See Terms & Conditions


One More Thing ... Get Best Stocks Delivered Daily!
Never Ever Miss A Move With Our Top Ten Stocks Lists
Find Best Stocks In Any Market - Bull or Bear Market
Take A Peek At Our Top Ten Stocks Lists: Daily, Weekly, Year-to-Date & Top Trends
Find Best Stocks In Any Market - Bull or Bear Market
Take A Peek At Our Top Ten Stocks Lists: Daily, Weekly, Year-to-Date & Top Trends
Healthcare Stocks With Best Up Trends [0-bearish to 100-bullish]: AstraZeneca [100], Merck [100], Annovis Bio[100], Haemonetics [100], Tandem Diabetes[100], Boston Scientific[100], Agios [100], Agenus [95], Mesoblast [95], Cullinan Oncology[93], Avadel [93]
Best Healthcare Stocks Year-to-Date:
Pieris [6273.63%], Precision BioSciences[2590.41%], Inovio [1885.29%], Assembly Biosciences[1529.07%], Aurora Cannabis[1311.17%], NuCana [1198.17%], Adverum Biotechnologies[1147.34%], Agenus [902.54%], Affimed N.V[680.8%], CareMax [490.72%], Mesoblast [459.09%] Best Healthcare Stocks This Week:
Pieris [7900%], Agenus [56.31%], VolitionRx [44.5%], ProKidney [32.84%], Seres [32.65%], Annovis Bio[30%], BeyondSpring [26.11%], Cullinan Oncology[22.92%], Pharvaris N.V[18.84%], OptiNose [18.42%], GeneDx [18.15%] Best Healthcare Stocks Daily:
OptiNose [14.56%], Galera [13.74%], Agenus [11.86%], VolitionRx [11.26%], ADiTx [10.57%], Apollomics [9.94%], Pharming [9.06%], Structure [8.13%], Pharvaris N.V[7.91%], ProKidney [7.75%], Community Health[7.26%]