
 Login Sign Up


| |||||
 |  | ||||

| 12Stocks.com Market Intelligence |
Best Healthcare Stocks
 | "Discover best trending healthcare stocks with 12Stocks.com." |
| - Subu Vdaygiri, Founder, 12Stocks.com |
| In a hurry? Healthcare Stocks Lists: Performance Trends Table, Stock Charts
Sort Healthcare stocks: Daily, Weekly, Year-to-Date, Market Cap & Trends. Filter Healthcare stocks list by size:All Healthcare Large Mid-Range Small |
| 12Stocks.com Healthcare Stocks Performances & Trends Daily | |||||||||
|
|  The overall Smart Investing & Trading Score is 52 (0-bearish to 100-bullish) which puts Healthcare sector in short term neutral trend. The Smart Investing & Trading Score from previous trading session is 38 and hence an improvement of trend.
| ||||||||
Here are the Smart Investing & Trading Scores of the most requested Healthcare stocks at 12Stocks.com (click stock name for detailed review):
|


| 12Stocks.com: Investing in Healthcare sector with Stocks | |
|
The following table helps investors and traders sort through current performance and trends (as measured by Smart Investing & Trading Score) of various
stocks in the Healthcare sector. Quick View: Move mouse or cursor over stock symbol (ticker) to view short-term Technical chart and over stock name to view long term chart. Click on  to add stock symbol to your watchlist and to add stock symbol to your watchlist and  to view watchlist. Click on any ticker or stock name for detailed market intelligence report for that stock. to view watchlist. Click on any ticker or stock name for detailed market intelligence report for that stock. |
12Stocks.com Performance of Stocks in Healthcare Sector
| Ticker | Stock Name | Watchlist | Category | Recent Price | Smart Investing & Trading Score | Change % | YTD Change% |
| CPRX | Catalyst |   | Biotechnology | 15.14 | 34 | 0.20% | -9.93% |
| NUVL | Nuvalent | | Biotechnology | 66.19 | 42 | 2.64% | -9.93% |
| SNN | Smith & Nephew | | Equipment | 24.50 | 57 | 0.60% | -10.17% |
| RGNX | REGENXBIO | | Biotechnology | 16.11 | 43 | 3.01% | -10.25% |
| ILMN | Illumina | | Biotechnology | 124.87 | 42 | 3.84% | -10.32% |
| JAZZ | Jazz | | Biotechnology | 110.22 | 25 | 1.27% | -10.39% |
| MNOV | MediciNova | | Biotechnology | 1.34 | 10 | 0.00% | -10.67% |
| HLTH | Nobilis Health | | Hospitals | 0.14 | 42 | 4.32% | -10.77% |
| IRMD | IRadimed | | Equipment | 42.34 | 83 | 0.14% | -10.80% |
| CVS | CVS Health | | Insurance | 70.00 | 32 | 0.52% | -11.35% |
| XENE | Xenon | | Biotechnology | 40.76 | 7 | 1.90% | -11.51% |
| ZIMV | ZimVie | | Medical Devices | 15.65 | 32 | 1.03% | -11.68% |
| TMCI | Treace | | Medical Devices | 11.20 | 20 | 0.90% | -12.09% |
| IDXX | IDEXX | | Diagnostic | 487.57 | 32 | 1.67% | -12.16% |
| DOCS | Doximity | | Health Information | 24.96 | 22 | 0.69% | -12.21% |
| OLK | Olink Holding | | Diagnostics & Research | 22.09 | 20 | 0.27% | -12.27% |
| ALKS | Alkermes | | Biotechnology | 24.29 | 32 | 0.91% | -12.44% |
| LAKE | Lakeland Industries | | Instruments | 16.23 | 37 | -0.40% | -12.46% |
| XNCR | Xencor | | Biotechnology | 18.58 | 10 | 2.03% | -12.48% |
| BLCO | Bausch + | | Instruments | 14.81 | 65 | 1.13% | -12.91% |
| EGRX | Eagle | | Pharmaceutical | 4.54 | 42 | -0.22% | -13.19% |
| PHAR | Pharming | | Biotechnology | 9.92 | 0 | 0.00% | -13.21% |
| EXAS | Exact Sciences | | Laboratories | 64.12 | 17 | 2.74% | -13.33% |
| XRAY | DENTSPLY SIRONA | | Instruments | 30.57 | 25 | 0.66% | -14.11% |
| NVCT | Nuvectis Pharma | | Biotechnology | 7.10 | 39 | 0.00% | -14.15% |
| For chart view version of above stock list: Chart View ➞ 0 - 25 , 25 - 50 , 50 - 75 , 75 - 100 , 100 - 125 , 125 - 150 , 150 - 175 , 175 - 200 , 200 - 225 , 225 - 250 , 250 - 275 , 275 - 300 , 300 - 325 , 325 - 350 , 350 - 375 , 375 - 400 , 400 - 425 , 425 - 450 , 450 - 475 | ||
 | Click To Change The Sort Order: By Market Cap or Company Size Performance: Year-to-date, Week and Day |  |
|
Get the most comprehensive stock market coverage daily at 12Stocks.com ➞ Best Stocks Today ➞ Best Stocks Weekly ➞ Best Stocks Year-to-Date ➞ Best Stocks Trends ➞  Best Stocks Today 12Stocks.com Best Nasdaq Stocks ➞ Best S&P 500 Stocks ➞ Best Tech Stocks ➞ Best Biotech Stocks ➞ |
| Detailed Overview of Healthcare Stocks |
| Healthcare Technical Overview, Leaders & Laggards, Top Healthcare ETF Funds & Detailed Healthcare Stocks List, Charts, Trends & More |
| Healthcare Sector: Technical Analysis, Trends & YTD Performance | |
| Healthcare sector is composed of stocks
from pharmaceutical, biotech, diagnostics labs, insurance providers
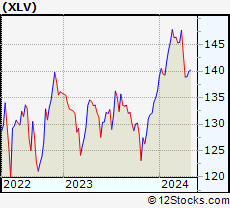
and healthcare services. Healthcare sector, as represented by XLV, an exchange-traded fund [ETF] that holds basket of Healthcare stocks (e.g, Merck, Amgen) is up by 3.33% and is currently underperforming the overall market by -1.81% year-to-date. Below is a quick view of Technical charts and trends: |
|
 XLV Weekly Chart |
|
| Long Term Trend: Good | |
| Medium Term Trend: Not Good | |
 XLV Daily Chart |
|
| Short Term Trend: Very Good | |
| Overall Trend Score: 52 | |
| YTD Performance: 3.33% | |
| **Trend Scores & Views Are Only For Educational Purposes And Not For Investing | |
| 12Stocks.com: Top Performing Healthcare Sector Stocks | ||||||||||||||||||||||||||||||||||||||||||||||||
 The top performing Healthcare sector stocks year to date are
Now, more recently, over last week, the top performing Healthcare sector stocks on the move are


|
||||||||||||||||||||||||||||||||||||||||||||||||
| 12Stocks.com: Investing in Healthcare Sector using Exchange Traded Funds | |
|
The following table shows list of key exchange traded funds (ETF) that
help investors track Healthcare Index. For detailed view, check out our ETF Funds section of our website. Quick View: Move mouse or cursor over ETF symbol (ticker) to view short-term Technical chart and over ETF name to view long term chart. Click on ticker or stock name for detailed view. Click on to add stock symbol to your watchlist and to view watchlist. |
12Stocks.com List of ETFs that track Healthcare Index
| Ticker | ETF Name | Watchlist | Recent Price | Smart Investing & Trading Score | Change % | Week % | Year-to-date % |
| XLV | Health Care | | 140.92 | 52 | 1.03 | 1.42 | 3.33% |
| XBI | Biotech | | 85.56 | 17 | 3.32 | 3.29 | -4.18% |
| IBB | Biotechnology | | 128.29 | 32 | 1.73 | 2.86 | -5.56% |
| BBH | Biotech | | 154.59 | 32 | 0.02 | 1.46 | -6.48% |
| VHT | Health Care | | 256.89 | 25 | 0.93 | 1.41 | 2.47% |
| IYH | Healthcare | | 59.06 | 45 | 1.08 | 1.55 | 3.17% |
| IHF | Healthcare Providers | | 52.49 | 90 | 0.80 | 0.54 | -0.04% |
| IHI | Medical Devices | | 55.18 | 30 | 0.88 | 1.51 | 2.24% |
| BIB | Biotechnology | | 49.11 | 32 | 0.02 | 1.89 | -13.92% |
| BIS | Short Biotech | | 20.48 | 68 | 0.05 | -1.99 | 13.34% |
| CURE | Healthcare Bull 3X | | 106.88 | 32 | 2.33 | 3.44 | 5.05% |
| LABU | Biotech Bull 3X | | 94.02 | 17 | 8.78 | 9.26 | -22.92% |
| LABD | Biotech Bear 3X | | 9.75 | 88 | -9.30 | -9.72 | 0.62% |
| RXL | Health Care | | 93.91 | 25 | -1.48 | 0.74 | 2.74% |
| 12Stocks.com: Charts, Trends, Fundamental Data and Performances of Healthcare Stocks | |
|
We now take in-depth look at all Healthcare stocks including charts, multi-period performances and overall trends (as measured by Smart Investing & Trading Score). One can sort Healthcare stocks (click link to choose) by Daily, Weekly and by Year-to-Date performances. Also, one can sort by size of the company or by market capitalization. |
| Select Your Default Chart Type: | |||||
| |||||
| Click on stock symbol or name for detailed view. Click on to add stock symbol to your watchlist and to view watchlist. Quick View: Move mouse or cursor over "Daily" to quickly view daily Technical stock chart and over "Weekly" to view weekly Technical stock chart. | |||||

 | CPRX Catalyst Pharmaceuticals, Inc. |
| Sector: Health Care | |
| SubSector: Biotechnology | |
| MarketCap: 365.185 Millions | |
| Recent Price: 15.14 Smart Investing & Trading Score: 34 | |
| Day Percent Change: 0.20% Day Change: 0.03 | |
| Week Change: 0.07% Year-to-date Change: -9.9% | |
| CPRX Links: Profile News Message Board | |
| Charts:- Daily , Weekly | |
| Add CPRX to Watchlist: View: Get Complete CPRX Trend Analysis ➞ | |
 | NUVL Nuvalent, Inc. |
| Sector: Health Care | |
| SubSector: Biotechnology | |
| MarketCap: 2400 Millions | |
| Recent Price: 66.19 Smart Investing & Trading Score: 42 | |
| Day Percent Change: 2.64% Day Change: 1.70 | |
| Week Change: 5.47% Year-to-date Change: -9.9% | |
| NUVL Links: Profile News Message Board | |
| Charts:- Daily , Weekly | |
| Add NUVL to Watchlist: View: Get Complete NUVL Trend Analysis ➞ | |
 | SNN Smith & Nephew plc |
| Sector: Health Care | |
| SubSector: Medical Appliances & Equipment | |
| MarketCap: 15180.8 Millions | |
| Recent Price: 24.50 Smart Investing & Trading Score: 57 | |
| Day Percent Change: 0.60% Day Change: 0.14 | |
| Week Change: 2.79% Year-to-date Change: -10.2% | |
| SNN Links: Profile News Message Board | |
| Charts:- Daily , Weekly | |
| Add SNN to Watchlist: View: Get Complete SNN Trend Analysis ➞ | |
 | RGNX REGENXBIO Inc. |
| Sector: Health Care | |
| SubSector: Biotechnology | |
| MarketCap: 1232.85 Millions | |
| Recent Price: 16.11 Smart Investing & Trading Score: 43 | |
| Day Percent Change: 3.01% Day Change: 0.47 | |
| Week Change: 2.68% Year-to-date Change: -10.3% | |
| RGNX Links: Profile News Message Board | |
| Charts:- Daily , Weekly | |
| Add RGNX to Watchlist: View: Get Complete RGNX Trend Analysis ➞ | |
 | ILMN Illumina, Inc. |
| Sector: Health Care | |
| SubSector: Biotechnology | |
| MarketCap: 39194.3 Millions | |
| Recent Price: 124.87 Smart Investing & Trading Score: 42 | |
| Day Percent Change: 3.84% Day Change: 4.62 | |
| Week Change: 6.34% Year-to-date Change: -10.3% | |
| ILMN Links: Profile News Message Board | |
| Charts:- Daily , Weekly | |
| Add ILMN to Watchlist: View: Get Complete ILMN Trend Analysis ➞ | |
 | JAZZ Jazz Pharmaceuticals plc |
| Sector: Health Care | |
| SubSector: Biotechnology | |
| MarketCap: 5576.05 Millions | |
| Recent Price: 110.22 Smart Investing & Trading Score: 25 | |
| Day Percent Change: 1.27% Day Change: 1.39 | |
| Week Change: 0.25% Year-to-date Change: -10.4% | |
| JAZZ Links: Profile News Message Board | |
| Charts:- Daily , Weekly | |
| Add JAZZ to Watchlist: View: Get Complete JAZZ Trend Analysis ➞ | |
 | MNOV MediciNova, Inc. |
| Sector: Health Care | |
| SubSector: Biotechnology | |
| MarketCap: 137.685 Millions | |
| Recent Price: 1.34 Smart Investing & Trading Score: 10 | |
| Day Percent Change: 0.00% Day Change: 0.00 | |
| Week Change: -3.6% Year-to-date Change: -10.7% | |
| MNOV Links: Profile News Message Board | |
| Charts:- Daily , Weekly | |
| Add MNOV to Watchlist: View: Get Complete MNOV Trend Analysis ➞ | |
 | HLTH Nobilis Health Corp. |
| Sector: Health Care | |
| SubSector: Hospitals | |
| MarketCap: 124.22 Millions | |
| Recent Price: 0.14 Smart Investing & Trading Score: 42 | |
| Day Percent Change: 4.32% Day Change: 0.01 | |
| Week Change: -0.07% Year-to-date Change: -10.8% | |
| HLTH Links: Profile News Message Board | |
| Charts:- Daily , Weekly | |
| Add HLTH to Watchlist: View: Get Complete HLTH Trend Analysis ➞ | |
 | IRMD IRadimed Corporation |
| Sector: Health Care | |
| SubSector: Medical Appliances & Equipment | |
| MarketCap: 207.78 Millions | |
| Recent Price: 42.34 Smart Investing & Trading Score: 83 | |
| Day Percent Change: 0.14% Day Change: 0.06 | |
| Week Change: 3.28% Year-to-date Change: -10.8% | |
| IRMD Links: Profile News Message Board | |
| Charts:- Daily , Weekly | |
| Add IRMD to Watchlist: View: Get Complete IRMD Trend Analysis ➞ | |
 | CVS CVS Health Corporation |
| Sector: Health Care | |
| SubSector: Health Care Plans | |
| MarketCap: 80104.3 Millions | |
| Recent Price: 70.00 Smart Investing & Trading Score: 32 | |
| Day Percent Change: 0.52% Day Change: 0.37 | |
| Week Change: 0.35% Year-to-date Change: -11.4% | |
| CVS Links: Profile News Message Board | |
| Charts:- Daily , Weekly | |
| Add CVS to Watchlist: View: Get Complete CVS Trend Analysis ➞ | |
 | XENE Xenon Pharmaceuticals Inc. |
| Sector: Health Care | |
| SubSector: Biotechnology | |
| MarketCap: 388.585 Millions | |
| Recent Price: 40.76 Smart Investing & Trading Score: 7 | |
| Day Percent Change: 1.90% Day Change: 0.76 | |
| Week Change: 2.21% Year-to-date Change: -11.5% | |
| XENE Links: Profile News Message Board | |
| Charts:- Daily , Weekly | |
| Add XENE to Watchlist: View: Get Complete XENE Trend Analysis ➞ | |
 | ZIMV ZimVie Inc. |
| Sector: Health Care | |
| SubSector: Medical Devices | |
| MarketCap: 303 Millions | |
| Recent Price: 15.65 Smart Investing & Trading Score: 32 | |
| Day Percent Change: 1.03% Day Change: 0.16 | |
| Week Change: 1.43% Year-to-date Change: -11.7% | |
| ZIMV Links: Profile News Message Board | |
| Charts:- Daily , Weekly | |
| Add ZIMV to Watchlist: View: Get Complete ZIMV Trend Analysis ➞ | |
 | TMCI Treace Medical Concepts, Inc. |
| Sector: Health Care | |
| SubSector: Medical Devices | |
| MarketCap: 1550 Millions | |
| Recent Price: 11.20 Smart Investing & Trading Score: 20 | |
| Day Percent Change: 0.90% Day Change: 0.10 | |
| Week Change: 2.1% Year-to-date Change: -12.1% | |
| TMCI Links: Profile News Message Board | |
| Charts:- Daily , Weekly | |
| Add TMCI to Watchlist: View: Get Complete TMCI Trend Analysis ➞ | |
 | IDXX IDEXX Laboratories, Inc. |
| Sector: Health Care | |
| SubSector: Diagnostic Substances | |
| MarketCap: 15937.1 Millions | |
| Recent Price: 487.57 Smart Investing & Trading Score: 32 | |
| Day Percent Change: 1.67% Day Change: 8.00 | |
| Week Change: 2.36% Year-to-date Change: -12.2% | |
| IDXX Links: Profile News Message Board | |
| Charts:- Daily , Weekly | |
| Add IDXX to Watchlist: View: Get Complete IDXX Trend Analysis ➞ | |
 | DOCS Doximity, Inc. |
| Sector: Health Care | |
| SubSector: Health Information Services | |
| MarketCap: 6540 Millions | |
| Recent Price: 24.96 Smart Investing & Trading Score: 22 | |
| Day Percent Change: 0.69% Day Change: 0.17 | |
| Week Change: 1.34% Year-to-date Change: -12.2% | |
| DOCS Links: Profile News Message Board | |
| Charts:- Daily , Weekly | |
| Add DOCS to Watchlist: View: Get Complete DOCS Trend Analysis ➞ | |
 | OLK Olink Holding AB (publ) |
| Sector: Health Care | |
| SubSector: Diagnostics & Research | |
| MarketCap: 2370 Millions | |
| Recent Price: 22.09 Smart Investing & Trading Score: 20 | |
| Day Percent Change: 0.27% Day Change: 0.06 | |
| Week Change: 1.01% Year-to-date Change: -12.3% | |
| OLK Links: Profile News Message Board | |
| Charts:- Daily , Weekly | |
| Add OLK to Watchlist: View: Get Complete OLK Trend Analysis ➞ | |
 | ALKS Alkermes plc |
| Sector: Health Care | |
| SubSector: Biotechnology | |
| MarketCap: 2311.95 Millions | |
| Recent Price: 24.29 Smart Investing & Trading Score: 32 | |
| Day Percent Change: 0.91% Day Change: 0.22 | |
| Week Change: 1.84% Year-to-date Change: -12.4% | |
| ALKS Links: Profile News Message Board | |
| Charts:- Daily , Weekly | |
| Add ALKS to Watchlist: View: Get Complete ALKS Trend Analysis ➞ | |
 | LAKE Lakeland Industries, Inc. |
| Sector: Health Care | |
| SubSector: Medical Instruments & Supplies | |
| MarketCap: 138.16 Millions | |
| Recent Price: 16.23 Smart Investing & Trading Score: 37 | |
| Day Percent Change: -0.40% Day Change: -0.07 | |
| Week Change: -1.52% Year-to-date Change: -12.5% | |
| LAKE Links: Profile News Message Board | |
| Charts:- Daily , Weekly | |
| Add LAKE to Watchlist: View: Get Complete LAKE Trend Analysis ➞ | |
 | XNCR Xencor, Inc. |
| Sector: Health Care | |
| SubSector: Biotechnology | |
| MarketCap: 1744.35 Millions | |
| Recent Price: 18.58 Smart Investing & Trading Score: 10 | |
| Day Percent Change: 2.03% Day Change: 0.37 | |
| Week Change: 1.09% Year-to-date Change: -12.5% | |
| XNCR Links: Profile News Message Board | |
| Charts:- Daily , Weekly | |
| Add XNCR to Watchlist: View: Get Complete XNCR Trend Analysis ➞ | |
 | BLCO Bausch + Lomb Corporation |
| Sector: Health Care | |
| SubSector: Medical Instruments & Supplies | |
| MarketCap: 7100 Millions | |
| Recent Price: 14.81 Smart Investing & Trading Score: 65 | |
| Day Percent Change: 1.13% Day Change: 0.16 | |
| Week Change: 1.13% Year-to-date Change: -12.9% | |
| BLCO Links: Profile News Message Board | |
| Charts:- Daily , Weekly | |
| Add BLCO to Watchlist: View: Get Complete BLCO Trend Analysis ➞ | |
 | EGRX Eagle Pharmaceuticals, Inc. |
| Sector: Health Care | |
| SubSector: Drugs - Generic | |
| MarketCap: 573.385 Millions | |
| Recent Price: 4.54 Smart Investing & Trading Score: 42 | |
| Day Percent Change: -0.22% Day Change: -0.01 | |
| Week Change: -1.52% Year-to-date Change: -13.2% | |
| EGRX Links: Profile News Message Board | |
| Charts:- Daily , Weekly | |
| Add EGRX to Watchlist: View: Get Complete EGRX Trend Analysis ➞ | |
 | PHAR Pharming Group N.V. |
| Sector: Health Care | |
| SubSector: Biotechnology | |
| MarketCap: 808 Millions | |
| Recent Price: 9.92 Smart Investing & Trading Score: 0 | |
| Day Percent Change: 0.00% Day Change: 0.00 | |
| Week Change: -0.8% Year-to-date Change: -13.2% | |
| PHAR Links: Profile News Message Board | |
| Charts:- Daily , Weekly | |
| Add PHAR to Watchlist: View: Get Complete PHAR Trend Analysis ➞ | |
 | EXAS Exact Sciences Corporation |
| Sector: Health Care | |
| SubSector: Medical Laboratories & Research | |
| MarketCap: 8572 Millions | |
| Recent Price: 64.12 Smart Investing & Trading Score: 17 | |
| Day Percent Change: 2.74% Day Change: 1.71 | |
| Week Change: 5.18% Year-to-date Change: -13.3% | |
| EXAS Links: Profile News Message Board | |
| Charts:- Daily , Weekly | |
| Add EXAS to Watchlist: View: Get Complete EXAS Trend Analysis ➞ | |
 | XRAY DENTSPLY SIRONA Inc. |
| Sector: Health Care | |
| SubSector: Medical Instruments & Supplies | |
| MarketCap: 7746.1 Millions | |
| Recent Price: 30.57 Smart Investing & Trading Score: 25 | |
| Day Percent Change: 0.66% Day Change: 0.20 | |
| Week Change: 0.23% Year-to-date Change: -14.1% | |
| XRAY Links: Profile News Message Board | |
| Charts:- Daily , Weekly | |
| Add XRAY to Watchlist: View: Get Complete XRAY Trend Analysis ➞ | |
 | NVCT Nuvectis Pharma, Inc. |
| Sector: Health Care | |
| SubSector: Biotechnology | |
| MarketCap: 258 Millions | |
| Recent Price: 7.10 Smart Investing & Trading Score: 39 | |
| Day Percent Change: 0.00% Day Change: 0.00 | |
| Week Change: 4.11% Year-to-date Change: -14.2% | |
| NVCT Links: Profile News Message Board | |
| Charts:- Daily , Weekly | |
| Add NVCT to Watchlist: View: Get Complete NVCT Trend Analysis ➞ | |
| For tabular summary view of above stock list: Summary View ➞ 0 - 25 , 25 - 50 , 50 - 75 , 75 - 100 , 100 - 125 , 125 - 150 , 150 - 175 , 175 - 200 , 200 - 225 , 225 - 250 , 250 - 275 , 275 - 300 , 300 - 325 , 325 - 350 , 350 - 375 , 375 - 400 , 400 - 425 , 425 - 450 , 450 - 475 | ||
| Click To Change The Sort Order: By Market Cap or Company Size Performance: Year-to-date, Week and Day | |
| Select Chart Type: | ||
|
Best Stocks Today 12Stocks.com |
© 2024 12Stocks.com Terms & Conditions Privacy Contact Us
All Information Provided Only For Education And Not To Be Used For Investing or Trading. See Terms & Conditions


One More Thing ... Get Best Stocks Delivered Daily!
Never Ever Miss A Move With Our Top Ten Stocks Lists
Find Best Stocks In Any Market - Bull or Bear Market
Take A Peek At Our Top Ten Stocks Lists: Daily, Weekly, Year-to-Date & Top Trends
Find Best Stocks In Any Market - Bull or Bear Market
Take A Peek At Our Top Ten Stocks Lists: Daily, Weekly, Year-to-Date & Top Trends
Healthcare Stocks With Best Up Trends [0-bearish to 100-bullish]: Quest Diagnostics[100], Fresenius [100], BioMarin [100], Glaukos [100], AstraZeneca [100], Oscar Health[93], Day One[93], GeneDx [90], Agenus [90], Agios [90], DaVita [90]
Best Healthcare Stocks Year-to-Date:
Pieris [6207.69%], Inovio [1998.04%], Assembly Biosciences[1512%], Adverum Biotechnologies[1436.26%], Affimed N.V[700%], Agenus [652.51%], CareMax [611.34%], Corbus [543.38%], Mesoblast [450%], Janux [365.24%], GeneDx [313.24%] Best Healthcare Stocks This Week:
Pieris [7817.24%], MSP Recovery[39.24%], CareMax [34.24%], ProKidney [31.37%], Agenus [17.33%], Molecular Partners[16.87%], GeneDx [16.6%], Mesoblast [16.12%], Regencell Bioscience[16.04%], Syros [15.97%], Prime Medicine[15.3%] Best Healthcare Stocks Daily:
Pieris [7757.63%], Heron [11.39%], PureTech Health[10.55%], Atai Life[9.84%], Ginkgo Bioworks[9.60%], Repligen [9.43%], Mesoblast [9.40%], Prime Medicine[8.79%], BioLife [8.72%], MSP Recovery[8.20%], GeneDx [8.18%]