
 Login Sign Up


| |||||
 |  | ||||

| 12Stocks.com Market Intelligence |
Best Healthcare Stocks
 | "Discover best trending healthcare stocks with 12Stocks.com." |
| - Subu Vdaygiri, Founder, 12Stocks.com |
| In a hurry? Healthcare Stocks Lists: Performance Trends Table, Stock Charts
Sort Healthcare stocks: Daily, Weekly, Year-to-Date, Market Cap & Trends. Filter Healthcare stocks list by size:All Healthcare Large Mid-Range Small |
| 12Stocks.com Healthcare Stocks Performances & Trends Daily | |||||||||
|
|  The overall Smart Investing & Trading Score is 18 (0-bearish to 100-bullish) which puts Healthcare sector in short term bearish trend. The Smart Investing & Trading Score from previous trading session is 10 and an improvement of trend continues.
| ||||||||
Here are the Smart Investing & Trading Scores of the most requested Healthcare stocks at 12Stocks.com (click stock name for detailed review):
|


| 12Stocks.com: Investing in Healthcare sector with Stocks | |
|
The following table helps investors and traders sort through current performance and trends (as measured by Smart Investing & Trading Score) of various
stocks in the Healthcare sector. Quick View: Move mouse or cursor over stock symbol (ticker) to view short-term Technical chart and over stock name to view long term chart. Click on  to add stock symbol to your watchlist and to add stock symbol to your watchlist and  to view watchlist. Click on any ticker or stock name for detailed market intelligence report for that stock. to view watchlist. Click on any ticker or stock name for detailed market intelligence report for that stock. |
12Stocks.com Performance of Stocks in Healthcare Sector
| Ticker | Stock Name | Watchlist | Category | Recent Price | Smart Investing & Trading Score | Change % | YTD Change% |
| COLL | Collegium |   | Pharmaceutical | 34.77 | 36 | -1.92% | 12.96% |
| CLSD | Clearside Bio | | Biotechnology | 1.32 | 32 | 14.29% | 12.82% |
| PRTC | PureTech Health | | Biotechnology | 26.93 | 68 | 2.03% | 12.65% |
| PAHC | Phibro Animal | | Specialized | 13.04 | 65 | 1.32% | 12.61% |
| BTMD | biote | | Medical Care Facilities | 5.58 | 53 | 1.45% | 12.50% |
| SEM | Select | | Hospitals | 26.43 | 36 | -0.75% | 12.47% |
| ANIK | Anika | | Biotechnology | 25.43 | 61 | -1.01% | 12.22% |
| AKBA | Akebia | | Biotechnology | 1.39 | 10 | 0.00% | 12.10% |
| MNKD | MannKind | | Biotechnology | 4.08 | 51 | -0.49% | 12.09% |
| BKD | Brookdale Senior | | Long-Term | 6.52 | 68 | 0.93% | 12.03% |
| SNDL | Sundial Growers | | Pharmaceutical | 1.84 | 31 | 0.27% | 11.89% |
| CELC | Celcuity | | Laboratories | 16.40 | 36 | -3.59% | 11.87% |
| ASND | Ascendis Pharma | | Biotechnology | 140.89 | 31 | -0.90% | 11.86% |
| PBH | Prestige Consumer | | Equipment | 68.35 | 61 | 0.47% | 11.65% |
| CTMX | CytomX | | Biotechnology | 1.73 | 26 | -1.70% | 11.61% |
| GEHC | GE | | Health Information | 85.50 | 56 | 0.37% | 10.54% |
| TMDX | TransMedics | | Equipment | 87.24 | 61 | -0.71% | 10.53% |
| ISRG | Intuitive Surgical | | Instruments | 372.63 | 0 | -0.41% | 10.45% |
| LMAT | LeMaitre Vascular | | Instruments | 62.62 | 26 | -0.67% | 10.32% |
| LCTX | Lineage Cell | | Biotechnology | 1.20 | 36 | -6.98% | 10.09% |
| PTGX | Protagonist | | Biotechnology | 25.22 | 13 | -1.37% | 9.99% |
| ALGN | Align Technology | | Equipment | 301.34 | 61 | 0.40% | 9.98% |
| EOLS | Evolus | | Pharmaceutical | 11.56 | 10 | -0.69% | 9.78% |
| HCA | HCA | | Hospitals | 297.00 | 0 | -4.51% | 9.72% |
| SYK | Stryker | | Equipment | 327.45 | 0 | -2.55% | 9.35% |
| For chart view version of above stock list: Chart View ➞ 0 - 25 , 25 - 50 , 50 - 75 , 75 - 100 , 100 - 125 , 125 - 150 , 150 - 175 , 175 - 200 , 200 - 225 , 225 - 250 , 250 - 275 , 275 - 300 , 300 - 325 , 325 - 350 , 350 - 375 , 375 - 400 , 400 - 425 , 425 - 450 , 450 - 475 , 475 - 500 , 500 - 525 , 525 - 550 , 550 - 575 , 575 - 600 , 600 - 625 , 625 - 650 , 650 - 675 , 675 - 700 , 700 - 725 | ||
 | Click To Change The Sort Order: By Market Cap or Company Size Performance: Year-to-date, Week and Day |  |
|
Get the most comprehensive stock market coverage daily at 12Stocks.com ➞ Best Stocks Today ➞ Best Stocks Weekly ➞ Best Stocks Year-to-Date ➞ Best Stocks Trends ➞  Best Stocks Today 12Stocks.com Best Nasdaq Stocks ➞ Best S&P 500 Stocks ➞ Best Tech Stocks ➞ Best Biotech Stocks ➞ |
| Detailed Overview of Healthcare Stocks |
| Healthcare Technical Overview, Leaders & Laggards, Top Healthcare ETF Funds & Detailed Healthcare Stocks List, Charts, Trends & More |
| Healthcare Sector: Technical Analysis, Trends & YTD Performance | |
| Healthcare sector is composed of stocks
from pharmaceutical, biotech, diagnostics labs, insurance providers
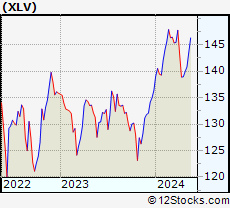
and healthcare services. Healthcare sector, as represented by XLV, an exchange-traded fund [ETF] that holds basket of Healthcare stocks (e.g, Merck, Amgen) is up by 1.5% and is currently underperforming the overall market by -2.69% year-to-date. Below is a quick view of Technical charts and trends: |
|
 XLV Weekly Chart |
|
| Long Term Trend: Not Good | |
| Medium Term Trend: Not Good | |
 XLV Daily Chart |
|
| Short Term Trend: Deteriorating | |
| Overall Trend Score: 18 | |
| YTD Performance: 1.5% | |
| **Trend Scores & Views Are Only For Educational Purposes And Not For Investing | |
| 12Stocks.com: Top Performing Healthcare Sector Stocks | ||||||||||||||||||||||||||||||||||||||||||||||||
 The top performing Healthcare sector stocks year to date are
Now, more recently, over last week, the top performing Healthcare sector stocks on the move are


|
||||||||||||||||||||||||||||||||||||||||||||||||
| 12Stocks.com: Investing in Healthcare Sector using Exchange Traded Funds | |
|
The following table shows list of key exchange traded funds (ETF) that
help investors track Healthcare Index. For detailed view, check out our ETF Funds section of our website. Quick View: Move mouse or cursor over ETF symbol (ticker) to view short-term Technical chart and over ETF name to view long term chart. Click on ticker or stock name for detailed view. Click on to add stock symbol to your watchlist and to view watchlist. |
12Stocks.com List of ETFs that track Healthcare Index
| Ticker | ETF Name | Watchlist | Recent Price | Smart Investing & Trading Score | Change % | Week % | Year-to-date % |
| XLV | Health Care | | 138.43 | 18 | -0.01 | -0.35 | 1.5% |
| XBI | Biotech | | 83.48 | 10 | -1.38 | -5.3 | -6.51% |
| IBB | Biotechnology | | 124.64 | 0 | -0.99 | -3.81 | -8.25% |
| BBH | Biotech | | 152.35 | 10 | -0.43 | -3.33 | -7.84% |
| VHT | Health Care | | 252.83 | 18 | -0.12 | -0.76 | 0.85% |
| IYH | Healthcare | | 58.05 | 10 | -0.02 | -0.6 | 1.4% |
| IHF | Healthcare Providers | | 51.55 | 32 | 0.93 | 1.99 | -1.84% |
| IHI | Medical Devices | | 54.53 | 5 | -0.46 | -2.8 | 1.04% |
| BIB | Biotechnology | | 47.94 | 0 | -2.02 | -6.71 | -15.97% |
| BIS | Short Biotech | | 20.87 | 100 | 1.69 | 6.46 | 15.47% |
| XHE | Health Care Equipment | | 81.44 | 20 | -0.74 | -2.93 | -3.35% |
| CURE | Healthcare Bull 3X | | 102.22 | 18 | -0.44 | -1.14 | 0.47% |
| LABU | Biotech Bull 3X | | 88.04 | 10 | -4.33 | -15.63 | -27.82% |
| LABD | Biotech Bear 3X | | 10.52 | 82 | 4.37 | 17.15 | 8.57% |
| PSCH | SmallCap Health Care | | 40.08 | 20 | -0.87 | -3.26 | -6.36% |
| XHS | Health Care Services | | 86.19 | 10 | -0.16 | -2.07 | -3.1% |
| PTH | DWA Healthcare Momentum | | 39.57 | 46 | -2.18 | -5.4 | 1.1% |
| BTEC | Principal Healthcare Innovators | | 34.09 | 0 | -1.51 | -5.29 | -6.17% |
| RXL | Health Care | | 92.44 | 10 | -0.61 | -0.88 | 1.13% |
| RXD | Short Health Care | | 11.67 | 76 | -0.05 | 0.64 | -2.11% |
| 12Stocks.com: Charts, Trends, Fundamental Data and Performances of Healthcare Stocks | |
|
We now take in-depth look at all Healthcare stocks including charts, multi-period performances and overall trends (as measured by Smart Investing & Trading Score). One can sort Healthcare stocks (click link to choose) by Daily, Weekly and by Year-to-Date performances. Also, one can sort by size of the company or by market capitalization. |
| Select Your Default Chart Type: | |||||
| |||||
| Click on stock symbol or name for detailed view. Click on to add stock symbol to your watchlist and to view watchlist. Quick View: Move mouse or cursor over "Daily" to quickly view daily Technical stock chart and over "Weekly" to view weekly Technical stock chart. | |||||

 | COLL Collegium Pharmaceutical, Inc. |
| Sector: Health Care | |
| SubSector: Drugs - Generic | |
| MarketCap: 569.185 Millions | |
| Recent Price: 34.77 Smart Investing & Trading Score: 36 | |
| Day Percent Change: -1.92% Day Change: -0.68 | |
| Week Change: -2.63% Year-to-date Change: 13.0% | |
| COLL Links: Profile News Message Board | |
| Charts:- Daily , Weekly | |
| Add COLL to Watchlist: View: Get Complete COLL Trend Analysis ➞ | |
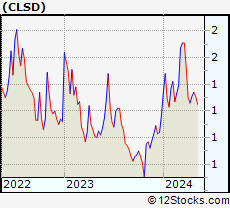 | CLSD Clearside Biomedical, Inc. |
| Sector: Health Care | |
| SubSector: Biotechnology | |
| MarketCap: 73.2785 Millions | |
| Recent Price: 1.32 Smart Investing & Trading Score: 32 | |
| Day Percent Change: 14.29% Day Change: 0.17 | |
| Week Change: 4.76% Year-to-date Change: 12.8% | |
| CLSD Links: Profile News Message Board | |
| Charts:- Daily , Weekly | |
| Add CLSD to Watchlist: View: Get Complete CLSD Trend Analysis ➞ | |
 | PRTC PureTech Health plc |
| Sector: Health Care | |
| SubSector: Biotechnology | |
| MarketCap: 819 Millions | |
| Recent Price: 26.93 Smart Investing & Trading Score: 68 | |
| Day Percent Change: 2.03% Day Change: 0.54 | |
| Week Change: -0.43% Year-to-date Change: 12.7% | |
| PRTC Links: Profile News Message Board | |
| Charts:- Daily , Weekly | |
| Add PRTC to Watchlist: View: Get Complete PRTC Trend Analysis ➞ | |
 | PAHC Phibro Animal Health Corporation |
| Sector: Health Care | |
| SubSector: Specialized Health Services | |
| MarketCap: 852.956 Millions | |
| Recent Price: 13.04 Smart Investing & Trading Score: 65 | |
| Day Percent Change: 1.32% Day Change: 0.17 | |
| Week Change: -0.53% Year-to-date Change: 12.6% | |
| PAHC Links: Profile News Message Board | |
| Charts:- Daily , Weekly | |
| Add PAHC to Watchlist: View: Get Complete PAHC Trend Analysis ➞ | |
 | BTMD biote Corp. |
| Sector: Health Care | |
| SubSector: Medical Care Facilities | |
| MarketCap: 468 Millions | |
| Recent Price: 5.58 Smart Investing & Trading Score: 53 | |
| Day Percent Change: 1.45% Day Change: 0.08 | |
| Week Change: -7.31% Year-to-date Change: 12.5% | |
| BTMD Links: Profile News Message Board | |
| Charts:- Daily , Weekly | |
| Add BTMD to Watchlist: View: Get Complete BTMD Trend Analysis ➞ | |
 | SEM Select Medical Holdings Corporation |
| Sector: Health Care | |
| SubSector: Hospitals | |
| MarketCap: 1765.96 Millions | |
| Recent Price: 26.43 Smart Investing & Trading Score: 36 | |
| Day Percent Change: -0.75% Day Change: -0.20 | |
| Week Change: -5.81% Year-to-date Change: 12.5% | |
| SEM Links: Profile News Message Board | |
| Charts:- Daily , Weekly | |
| Add SEM to Watchlist: View: Get Complete SEM Trend Analysis ➞ | |
 | ANIK Anika Therapeutics, Inc. |
| Sector: Health Care | |
| SubSector: Biotechnology | |
| MarketCap: 438.385 Millions | |
| Recent Price: 25.43 Smart Investing & Trading Score: 61 | |
| Day Percent Change: -1.01% Day Change: -0.26 | |
| Week Change: 1.72% Year-to-date Change: 12.2% | |
| ANIK Links: Profile News Message Board | |
| Charts:- Daily , Weekly | |
| Add ANIK to Watchlist: View: Get Complete ANIK Trend Analysis ➞ | |
 | AKBA Akebia Therapeutics, Inc. |
| Sector: Health Care | |
| SubSector: Biotechnology | |
| MarketCap: 794.285 Millions | |
| Recent Price: 1.39 Smart Investing & Trading Score: 10 | |
| Day Percent Change: 0.00% Day Change: 0.00 | |
| Week Change: -4.79% Year-to-date Change: 12.1% | |
| AKBA Links: Profile News Message Board | |
| Charts:- Daily , Weekly | |
| Add AKBA to Watchlist: View: Get Complete AKBA Trend Analysis ➞ | |
 | MNKD MannKind Corporation |
| Sector: Health Care | |
| SubSector: Biotechnology | |
| MarketCap: 250.885 Millions | |
| Recent Price: 4.08 Smart Investing & Trading Score: 51 | |
| Day Percent Change: -0.49% Day Change: -0.02 | |
| Week Change: -1.69% Year-to-date Change: 12.1% | |
| MNKD Links: Profile News Message Board | |
| Charts:- Daily , Weekly | |
| Add MNKD to Watchlist: View: Get Complete MNKD Trend Analysis ➞ | |
 | BKD Brookdale Senior Living Inc. |
| Sector: Health Care | |
| SubSector: Long-Term Care Facilities | |
| MarketCap: 420.686 Millions | |
| Recent Price: 6.52 Smart Investing & Trading Score: 68 | |
| Day Percent Change: 0.93% Day Change: 0.06 | |
| Week Change: 0.77% Year-to-date Change: 12.0% | |
| BKD Links: Profile News Message Board | |
| Charts:- Daily , Weekly | |
| Add BKD to Watchlist: View: Get Complete BKD Trend Analysis ➞ | |
 | SNDL Sundial Growers Inc. |
| Sector: Health Care | |
| SubSector: Drug Manufacturers - Other | |
| MarketCap: 94.4033 Millions | |
| Recent Price: 1.84 Smart Investing & Trading Score: 31 | |
| Day Percent Change: 0.27% Day Change: 0.00 | |
| Week Change: -8.25% Year-to-date Change: 11.9% | |
| SNDL Links: Profile News Message Board | |
| Charts:- Daily , Weekly | |
| Add SNDL to Watchlist: View: Get Complete SNDL Trend Analysis ➞ | |
 | CELC Celcuity Inc. |
| Sector: Health Care | |
| SubSector: Medical Laboratories & Research | |
| MarketCap: 70.53 Millions | |
| Recent Price: 16.40 Smart Investing & Trading Score: 36 | |
| Day Percent Change: -3.59% Day Change: -0.61 | |
| Week Change: -10.43% Year-to-date Change: 11.9% | |
| CELC Links: Profile News Message Board | |
| Charts:- Daily , Weekly | |
| Add CELC to Watchlist: View: Get Complete CELC Trend Analysis ➞ | |
 | ASND Ascendis Pharma A/S |
| Sector: Health Care | |
| SubSector: Biotechnology | |
| MarketCap: 5470.35 Millions | |
| Recent Price: 140.89 Smart Investing & Trading Score: 31 | |
| Day Percent Change: -0.90% Day Change: -1.28 | |
| Week Change: -3.53% Year-to-date Change: 11.9% | |
| ASND Links: Profile News Message Board | |
| Charts:- Daily , Weekly | |
| Add ASND to Watchlist: View: Get Complete ASND Trend Analysis ➞ | |
 | PBH Prestige Consumer Healthcare Inc. |
| Sector: Health Care | |
| SubSector: Medical Appliances & Equipment | |
| MarketCap: 1639.6 Millions | |
| Recent Price: 68.35 Smart Investing & Trading Score: 61 | |
| Day Percent Change: 0.47% Day Change: 0.32 | |
| Week Change: 0.18% Year-to-date Change: 11.7% | |
| PBH Links: Profile News Message Board | |
| Charts:- Daily , Weekly | |
| Add PBH to Watchlist: View: Get Complete PBH Trend Analysis ➞ | |
 | CTMX CytomX Therapeutics, Inc. |
| Sector: Health Care | |
| SubSector: Biotechnology | |
| MarketCap: 264.885 Millions | |
| Recent Price: 1.73 Smart Investing & Trading Score: 26 | |
| Day Percent Change: -1.70% Day Change: -0.03 | |
| Week Change: -19.53% Year-to-date Change: 11.6% | |
| CTMX Links: Profile News Message Board | |
| Charts:- Daily , Weekly | |
| Add CTMX to Watchlist: View: Get Complete CTMX Trend Analysis ➞ | |
 | GEHC GE HealthCare Technologies Inc. |
| Sector: Health Care | |
| SubSector: Health Information Services | |
| MarketCap: 36240 Millions | |
| Recent Price: 85.50 Smart Investing & Trading Score: 56 | |
| Day Percent Change: 0.37% Day Change: 0.31 | |
| Week Change: -3.08% Year-to-date Change: 10.5% | |
| GEHC Links: Profile News Message Board | |
| Charts:- Daily , Weekly | |
| Add GEHC to Watchlist: View: Get Complete GEHC Trend Analysis ➞ | |
 | TMDX TransMedics Group, Inc. |
| Sector: Health Care | |
| SubSector: Medical Appliances & Equipment | |
| MarketCap: 331.68 Millions | |
| Recent Price: 87.24 Smart Investing & Trading Score: 61 | |
| Day Percent Change: -0.71% Day Change: -0.62 | |
| Week Change: -4.99% Year-to-date Change: 10.5% | |
| TMDX Links: Profile News Message Board | |
| Charts:- Daily , Weekly | |
| Add TMDX to Watchlist: View: Get Complete TMDX Trend Analysis ➞ | |
 | ISRG Intuitive Surgical, Inc. |
| Sector: Health Care | |
| SubSector: Medical Instruments & Supplies | |
| MarketCap: 50917.5 Millions | |
| Recent Price: 372.63 Smart Investing & Trading Score: 0 | |
| Day Percent Change: -0.41% Day Change: -1.54 | |
| Week Change: -3.16% Year-to-date Change: 10.5% | |
| ISRG Links: Profile News Message Board | |
| Charts:- Daily , Weekly | |
| Add ISRG to Watchlist: View: Get Complete ISRG Trend Analysis ➞ | |
 | LMAT LeMaitre Vascular, Inc. |
| Sector: Health Care | |
| SubSector: Medical Instruments & Supplies | |
| MarketCap: 522.16 Millions | |
| Recent Price: 62.62 Smart Investing & Trading Score: 26 | |
| Day Percent Change: -0.67% Day Change: -0.42 | |
| Week Change: -3.14% Year-to-date Change: 10.3% | |
| LMAT Links: Profile News Message Board | |
| Charts:- Daily , Weekly | |
| Add LMAT to Watchlist: View: Get Complete LMAT Trend Analysis ➞ | |
 | LCTX Lineage Cell Therapeutics, Inc. |
| Sector: Health Care | |
| SubSector: Biotechnology | |
| MarketCap: 141.285 Millions | |
| Recent Price: 1.20 Smart Investing & Trading Score: 36 | |
| Day Percent Change: -6.98% Day Change: -0.09 | |
| Week Change: -7.69% Year-to-date Change: 10.1% | |
| LCTX Links: Profile News Message Board | |
| Charts:- Daily , Weekly | |
| Add LCTX to Watchlist: View: Get Complete LCTX Trend Analysis ➞ | |
 | PTGX Protagonist Therapeutics, Inc. |
| Sector: Health Care | |
| SubSector: Biotechnology | |
| MarketCap: 165.285 Millions | |
| Recent Price: 25.22 Smart Investing & Trading Score: 13 | |
| Day Percent Change: -1.37% Day Change: -0.35 | |
| Week Change: -6.73% Year-to-date Change: 10.0% | |
| PTGX Links: Profile News Message Board | |
| Charts:- Daily , Weekly | |
| Add PTGX to Watchlist: View: Get Complete PTGX Trend Analysis ➞ | |
 | ALGN Align Technology, Inc. |
| Sector: Health Care | |
| SubSector: Medical Appliances & Equipment | |
| MarketCap: 12802 Millions | |
| Recent Price: 301.34 Smart Investing & Trading Score: 61 | |
| Day Percent Change: 0.40% Day Change: 1.20 | |
| Week Change: -4.33% Year-to-date Change: 10.0% | |
| ALGN Links: Profile News Message Board | |
| Charts:- Daily , Weekly | |
| Add ALGN to Watchlist: View: Get Complete ALGN Trend Analysis ➞ | |
 | EOLS Evolus, Inc. |
| Sector: Health Care | |
| SubSector: Drugs - Generic | |
| MarketCap: 145.885 Millions | |
| Recent Price: 11.56 Smart Investing & Trading Score: 10 | |
| Day Percent Change: -0.69% Day Change: -0.08 | |
| Week Change: -4.38% Year-to-date Change: 9.8% | |
| EOLS Links: Profile News Message Board | |
| Charts:- Daily , Weekly | |
| Add EOLS to Watchlist: View: Get Complete EOLS Trend Analysis ➞ | |
 | HCA HCA Healthcare, Inc. |
| Sector: Health Care | |
| SubSector: Hospitals | |
| MarketCap: 29466.6 Millions | |
| Recent Price: 297.00 Smart Investing & Trading Score: 0 | |
| Day Percent Change: -4.51% Day Change: -14.03 | |
| Week Change: -8% Year-to-date Change: 9.7% | |
| HCA Links: Profile News Message Board | |
| Charts:- Daily , Weekly | |
| Add HCA to Watchlist: View: Get Complete HCA Trend Analysis ➞ | |
 | SYK Stryker Corporation |
| Sector: Health Care | |
| SubSector: Medical Appliances & Equipment | |
| MarketCap: 59441.3 Millions | |
| Recent Price: 327.45 Smart Investing & Trading Score: 0 | |
| Day Percent Change: -2.55% Day Change: -8.58 | |
| Week Change: -4.27% Year-to-date Change: 9.4% | |
| SYK Links: Profile News Message Board | |
| Charts:- Daily , Weekly | |
| Add SYK to Watchlist: View: Get Complete SYK Trend Analysis ➞ | |
| For tabular summary view of above stock list: Summary View ➞ 0 - 25 , 25 - 50 , 50 - 75 , 75 - 100 , 100 - 125 , 125 - 150 , 150 - 175 , 175 - 200 , 200 - 225 , 225 - 250 , 250 - 275 , 275 - 300 , 300 - 325 , 325 - 350 , 350 - 375 , 375 - 400 , 400 - 425 , 425 - 450 , 450 - 475 , 475 - 500 , 500 - 525 , 525 - 550 , 550 - 575 , 575 - 600 , 600 - 625 , 625 - 650 , 650 - 675 , 675 - 700 , 700 - 725 | ||
| Click To Change The Sort Order: By Market Cap or Company Size Performance: Year-to-date, Week and Day | |
| Select Chart Type: | ||
|
Best Stocks Today 12Stocks.com |
© 2024 12Stocks.com Terms & Conditions Privacy Contact Us
All Information Provided Only For Education And Not To Be Used For Investing or Trading. See Terms & Conditions


One More Thing ... Get Best Stocks Delivered Daily!
Never Ever Miss A Move With Our Top Ten Stocks Lists
Find Best Stocks In Any Market - Bull or Bear Market
Take A Peek At Our Top Ten Stocks Lists: Daily, Weekly, Year-to-Date & Top Trends
Find Best Stocks In Any Market - Bull or Bear Market
Take A Peek At Our Top Ten Stocks Lists: Daily, Weekly, Year-to-Date & Top Trends
Healthcare Stocks With Best Up Trends [0-bearish to 100-bullish]: Zhongchao [100], Cullinan Oncology[100], Oscar Health[100], ALX Oncology[100], Zura Bio[93], PROCEPT BioRobotics[93], NuCana [93], Reneo [93], Vanda [93], Lantheus [93], Aurora Cannabis[88]
Best Healthcare Stocks Year-to-Date:
Precision BioSciences[2836.99%], Inovio [1900%], Assembly Biosciences[1525.41%], Adverum Biotechnologies[1381.14%], Aurora Cannabis[1272.32%], NuCana [1269.17%], Zhongchao [825.77%], Affimed N.V[711.2%], Corbus [504.8%], Agenus [500.31%], CareMax [417.53%] Best Healthcare Stocks This Week:
NuCana [1708.84%], Zhongchao [106.1%], Regencell Bioscience[37.01%], 23andMe Holding[33.3%], ProKidney [32%], ALX Oncology[20.64%], Vanda [20.63%], Galera [16.43%], Venus Concept[15.35%], Cullinan Oncology[13.89%], Rani [13.15%] Best Healthcare Stocks Daily:
Zhongchao [146.72%], 23andMe Holding[65.91%], Veru [22.41%], Canopy Growth[20.65%], Zura Bio[17.20%], Aurora Cannabis[12.87%], Bicycle [12.33%], Regencell Bioscience[10.20%], Vaxxinity [10.05%], DURECT [9.77%], Annovis Bio[9.57%]