
 Login Sign Up


| |||||
 |  | ||||

| 12Stocks.com Market Intelligence |
Best Healthcare Stocks
 | "Discover best trending healthcare stocks with 12Stocks.com." |
| - Subu Vdaygiri, Founder, 12Stocks.com |
| In a hurry? Healthcare Stocks Lists: Performance Trends Table, Stock Charts
Sort Healthcare stocks: Daily, Weekly, Year-to-Date, Market Cap & Trends. Filter Healthcare stocks list by size:All Healthcare Large Mid-Range Small |
| 12Stocks.com Healthcare Stocks Performances & Trends Daily | |||||||||
|
|  The overall Smart Investing & Trading Score is 52 (0-bearish to 100-bullish) which puts Healthcare sector in short term neutral trend. The Smart Investing & Trading Score from previous trading session is 38 and hence an improvement of trend.
| ||||||||
Here are the Smart Investing & Trading Scores of the most requested Healthcare stocks at 12Stocks.com (click stock name for detailed review):
|


| 12Stocks.com: Investing in Healthcare sector with Stocks | |
|
The following table helps investors and traders sort through current performance and trends (as measured by Smart Investing & Trading Score) of various
stocks in the Healthcare sector. Quick View: Move mouse or cursor over stock symbol (ticker) to view short-term Technical chart and over stock name to view long term chart. Click on  to add stock symbol to your watchlist and to add stock symbol to your watchlist and  to view watchlist. Click on any ticker or stock name for detailed market intelligence report for that stock. to view watchlist. Click on any ticker or stock name for detailed market intelligence report for that stock. |
12Stocks.com Performance of Stocks in Healthcare Sector
| Ticker | Stock Name | Watchlist | Category | Recent Price | Smart Investing & Trading Score | Change % | YTD Change% |
| EOLS | Evolus |   | Pharmaceutical | 11.70 | 32 | -0.17% | 11.11% |
| USPH | U.S. Physical | | Specialized | 103.39 | 68 | 3.46% | 11.00% |
| WST | West | | Instruments | 390.20 | 85 | 3.96% | 10.81% |
| AKBA | Akebia | | Biotechnology | 1.37 | 17 | 0.74% | 10.48% |
| FULC | Fulcrum | | Biotechnology | 7.44 | 58 | 2.62% | 10.22% |
| VNDA | Vanda | | Biotechnology | 4.63 | 43 | -3.54% | 9.72% |
| IDYA | IDEAYA Biosciences | | Biotechnology | 39.02 | 32 | 3.80% | 9.67% |
| KOD | Kodiak Sciences | | Biotechnology | 3.33 | 17 | -2.63% | 9.54% |
| ABBV | AbbVie | | Pharmaceutical | 169.54 | 73 | 0.98% | 9.40% |
| SGHT | Sight Sciences | | Medical Devices | 5.64 | 88 | 5.03% | 9.20% |
| IRTC | iRhythm Technologies | | Instruments | 116.34 | 74 | 2.39% | 8.69% |
| MRNA | Moderna | | Biotechnology | 107.89 | 95 | 3.28% | 8.49% |
| CTMX | CytomX | | Biotechnology | 1.68 | 36 | 0.60% | 8.39% |
| ICLR | ICON Public | | Laboratories | 306.45 | 58 | 2.86% | 8.26% |
| TMO | Thermo Fisher | | Laboratories | 574.59 | 85 | 4.78% | 8.25% |
| UHS | Universal Health | | Hospitals | 164.91 | 58 | 2.35% | 8.18% |
| HOLX | Hologic | | Instruments | 77.19 | 68 | 1.27% | 8.03% |
| DXCM | DexCom | | Laboratories | 134.00 | 61 | 1.89% | 7.99% |
| OCS | Oculis Holding | | Biotechnology | 11.98 | 52 | 0.25% | 7.92% |
| LQDA | Liquidia Technologies | | Biotechnology | 12.95 | 36 | -1.75% | 7.65% |
| ABUS | Arbutus Biopharma | | Biotechnology | 2.69 | 43 | 1.70% | 7.60% |
| CIVI | Civitas | | Long-Term | 73.29 | 22 | 0.47% | 7.18% |
| RMD | ResMed | | Instruments | 184.22 | 42 | 2.15% | 7.09% |
| TSVT | 2seventy bio | | Biotechnology | 4.63 | 17 | -0.43% | 7.05% |
| ATRI | Atrion | | Instruments | 405.29 | 75 | 1.37% | 7.00% |
| For chart view version of above stock list: Chart View ➞ 0 - 25 , 25 - 50 , 50 - 75 , 75 - 100 , 100 - 125 , 125 - 150 , 150 - 175 , 175 - 200 , 200 - 225 , 225 - 250 , 250 - 275 , 275 - 300 , 300 - 325 , 325 - 350 , 350 - 375 , 375 - 400 , 400 - 425 , 425 - 450 , 450 - 475 , 475 - 500 , 500 - 525 , 525 - 550 , 550 - 575 , 575 - 600 , 600 - 625 , 625 - 650 , 650 - 675 , 675 - 700 , 700 - 725 | ||
 | Click To Change The Sort Order: By Market Cap or Company Size Performance: Year-to-date, Week and Day |  |
|
Get the most comprehensive stock market coverage daily at 12Stocks.com ➞ Best Stocks Today ➞ Best Stocks Weekly ➞ Best Stocks Year-to-Date ➞ Best Stocks Trends ➞  Best Stocks Today 12Stocks.com Best Nasdaq Stocks ➞ Best S&P 500 Stocks ➞ Best Tech Stocks ➞ Best Biotech Stocks ➞ |
| Detailed Overview of Healthcare Stocks |
| Healthcare Technical Overview, Leaders & Laggards, Top Healthcare ETF Funds & Detailed Healthcare Stocks List, Charts, Trends & More |
| Healthcare Sector: Technical Analysis, Trends & YTD Performance | |
| Healthcare sector is composed of stocks
from pharmaceutical, biotech, diagnostics labs, insurance providers
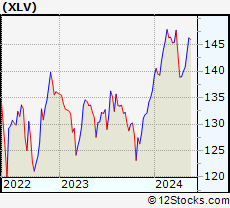
and healthcare services. Healthcare sector, as represented by XLV, an exchange-traded fund [ETF] that holds basket of Healthcare stocks (e.g, Merck, Amgen) is up by 3.61% and is currently underperforming the overall market by -2.03% year-to-date. Below is a quick view of Technical charts and trends: |
|
 XLV Weekly Chart |
|
| Long Term Trend: Good | |
| Medium Term Trend: Not Good | |
 XLV Daily Chart |
|
| Short Term Trend: Very Good | |
| Overall Trend Score: 52 | |
| YTD Performance: 3.61% | |
| **Trend Scores & Views Are Only For Educational Purposes And Not For Investing | |
| 12Stocks.com: Top Performing Healthcare Sector Stocks | ||||||||||||||||||||||||||||||||||||||||||||||||
 The top performing Healthcare sector stocks year to date are
Now, more recently, over last week, the top performing Healthcare sector stocks on the move are


|
||||||||||||||||||||||||||||||||||||||||||||||||
| 12Stocks.com: Investing in Healthcare Sector using Exchange Traded Funds | |
|
The following table shows list of key exchange traded funds (ETF) that
help investors track Healthcare Index. For detailed view, check out our ETF Funds section of our website. Quick View: Move mouse or cursor over ETF symbol (ticker) to view short-term Technical chart and over ETF name to view long term chart. Click on ticker or stock name for detailed view. Click on to add stock symbol to your watchlist and to view watchlist. |
12Stocks.com List of ETFs that track Healthcare Index
| Ticker | ETF Name | Watchlist | Recent Price | Smart Investing & Trading Score | Change % | Week % | Year-to-date % |
| XLV | Health Care | | 141.30 | 52 | 1.30 | 1.69 | 3.61% |
| XBI | Biotech | | 84.69 | 32 | 2.28 | 2.25 | -5.15% |
| IBB | Biotechnology | | 128.02 | 32 | 1.51 | 2.65 | -5.76% |
| BBH | Biotech | | 157.29 | 49 | 1.77 | 3.24 | -4.85% |
| VHT | Health Care | | 257.82 | 52 | 1.29 | 1.77 | 2.84% |
| IYH | Healthcare | | 59.21 | 52 | 1.33 | 1.81 | 3.43% |
| IHF | Healthcare Providers | | 52.32 | 70 | 0.47 | 0.21 | -0.36% |
| IHI | Medical Devices | | 55.51 | 50 | 1.48 | 2.12 | 2.85% |
| BIB | Biotechnology | | 50.33 | 39 | 2.51 | 4.42 | -11.78% |
| BIS | Short Biotech | | 19.94 | 68 | -2.59 | -4.57 | 10.35% |
| XHE | Health Care Equipment | | 83.01 | 42 | 1.63 | 2.14 | -1.48% |
| CURE | Healthcare Bull 3X | | 108.12 | 39 | 3.52 | 4.64 | 6.27% |
| LABU | Biotech Bull 3X | | 91.98 | 32 | 6.42 | 6.89 | -24.59% |
| LABD | Biotech Bear 3X | | 10.07 | 55 | -6.33 | -6.76 | 3.92% |
| PSCH | SmallCap Health Care | | 41.22 | 55 | 2.05 | 2.58 | -3.7% |
| XHS | Health Care Services | | 88.75 | 75 | 1.49 | 1.91 | -0.22% |
| PTH | DWA Healthcare Momentum | | 40.17 | 68 | 2.11 | 1.62 | 2.63% |
| BTEC | Principal Healthcare Innovators | | 34.81 | 32 | 3.10 | 2.79 | -4.2% |
| RXL | Health Care | | 96.15 | 52 | 0.87 | 3.14 | 5.19% |
| RXD | Short Health Care | | 11.24 | 43 | -2.18 | -3.39 | -5.7% |
| 12Stocks.com: Charts, Trends, Fundamental Data and Performances of Healthcare Stocks | |
|
We now take in-depth look at all Healthcare stocks including charts, multi-period performances and overall trends (as measured by Smart Investing & Trading Score). One can sort Healthcare stocks (click link to choose) by Daily, Weekly and by Year-to-Date performances. Also, one can sort by size of the company or by market capitalization. |
| Select Your Default Chart Type: | |||||
| |||||
| Click on stock symbol or name for detailed view. Click on to add stock symbol to your watchlist and to view watchlist. Quick View: Move mouse or cursor over "Daily" to quickly view daily Technical stock chart and over "Weekly" to view weekly Technical stock chart. | |||||

 | EOLS Evolus, Inc. |
| Sector: Health Care | |
| SubSector: Drugs - Generic | |
| MarketCap: 145.885 Millions | |
| Recent Price: 11.70 Smart Investing & Trading Score: 32 | |
| Day Percent Change: -0.17% Day Change: -0.02 | |
| Week Change: 1.83% Year-to-date Change: 11.1% | |
| EOLS Links: Profile News Message Board | |
| Charts:- Daily , Weekly | |
| Add EOLS to Watchlist: View: Get Complete EOLS Trend Analysis ➞ | |
 | USPH U.S. Physical Therapy, Inc. |
| Sector: Health Care | |
| SubSector: Specialized Health Services | |
| MarketCap: 793.556 Millions | |
| Recent Price: 103.39 Smart Investing & Trading Score: 68 | |
| Day Percent Change: 3.46% Day Change: 3.46 | |
| Week Change: 4.34% Year-to-date Change: 11.0% | |
| USPH Links: Profile News Message Board | |
| Charts:- Daily , Weekly | |
| Add USPH to Watchlist: View: Get Complete USPH Trend Analysis ➞ | |
 | WST West Pharmaceutical Services, Inc. |
| Sector: Health Care | |
| SubSector: Medical Instruments & Supplies | |
| MarketCap: 9989 Millions | |
| Recent Price: 390.20 Smart Investing & Trading Score: 85 | |
| Day Percent Change: 3.96% Day Change: 14.85 | |
| Week Change: 4.88% Year-to-date Change: 10.8% | |
| WST Links: Profile News Message Board | |
| Charts:- Daily , Weekly | |
| Add WST to Watchlist: View: Get Complete WST Trend Analysis ➞ | |
 | AKBA Akebia Therapeutics, Inc. |
| Sector: Health Care | |
| SubSector: Biotechnology | |
| MarketCap: 794.285 Millions | |
| Recent Price: 1.37 Smart Investing & Trading Score: 17 | |
| Day Percent Change: 0.74% Day Change: 0.01 | |
| Week Change: 0.74% Year-to-date Change: 10.5% | |
| AKBA Links: Profile News Message Board | |
| Charts:- Daily , Weekly | |
| Add AKBA to Watchlist: View: Get Complete AKBA Trend Analysis ➞ | |
 | FULC Fulcrum Therapeutics, Inc. |
| Sector: Health Care | |
| SubSector: Biotechnology | |
| MarketCap: 274.785 Millions | |
| Recent Price: 7.44 Smart Investing & Trading Score: 58 | |
| Day Percent Change: 2.62% Day Change: 0.19 | |
| Week Change: 8.45% Year-to-date Change: 10.2% | |
| FULC Links: Profile News Message Board | |
| Charts:- Daily , Weekly | |
| Add FULC to Watchlist: View: Get Complete FULC Trend Analysis ➞ | |
 | VNDA Vanda Pharmaceuticals Inc. |
| Sector: Health Care | |
| SubSector: Biotechnology | |
| MarketCap: 464.585 Millions | |
| Recent Price: 4.63 Smart Investing & Trading Score: 43 | |
| Day Percent Change: -3.54% Day Change: -0.17 | |
| Week Change: -9.39% Year-to-date Change: 9.7% | |
| VNDA Links: Profile News Message Board | |
| Charts:- Daily , Weekly | |
| Add VNDA to Watchlist: View: Get Complete VNDA Trend Analysis ➞ | |
 | IDYA IDEAYA Biosciences, Inc. |
| Sector: Health Care | |
| SubSector: Biotechnology | |
| MarketCap: 89.1785 Millions | |
| Recent Price: 39.02 Smart Investing & Trading Score: 32 | |
| Day Percent Change: 3.80% Day Change: 1.43 | |
| Week Change: 5.18% Year-to-date Change: 9.7% | |
| IDYA Links: Profile News Message Board | |
| Charts:- Daily , Weekly | |
| Add IDYA to Watchlist: View: Get Complete IDYA Trend Analysis ➞ | |
 | KOD Kodiak Sciences Inc. |
| Sector: Health Care | |
| SubSector: Biotechnology | |
| MarketCap: 2132.15 Millions | |
| Recent Price: 3.33 Smart Investing & Trading Score: 17 | |
| Day Percent Change: -2.63% Day Change: -0.09 | |
| Week Change: -0.89% Year-to-date Change: 9.5% | |
| KOD Links: Profile News Message Board | |
| Charts:- Daily , Weekly | |
| Add KOD to Watchlist: View: Get Complete KOD Trend Analysis ➞ | |
 | ABBV AbbVie Inc. |
| Sector: Health Care | |
| SubSector: Drug Manufacturers - Major | |
| MarketCap: 110080 Millions | |
| Recent Price: 169.54 Smart Investing & Trading Score: 73 | |
| Day Percent Change: 0.98% Day Change: 1.65 | |
| Week Change: 1.88% Year-to-date Change: 9.4% | |
| ABBV Links: Profile News Message Board | |
| Charts:- Daily , Weekly | |
| Add ABBV to Watchlist: View: Get Complete ABBV Trend Analysis ➞ | |
 | SGHT Sight Sciences, Inc. |
| Sector: Health Care | |
| SubSector: Medical Devices | |
| MarketCap: 381 Millions | |
| Recent Price: 5.64 Smart Investing & Trading Score: 88 | |
| Day Percent Change: 5.03% Day Change: 0.27 | |
| Week Change: 9.94% Year-to-date Change: 9.2% | |
| SGHT Links: Profile News Message Board | |
| Charts:- Daily , Weekly | |
| Add SGHT to Watchlist: View: Get Complete SGHT Trend Analysis ➞ | |
 | IRTC iRhythm Technologies, Inc. |
| Sector: Health Care | |
| SubSector: Medical Instruments & Supplies | |
| MarketCap: 2167.9 Millions | |
| Recent Price: 116.34 Smart Investing & Trading Score: 74 | |
| Day Percent Change: 2.39% Day Change: 2.72 | |
| Week Change: 3.79% Year-to-date Change: 8.7% | |
| IRTC Links: Profile News Message Board | |
| Charts:- Daily , Weekly | |
| Add IRTC to Watchlist: View: Get Complete IRTC Trend Analysis ➞ | |
 | MRNA Moderna, Inc. |
| Sector: Health Care | |
| SubSector: Biotechnology | |
| MarketCap: 11006.4 Millions | |
| Recent Price: 107.89 Smart Investing & Trading Score: 95 | |
| Day Percent Change: 3.28% Day Change: 3.43 | |
| Week Change: 6.36% Year-to-date Change: 8.5% | |
| MRNA Links: Profile News Message Board | |
| Charts:- Daily , Weekly | |
| Add MRNA to Watchlist: View: Get Complete MRNA Trend Analysis ➞ | |
 | CTMX CytomX Therapeutics, Inc. |
| Sector: Health Care | |
| SubSector: Biotechnology | |
| MarketCap: 264.885 Millions | |
| Recent Price: 1.68 Smart Investing & Trading Score: 36 | |
| Day Percent Change: 0.60% Day Change: 0.01 | |
| Week Change: 0.6% Year-to-date Change: 8.4% | |
| CTMX Links: Profile News Message Board | |
| Charts:- Daily , Weekly | |
| Add CTMX to Watchlist: View: Get Complete CTMX Trend Analysis ➞ | |
 | ICLR ICON Public Limited Company |
| Sector: Health Care | |
| SubSector: Medical Laboratories & Research | |
| MarketCap: 7011 Millions | |
| Recent Price: 306.45 Smart Investing & Trading Score: 58 | |
| Day Percent Change: 2.86% Day Change: 8.52 | |
| Week Change: 6.32% Year-to-date Change: 8.3% | |
| ICLR Links: Profile News Message Board | |
| Charts:- Daily , Weekly | |
| Add ICLR to Watchlist: View: Get Complete ICLR Trend Analysis ➞ | |
 | TMO Thermo Fisher Scientific Inc. |
| Sector: Health Care | |
| SubSector: Medical Laboratories & Research | |
| MarketCap: 112999 Millions | |
| Recent Price: 574.59 Smart Investing & Trading Score: 85 | |
| Day Percent Change: 4.78% Day Change: 26.21 | |
| Week Change: 5.47% Year-to-date Change: 8.3% | |
| TMO Links: Profile News Message Board | |
| Charts:- Daily , Weekly | |
| Add TMO to Watchlist: View: Get Complete TMO Trend Analysis ➞ | |
 | UHS Universal Health Services, Inc. |
| Sector: Health Care | |
| SubSector: Hospitals | |
| MarketCap: 7217.66 Millions | |
| Recent Price: 164.91 Smart Investing & Trading Score: 58 | |
| Day Percent Change: 2.35% Day Change: 3.78 | |
| Week Change: 4.72% Year-to-date Change: 8.2% | |
| UHS Links: Profile News Message Board | |
| Charts:- Daily , Weekly | |
| Add UHS to Watchlist: View: Get Complete UHS Trend Analysis ➞ | |
 | HOLX Hologic, Inc. |
| Sector: Health Care | |
| SubSector: Medical Instruments & Supplies | |
| MarketCap: 9075.2 Millions | |
| Recent Price: 77.19 Smart Investing & Trading Score: 68 | |
| Day Percent Change: 1.27% Day Change: 0.97 | |
| Week Change: 2.4% Year-to-date Change: 8.0% | |
| HOLX Links: Profile News Message Board | |
| Charts:- Daily , Weekly | |
| Add HOLX to Watchlist: View: Get Complete HOLX Trend Analysis ➞ | |
 | DXCM DexCom, Inc. |
| Sector: Health Care | |
| SubSector: Medical Laboratories & Research | |
| MarketCap: 19559 Millions | |
| Recent Price: 134.00 Smart Investing & Trading Score: 61 | |
| Day Percent Change: 1.89% Day Change: 2.48 | |
| Week Change: 2.52% Year-to-date Change: 8.0% | |
| DXCM Links: Profile News Message Board | |
| Charts:- Daily , Weekly | |
| Add DXCM to Watchlist: View: Get Complete DXCM Trend Analysis ➞ | |
 | OCS Oculis Holding AG |
| Sector: Health Care | |
| SubSector: Biotechnology | |
| MarketCap: 460 Millions | |
| Recent Price: 11.98 Smart Investing & Trading Score: 52 | |
| Day Percent Change: 0.25% Day Change: 0.03 | |
| Week Change: 1.7% Year-to-date Change: 7.9% | |
| OCS Links: Profile News Message Board | |
| Charts:- Daily , Weekly | |
| Add OCS to Watchlist: View: Get Complete OCS Trend Analysis ➞ | |
 | LQDA Liquidia Technologies, Inc. |
| Sector: Health Care | |
| SubSector: Biotechnology | |
| MarketCap: 80.4785 Millions | |
| Recent Price: 12.95 Smart Investing & Trading Score: 36 | |
| Day Percent Change: -1.75% Day Change: -0.23 | |
| Week Change: -2.7% Year-to-date Change: 7.7% | |
| LQDA Links: Profile News Message Board | |
| Charts:- Daily , Weekly | |
| Add LQDA to Watchlist: View: Get Complete LQDA Trend Analysis ➞ | |
 | ABUS Arbutus Biopharma Corporation |
| Sector: Health Care | |
| SubSector: Biotechnology | |
| MarketCap: 110.885 Millions | |
| Recent Price: 2.69 Smart Investing & Trading Score: 43 | |
| Day Percent Change: 1.70% Day Change: 0.04 | |
| Week Change: -1.1% Year-to-date Change: 7.6% | |
| ABUS Links: Profile News Message Board | |
| Charts:- Daily , Weekly | |
| Add ABUS to Watchlist: View: Get Complete ABUS Trend Analysis ➞ | |
 | CIVI Civitas Solutions, Inc. |
| Sector: Health Care | |
| SubSector: Long-Term Care Facilities | |
| MarketCap: 625.74 Millions | |
| Recent Price: 73.29 Smart Investing & Trading Score: 22 | |
| Day Percent Change: 0.47% Day Change: 0.34 | |
| Week Change: 0.91% Year-to-date Change: 7.2% | |
| CIVI Links: Profile News Message Board | |
| Charts:- Daily , Weekly | |
| Add CIVI to Watchlist: View: Get Complete CIVI Trend Analysis ➞ | |
 | RMD ResMed Inc. |
| Sector: Health Care | |
| SubSector: Medical Instruments & Supplies | |
| MarketCap: 18660.2 Millions | |
| Recent Price: 184.22 Smart Investing & Trading Score: 42 | |
| Day Percent Change: 2.15% Day Change: 3.87 | |
| Week Change: 3% Year-to-date Change: 7.1% | |
| RMD Links: Profile News Message Board | |
| Charts:- Daily , Weekly | |
| Add RMD to Watchlist: View: Get Complete RMD Trend Analysis ➞ | |
 | TSVT 2seventy bio, Inc. |
| Sector: Health Care | |
| SubSector: Biotechnology | |
| MarketCap: 504 Millions | |
| Recent Price: 4.63 Smart Investing & Trading Score: 17 | |
| Day Percent Change: -0.43% Day Change: -0.02 | |
| Week Change: 2.43% Year-to-date Change: 7.1% | |
| TSVT Links: Profile News Message Board | |
| Charts:- Daily , Weekly | |
| Add TSVT to Watchlist: View: Get Complete TSVT Trend Analysis ➞ | |
 | ATRI Atrion Corporation |
| Sector: Health Care | |
| SubSector: Medical Instruments & Supplies | |
| MarketCap: 1234.6 Millions | |
| Recent Price: 405.29 Smart Investing & Trading Score: 75 | |
| Day Percent Change: 1.37% Day Change: 5.46 | |
| Week Change: 0.73% Year-to-date Change: 7.0% | |
| ATRI Links: Profile News Message Board | |
| Charts:- Daily , Weekly | |
| Add ATRI to Watchlist: View: Get Complete ATRI Trend Analysis ➞ | |
| For tabular summary view of above stock list: Summary View ➞ 0 - 25 , 25 - 50 , 50 - 75 , 75 - 100 , 100 - 125 , 125 - 150 , 150 - 175 , 175 - 200 , 200 - 225 , 225 - 250 , 250 - 275 , 275 - 300 , 300 - 325 , 325 - 350 , 350 - 375 , 375 - 400 , 400 - 425 , 425 - 450 , 450 - 475 , 475 - 500 , 500 - 525 , 525 - 550 , 550 - 575 , 575 - 600 , 600 - 625 , 625 - 650 , 650 - 675 , 675 - 700 , 700 - 725 | ||
| Click To Change The Sort Order: By Market Cap or Company Size Performance: Year-to-date, Week and Day | |
| Select Chart Type: | ||
|
Best Stocks Today 12Stocks.com |
© 2024 12Stocks.com Terms & Conditions Privacy Contact Us
All Information Provided Only For Education And Not To Be Used For Investing or Trading. See Terms & Conditions


One More Thing ... Get Best Stocks Delivered Daily!
Never Ever Miss A Move With Our Top Ten Stocks Lists
Find Best Stocks In Any Market - Bull or Bear Market
Take A Peek At Our Top Ten Stocks Lists: Daily, Weekly, Year-to-Date & Top Trends
Find Best Stocks In Any Market - Bull or Bear Market
Take A Peek At Our Top Ten Stocks Lists: Daily, Weekly, Year-to-Date & Top Trends
Healthcare Stocks With Best Up Trends [0-bearish to 100-bullish]: Pieris [100], PureTech Health[100], Day One[100], Hutchison China[100], Oscar Health[100], Agios [100], Quest Diagnostics[100], Brookdale Senior[100], Avadel [100], Fresenius [100], PMV [100]
Best Healthcare Stocks Year-to-Date:
Pieris [6493.41%], Precision BioSciences[2702.74%], Inovio [1933.33%], Assembly Biosciences[1518.1%], Aurora Cannabis[1458.17%], Adverum Biotechnologies[1361.21%], NuCana [1252.27%], Affimed N.V[756%], Agenus [680.29%], CareMax [650.52%], Corbus [524.83%] Best Healthcare Stocks This Week:
Pieris [8175.86%], CareMax [41.63%], VolitionRx [37.99%], Seres [35.74%], BeyondSpring [27.22%], GeneDx [24.95%], ProKidney [24.75%], Agenus [21.66%], MSP Recovery[19.2%], Annovis Bio[18.8%], Generation Bio[17.69%] Best Healthcare Stocks Daily:
Pieris [8113.55%], VolitionRx [41.10%], Seres [21.68%], Aurora Cannabis[18.15%], Generation Bio[16.01%], Concord [15.93%], GeneDx [15.93%], Canopy Growth[15.03%], ChromaDex [14.86%], IGM Biosciences[14.07%], CareMax [13.40%]