
 Login Sign Up


| |||||
 |  | ||||

| 12Stocks.com Market Intelligence |
Best Healthcare Stocks
 | "Discover best trending healthcare stocks with 12Stocks.com." |
| - Subu Vdaygiri, Founder, 12Stocks.com |
| In a hurry? Healthcare Stocks Lists: Performance Trends Table, Stock Charts
Sort Healthcare stocks: Daily, Weekly, Year-to-Date, Market Cap & Trends. Filter Healthcare stocks list by size:All Healthcare Large Mid-Range Small |
| 12Stocks.com Healthcare Stocks Performances & Trends Daily | |||||||||
|
|  The overall Smart Investing & Trading Score is 100 (0-bearish to 100-bullish) which puts Healthcare sector in short term bullish trend. The Smart Investing & Trading Score from previous trading session is 70 and an improvement of trend continues.
| ||||||||
Here are the Smart Investing & Trading Scores of the most requested Healthcare stocks at 12Stocks.com (click stock name for detailed review):
|


| 12Stocks.com: Investing in Healthcare sector with Stocks | |
|
The following table helps investors and traders sort through current performance and trends (as measured by Smart Investing & Trading Score) of various
stocks in the Healthcare sector. Quick View: Move mouse or cursor over stock symbol (ticker) to view short-term Technical chart and over stock name to view long term chart. Click on  to add stock symbol to your watchlist and to add stock symbol to your watchlist and  to view watchlist. Click on any ticker or stock name for detailed market intelligence report for that stock. to view watchlist. Click on any ticker or stock name for detailed market intelligence report for that stock. |
12Stocks.com Performance of Stocks in Healthcare Sector
| Ticker | Stock Name | Watchlist | Category | Recent Price | Smart Investing & Trading Score | Change % | YTD Change% |
| SVA | Sinovac Biotech |   | Biotechnology | 6.47 | 20 | 0.00% | 0.00% |
| XBIT | XBiotech | | Biotechnology | 2.64 | 20 | 0.00% | -36.69% |
| TBIO | Translate Bio | | Biotechnology | 0.02 | 20 | 0.00% | -94.50% |
| KMDA | Kamada | | Drug Manufacturers - Specialty & Generic | 6.84 | 20 | 0.00% | 11.15% |
| TYME | Tyme Technologies | | Biotechnology | 0.31 | 20 | 0.00% | 0.00% |
| SURF | Surface Oncology | | Biotechnology | 1.07 | 20 | 0.00% | 0.00% |
| NTUS | Natus | | Equipment | 32.96 | 20 | 0.00% | 0.00% |
| NGM | NGM Bio | | Biotechnology | 1.54 | 20 | 0.00% | 0.00% |
| TCRR | TCR2 | | Biotechnology | 1.48 | 20 | 0.00% | 0.00% |
| AXLA | Axcella Health | | Biotechnology | 4.58 | 20 | 0.00% | 0.00% |
| CNTG | Centogene N.V | | Laboratories | 0.06 | 20 | 0.00% | -53.85% |
| ERYP | ERYTECH Pharma | | Biotechnology | 0.79 | 20 | 0.00% | 0.00% |
| IMV | IMV | | Biotechnology | 0.08 | 20 | 0.00% | 0.00% |
| NBSE | NeuBase | | Biotechnology | 0.38 | 20 | 0.00% | 0.00% |
| ISEE | IVERIC bio | | Biotechnology | 39.95 | 20 | 0.00% | 0.00% |
| HEXO | HEXO | | Pharmaceutical | 0.71 | 20 | 0.00% | 0.00% |
| CALT | Calliditas | | Drug Manufacturers Specialty & Generic | 40.00 | 20 | 0.00% | 0.00% |
| ENZ | Enzo Biochem | | Laboratories | 0.54 | 20 | -0.02% | -25.02% |
| CRMD | CorMedix | | Biotechnology | 11.04 | 20 | -0.08% | 34.32% |
| SI | Shoulder Innovations | | Medical Devices | 12.01 | 20 | -0.08% | -20.20% |
| WEAV | Weave | | Health Information | 6.55 | 20 | -0.26% | -52.07% |
| NRC | National Research | | Health Information | 12.46 | 20 | -0.32% | -26.77% |
| ORGO | Organogenesis | | Drug Manufacturers - Specialty & Generic | 4.22 | 20 | -0.35% | 39.44% |
| ABT | Abbott | | Medical Devices | 132.99 | 20 | -0.36% | 18.93% |
| GOSS | Gossamer Bio | | Biotechnology | 2.48 | 20 | -0.40% | 155.67% |
| For chart view version of above stock list: Chart View ➞ 0 - 25 , 25 - 50 , 50 - 75 , 75 - 100 , 100 - 125 , 125 - 150 , 150 - 175 , 175 - 200 , 200 - 225 , 225 - 250 , 250 - 275 , 275 - 300 , 300 - 325 , 325 - 350 , 350 - 375 , 375 - 400 , 400 - 425 , 425 - 450 , 450 - 475 , 475 - 500 , 500 - 525 , 525 - 550 , 550 - 575 , 575 - 600 , 600 - 625 , 625 - 650 , 650 - 675 , 675 - 700 , 700 - 725 , 725 - 750 , 750 - 775 , 775 - 800 , 800 - 825 , 825 - 850 , 850 - 875 , 875 - 900 , 900 - 925 , 925 - 950 , 950 - 975 , 975 - 1000 | ||
 | Click To Change The Sort Order: By Market Cap or Company Size Performance: Year-to-date, Week and Day |  |
|
Get the most comprehensive stock market coverage daily at 12Stocks.com ➞ Best Stocks Today ➞ Best Stocks Weekly ➞ Best Stocks Year-to-Date ➞ Best Stocks Trends ➞  Best Stocks Today 12Stocks.com Best Nasdaq Stocks ➞ Best S&P 500 Stocks ➞ Best Tech Stocks ➞ Best Biotech Stocks ➞ |
| Detailed Overview of Healthcare Stocks |
| Healthcare Technical Overview, Leaders & Laggards, Top Healthcare ETF Funds & Detailed Healthcare Stocks List, Charts, Trends & More |
| Healthcare Sector: Technical Analysis, Trends & YTD Performance | |
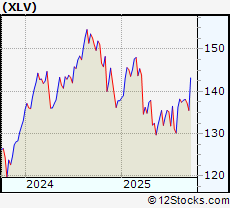
| Healthcare sector is composed of stocks
from pharmaceutical, biotech, diagnostics labs, insurance providers
and healthcare services. Healthcare sector, as represented by XLV, an exchange-traded fund [ETF] that holds basket of Healthcare stocks (e.g, Merck, Amgen) is up by 4.95646% and is currently underperforming the overall market by -9.80144% year-to-date. Below is a quick view of Technical charts and trends: |
|
 XLV Weekly Chart |
|
| Long Term Trend: Very Good | |
| Medium Term Trend: Very Good | |
 XLV Daily Chart |
|
| Short Term Trend: Very Good | |
| Overall Trend Score: 100 | |
| YTD Performance: 4.95646% | |
| **Trend Scores & Views Are Only For Educational Purposes And Not For Investing | |
| 12Stocks.com: Top Performing Healthcare Sector Stocks | ||||||||||||||||||||||||||||||||||||||||||||||
 The top performing Healthcare sector stocks year to date are
Now, more recently, over last week, the top performing Healthcare sector stocks on the move are


|
||||||||||||||||||||||||||||||||||||||||||||||
| 12Stocks.com: Investing in Healthcare Sector using Exchange Traded Funds | |
|
The following table shows list of key exchange traded funds (ETF) that
help investors track Healthcare Index. For detailed view, check out our ETF Funds section of our website. Quick View: Move mouse or cursor over ETF symbol (ticker) to view short-term Technical chart and over ETF name to view long term chart. Click on ticker or stock name for detailed view. Click on to add stock symbol to your watchlist and to view watchlist. |
12Stocks.com List of ETFs that track Healthcare Index
| Ticker | ETF Name | Watchlist | Recent Price | Smart Investing & Trading Score | Change % | Week % | Year-to-date % |
| BTEC | Principal Healthcare Innovators | | 39.49 | 30 | 0 | 1.02328 | 0% |
| 12Stocks.com: Charts, Trends, Fundamental Data and Performances of Healthcare Stocks | |
|
We now take in-depth look at all Healthcare stocks including charts, multi-period performances and overall trends (as measured by Smart Investing & Trading Score). One can sort Healthcare stocks (click link to choose) by Daily, Weekly and by Year-to-Date performances. Also, one can sort by size of the company or by market capitalization. |
| Select Your Default Chart Type: | |||||
| |||||
| Click on stock symbol or name for detailed view. Click on to add stock symbol to your watchlist and to view watchlist. Quick View: Move mouse or cursor over "Daily" to quickly view daily Technical stock chart and over "Weekly" to view weekly Technical stock chart. | |||||

 | SVA Sinovac Biotech Ltd. |
| Sector: Health Care | |
| SubSector: Biotechnology | |
| MarketCap: 336.88 Millions | |
| Recent Price: 6.47 Smart Investing & Trading Score: 20 | |
| Day Percent Change: 0% Day Change: -9999 | |
| Week Change: 0% Year-to-date Change: 0.0% | |
| SVA Links: Profile News Message Board | |
| Charts:- Daily , Weekly | |
| Add SVA to Watchlist: View: Get Complete SVA Trend Analysis ➞ | |
 | XBIT XBiotech Inc |
| Sector: Health Care | |
| SubSector: Biotechnology | |
| MarketCap: 89.02 Millions | |
| Recent Price: 2.64 Smart Investing & Trading Score: 20 | |
| Day Percent Change: 0% Day Change: -0.02 | |
| Week Change: -5.03597% Year-to-date Change: -36.7% | |
| XBIT Links: Profile News Message Board | |
| Charts:- Daily , Weekly | |
| Add XBIT to Watchlist: View: Get Complete XBIT Trend Analysis ➞ | |
 | TBIO Translate Bio, Inc. |
| Sector: Health Care | |
| SubSector: Biotechnology | |
| MarketCap: 538.685 Millions | |
| Recent Price: 0.02 Smart Investing & Trading Score: 20 | |
| Day Percent Change: 0% Day Change: -9999 | |
| Week Change: 0% Year-to-date Change: -94.5% | |
| TBIO Links: Profile News Message Board | |
| Charts:- Daily , Weekly | |
| Add TBIO to Watchlist: View: Get Complete TBIO Trend Analysis ➞ | |
 | KMDA Kamada Ltd |
| Sector: Health Care | |
| SubSector: Drug Manufacturers - Specialty & Generic | |
| MarketCap: 410.62 Millions | |
| Recent Price: 6.84 Smart Investing & Trading Score: 20 | |
| Day Percent Change: 0% Day Change: 0.08 | |
| Week Change: -0.725689% Year-to-date Change: 11.2% | |
| KMDA Links: Profile News Message Board | |
| Charts:- Daily , Weekly | |
| Add KMDA to Watchlist: View: Get Complete KMDA Trend Analysis ➞ | |
 | TYME Tyme Technologies, Inc. |
| Sector: Health Care | |
| SubSector: Biotechnology | |
| MarketCap: 123.885 Millions | |
| Recent Price: 0.31 Smart Investing & Trading Score: 20 | |
| Day Percent Change: 0% Day Change: -9999 | |
| Week Change: 0% Year-to-date Change: 0.0% | |
| TYME Links: Profile News Message Board | |
| Charts:- Daily , Weekly | |
| Add TYME to Watchlist: View: Get Complete TYME Trend Analysis ➞ | |
 | SURF Surface Oncology, Inc. |
| Sector: Health Care | |
| SubSector: Biotechnology | |
| MarketCap: 50.0785 Millions | |
| Recent Price: 1.07 Smart Investing & Trading Score: 20 | |
| Day Percent Change: 0% Day Change: -9999 | |
| Week Change: 0% Year-to-date Change: 0.0% | |
| SURF Links: Profile News Message Board | |
| Charts:- Daily , Weekly | |
| Add SURF to Watchlist: View: Get Complete SURF Trend Analysis ➞ | |
 | NTUS Natus Medical Incorporated |
| Sector: Health Care | |
| SubSector: Medical Appliances & Equipment | |
| MarketCap: 804.68 Millions | |
| Recent Price: 32.96 Smart Investing & Trading Score: 20 | |
| Day Percent Change: 0% Day Change: -9999 | |
| Week Change: 0% Year-to-date Change: 0.0% | |
| NTUS Links: Profile News Message Board | |
| Charts:- Daily , Weekly | |
| Add NTUS to Watchlist: View: Get Complete NTUS Trend Analysis ➞ | |
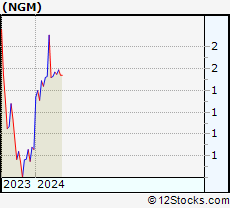 | NGM NGM Biopharmaceuticals, Inc. |
| Sector: Health Care | |
| SubSector: Biotechnology | |
| MarketCap: 951.385 Millions | |
| Recent Price: 1.54 Smart Investing & Trading Score: 20 | |
| Day Percent Change: 0% Day Change: -9999 | |
| Week Change: -3.14465% Year-to-date Change: 0.0% | |
| NGM Links: Profile News Message Board | |
| Charts:- Daily , Weekly | |
| Add NGM to Watchlist: View: Get Complete NGM Trend Analysis ➞ | |
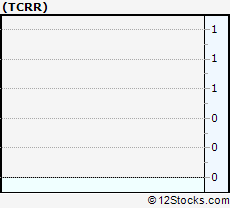 | TCRR TCR2 Therapeutics Inc. |
| Sector: Health Care | |
| SubSector: Biotechnology | |
| MarketCap: 206.285 Millions | |
| Recent Price: 1.48 Smart Investing & Trading Score: 20 | |
| Day Percent Change: 0% Day Change: -9999 | |
| Week Change: 0% Year-to-date Change: 0.0% | |
| TCRR Links: Profile News Message Board | |
| Charts:- Daily , Weekly | |
| Add TCRR to Watchlist: View: Get Complete TCRR Trend Analysis ➞ | |
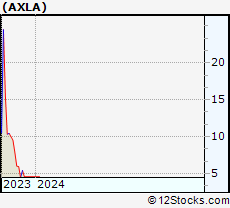 | AXLA Axcella Health Inc. |
| Sector: Health Care | |
| SubSector: Biotechnology | |
| MarketCap: 80.4785 Millions | |
| Recent Price: 4.58 Smart Investing & Trading Score: 20 | |
| Day Percent Change: 0% Day Change: -9999 | |
| Week Change: 0% Year-to-date Change: 0.0% | |
| AXLA Links: Profile News Message Board | |
| Charts:- Daily , Weekly | |
| Add AXLA to Watchlist: View: Get Complete AXLA Trend Analysis ➞ | |
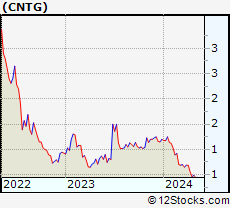 | CNTG Centogene N.V. |
| Sector: Health Care | |
| SubSector: Medical Laboratories & Research | |
| MarketCap: 455.8 Millions | |
| Recent Price: 0.06 Smart Investing & Trading Score: 20 | |
| Day Percent Change: 0% Day Change: -9999 | |
| Week Change: -5.21327% Year-to-date Change: -53.8% | |
| CNTG Links: Profile News Message Board | |
| Charts:- Daily , Weekly | |
| Add CNTG to Watchlist: View: Get Complete CNTG Trend Analysis ➞ | |
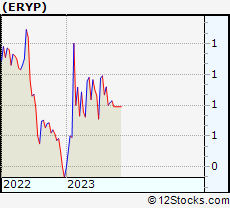 | ERYP ERYTECH Pharma S.A. |
| Sector: Health Care | |
| SubSector: Biotechnology | |
| MarketCap: 76.5785 Millions | |
| Recent Price: 0.79 Smart Investing & Trading Score: 20 | |
| Day Percent Change: 0% Day Change: -9999 | |
| Week Change: 0% Year-to-date Change: 0.0% | |
| ERYP Links: Profile News Message Board | |
| Charts:- Daily , Weekly | |
| Add ERYP to Watchlist: View: Get Complete ERYP Trend Analysis ➞ | |
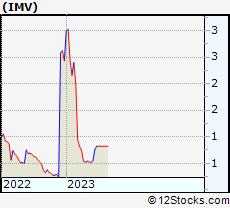 | IMV IMV Inc. |
| Sector: Health Care | |
| SubSector: Biotechnology | |
| MarketCap: 89.1785 Millions | |
| Recent Price: 0.08 Smart Investing & Trading Score: 20 | |
| Day Percent Change: 0% Day Change: -9999 | |
| Week Change: -1.09756% Year-to-date Change: 0.0% | |
| IMV Links: Profile News Message Board | |
| Charts:- Daily , Weekly | |
| Add IMV to Watchlist: View: Get Complete IMV Trend Analysis ➞ | |
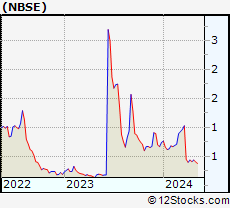 | NBSE NeuBase Therapeutics, Inc. |
| Sector: Health Care | |
| SubSector: Biotechnology | |
| MarketCap: 98.2785 Millions | |
| Recent Price: 0.38 Smart Investing & Trading Score: 20 | |
| Day Percent Change: 0% Day Change: -9999 | |
| Week Change: 0% Year-to-date Change: 0.0% | |
| NBSE Links: Profile News Message Board | |
| Charts:- Daily , Weekly | |
| Add NBSE to Watchlist: View: Get Complete NBSE Trend Analysis ➞ | |
 | ISEE IVERIC bio, Inc. |
| Sector: Health Care | |
| SubSector: Biotechnology | |
| MarketCap: 174.085 Millions | |
| Recent Price: 39.95 Smart Investing & Trading Score: 20 | |
| Day Percent Change: 0% Day Change: -9999 | |
| Week Change: 0% Year-to-date Change: 0.0% | |
| ISEE Links: Profile News Message Board | |
| Charts:- Daily , Weekly | |
| Add ISEE to Watchlist: View: Get Complete ISEE Trend Analysis ➞ | |
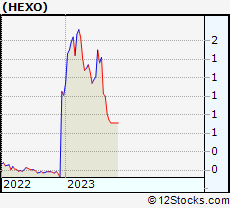 | HEXO HEXO Corp. |
| Sector: Health Care | |
| SubSector: Drugs - Generic | |
| MarketCap: 185.385 Millions | |
| Recent Price: 0.71 Smart Investing & Trading Score: 20 | |
| Day Percent Change: 0% Day Change: -9999 | |
| Week Change: 0% Year-to-date Change: 0.0% | |
| HEXO Links: Profile News Message Board | |
| Charts:- Daily , Weekly | |
| Add HEXO to Watchlist: View: Get Complete HEXO Trend Analysis ➞ | |
 | CALT Calliditas Therapeutics AB (publ) |
| Sector: Health Care | |
| SubSector: Drug Manufacturers Specialty & Generic | |
| MarketCap: 83487 Millions | |
| Recent Price: 40.00 Smart Investing & Trading Score: 20 | |
| Day Percent Change: 0% Day Change: -9999 | |
| Week Change: -0.398157% Year-to-date Change: 0.0% | |
| CALT Links: Profile News Message Board | |
| Charts:- Daily , Weekly | |
| Add CALT to Watchlist: View: Get Complete CALT Trend Analysis ➞ | |
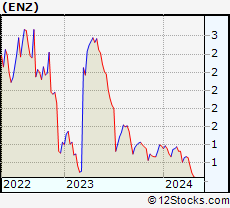 | ENZ Enzo Biochem, Inc. |
| Sector: Health Care | |
| SubSector: Medical Laboratories & Research | |
| MarketCap: 156.3 Millions | |
| Recent Price: 0.54 Smart Investing & Trading Score: 20 | |
| Day Percent Change: -0.0185185% Day Change: -9999 | |
| Week Change: -8.64636% Year-to-date Change: -25.0% | |
| ENZ Links: Profile News Message Board | |
| Charts:- Daily , Weekly | |
| Add ENZ to Watchlist: View: Get Complete ENZ Trend Analysis ➞ | |
 | CRMD CorMedix Inc |
| Sector: Health Care | |
| SubSector: Biotechnology | |
| MarketCap: 925.65 Millions | |
| Recent Price: 11.04 Smart Investing & Trading Score: 20 | |
| Day Percent Change: -0.081448% Day Change: 0.04 | |
| Week Change: -1.77046% Year-to-date Change: 34.3% | |
| CRMD Links: Profile News Message Board | |
| Charts:- Daily , Weekly | |
| Add CRMD to Watchlist: View: Get Complete CRMD Trend Analysis ➞ | |
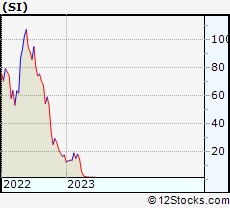 | SI Shoulder Innovations Inc |
| Sector: Health Care | |
| SubSector: Medical Devices | |
| MarketCap: 300.42 Millions | |
| Recent Price: 12.01 Smart Investing & Trading Score: 20 | |
| Day Percent Change: -0.0831947% Day Change: 0.1 | |
| Week Change: -6.827% Year-to-date Change: -20.2% | |
| SI Links: Profile News Message Board | |
| Charts:- Daily , Weekly | |
| Add SI to Watchlist: View: Get Complete SI Trend Analysis ➞ | |
 | WEAV Weave Communications Inc |
| Sector: Health Care | |
| SubSector: Health Information Services | |
| MarketCap: 597.03 Millions | |
| Recent Price: 6.55 Smart Investing & Trading Score: 20 | |
| Day Percent Change: -0.26% Day Change: -0.02 | |
| Week Change: -1.42% Year-to-date Change: -52.1% | |
| WEAV Links: Profile News Message Board | |
| Charts:- Daily , Weekly | |
| Add WEAV to Watchlist: View: Get Complete WEAV Trend Analysis ➞ | |
 | NRC National Research Corp |
| Sector: Health Care | |
| SubSector: Health Information Services | |
| MarketCap: 355.18 Millions | |
| Recent Price: 12.46 Smart Investing & Trading Score: 20 | |
| Day Percent Change: -0.32% Day Change: -1.21 | |
| Week Change: -14.3643% Year-to-date Change: -26.8% | |
| NRC Links: Profile News Message Board | |
| Charts:- Daily , Weekly | |
| Add NRC to Watchlist: View: Get Complete NRC Trend Analysis ➞ | |
 | ORGO Organogenesis Holdings Inc |
| Sector: Health Care | |
| SubSector: Drug Manufacturers - Specialty & Generic | |
| MarketCap: 634.29 Millions | |
| Recent Price: 4.22 Smart Investing & Trading Score: 20 | |
| Day Percent Change: -0.353774% Day Change: -0.11 | |
| Week Change: -13.7755% Year-to-date Change: 39.4% | |
| ORGO Links: Profile News Message Board | |
| Charts:- Daily , Weekly | |
| Add ORGO to Watchlist: View: Get Complete ORGO Trend Analysis ➞ | |
 | ABT Abbott Laboratories |
| Sector: Health Care | |
| SubSector: Medical Devices | |
| MarketCap: 231377 Millions | |
| Recent Price: 132.99 Smart Investing & Trading Score: 20 | |
| Day Percent Change: -0.359631% Day Change: -0.27 | |
| Week Change: -0.672194% Year-to-date Change: 18.9% | |
| ABT Links: Profile News Message Board | |
| Charts:- Daily , Weekly | |
| Add ABT to Watchlist: View: Get Complete ABT Trend Analysis ➞ | |
 | GOSS Gossamer Bio Inc |
| Sector: Health Care | |
| SubSector: Biotechnology | |
| MarketCap: 668.5 Millions | |
| Recent Price: 2.48 Smart Investing & Trading Score: 20 | |
| Day Percent Change: -0.401606% Day Change: 0.22 | |
| Week Change: -17.0569% Year-to-date Change: 155.7% | |
| GOSS Links: Profile News Message Board | |
| Charts:- Daily , Weekly | |
| Add GOSS to Watchlist: View: Get Complete GOSS Trend Analysis ➞ | |
| For tabular summary view of above stock list: Summary View ➞ 0 - 25 , 25 - 50 , 50 - 75 , 75 - 100 , 100 - 125 , 125 - 150 , 150 - 175 , 175 - 200 , 200 - 225 , 225 - 250 , 250 - 275 , 275 - 300 , 300 - 325 , 325 - 350 , 350 - 375 , 375 - 400 , 400 - 425 , 425 - 450 , 450 - 475 , 475 - 500 , 500 - 525 , 525 - 550 , 550 - 575 , 575 - 600 , 600 - 625 , 625 - 650 , 650 - 675 , 675 - 700 , 700 - 725 , 725 - 750 , 750 - 775 , 775 - 800 , 800 - 825 , 825 - 850 , 850 - 875 , 875 - 900 , 900 - 925 , 925 - 950 , 950 - 975 , 975 - 1000 | ||
| Click To Change The Sort Order: By Market Cap or Company Size Performance: Year-to-date, Week and Day | |
| Select Chart Type: | ||
|
Best Stocks Today 12Stocks.com |
© 2025 12Stocks.com Terms & Conditions Privacy Contact Us
All Information Provided Only For Education And Not To Be Used For Investing or Trading. See Terms & Conditions


One More Thing ... Get Best Stocks Delivered Daily!
Never Ever Miss A Move With Our Top Ten Stocks Lists
Find Best Stocks In Any Market - Bull or Bear Market
Take A Peek At Our Top Ten Stocks Lists: Daily, Weekly, Year-to-Date & Top Trends
Find Best Stocks In Any Market - Bull or Bear Market
Take A Peek At Our Top Ten Stocks Lists: Daily, Weekly, Year-to-Date & Top Trends
Healthcare Stocks With Best Up Trends [0-bearish to 100-bullish]: Taysha Gene[100], DBV Technologies[100], Valneva SE[100], ClearPoint Neuro[100], Prime Medicine[100], AlloVir [100], Sarepta [100], Monopar [100], Cara [100], Absci Corp[100], Spruce Biosciences[100]
Best Healthcare Stocks Year-to-Date:
Regencell Bioscience[12636.6%], Kaleido BioSciences[9900%], Vor Biopharma[3175%], Nanobiotix ADR[581.379%], Eagle [542.857%], So-Young [395.711%], I-Mab ADR[357.506%], Monopar [337.489%], Nektar [319.84%], 908 Devices[299.543%], DBV Technologies[276.923%] Best Healthcare Stocks This Week:
Athersys [193287%], Nobilis Health[101349%], VBI Vaccines[86898.5%], ContraFect [47677.8%], Clovis Oncology[39610.5%], Endo [28369.6%], NanoString Technologies[17224.7%], Neptune Wellness[14100%], ViewRay [11470.2%], Mallkrodt [11382.1%], Achillion [10033.3%] Best Healthcare Stocks Daily:
Kaleido BioSciences[9900%], Neoleukin [332.665%], Syros [226.23%], Athenex [103.333%], Taysha Gene[53.4591%], DBV Technologies[21.6485%], Valneva SE[20.197%], ClearPoint Neuro[19.7991%], Prime Medicine[19.4097%], Accelerate Diagnostics[17.6471%], Aptose Biosciences[17.5439%]