
 Login Sign Up


| |||||
 |  | ||||

| 12Stocks.com Market Intelligence |
Best Healthcare Stocks
 | "Discover best trending healthcare stocks with 12Stocks.com." |
| - Subu Vdaygiri, Founder, 12Stocks.com |
| In a hurry? Healthcare Stocks Lists: Performance Trends Table, Stock Charts
Sort Healthcare stocks: Daily, Weekly, Year-to-Date, Market Cap & Trends. Filter Healthcare stocks list by size:All Healthcare Large Mid-Range Small |
| 12Stocks.com Healthcare Stocks Performances & Trends Daily | |||||||||
|
|  The overall Smart Investing & Trading Score is 100 (0-bearish to 100-bullish) which puts Healthcare sector in short term bullish trend. The Smart Investing & Trading Score from previous trading session is 70 and an improvement of trend continues.
| ||||||||
Here are the Smart Investing & Trading Scores of the most requested Healthcare stocks at 12Stocks.com (click stock name for detailed review):
|


| 12Stocks.com: Investing in Healthcare sector with Stocks | |
|
The following table helps investors and traders sort through current performance and trends (as measured by Smart Investing & Trading Score) of various
stocks in the Healthcare sector. Quick View: Move mouse or cursor over stock symbol (ticker) to view short-term Technical chart and over stock name to view long term chart. Click on  to add stock symbol to your watchlist and to add stock symbol to your watchlist and  to view watchlist. Click on any ticker or stock name for detailed market intelligence report for that stock. to view watchlist. Click on any ticker or stock name for detailed market intelligence report for that stock. |
12Stocks.com Performance of Stocks in Healthcare Sector
| Ticker | Stock Name | Watchlist | Category | Recent Price | Smart Investing & Trading Score | Change % | YTD Change% |
| RNLX | Renalytix AI |   | Diagnostics & Research | 0.14 | 30 | 0.92% | 0.00% |
| IPXL | Impax | | Pharmaceutical | 16.67 | 30 | 0.73% | 0.00% |
| BTMD | biote Corp | | Medical Care Facilities | 3.00 | 30 | 0.67% | -50.25% |
| HSIC | Henry Schein | | Medical Distribution | 66.03 | 30 | 0.66% | -3.68% |
| MBOT | Microbot | | Instruments | 3.18 | 30 | 0.63% | 178.95% |
| OM | Outset | | Medical Devices | 14.09 | 30 | 0.50% | -19.72% |
| PTI | Proteostasis | | Biotechnology | 18.73 | 30 | 0.48% | 0.00% |
| GRTX | Galera | | Biotechnology | 0.02 | 30 | 0.44% | -43.64% |
| NSPR | InspireMD | | Medical Devices | 2.41 | 30 | 0.42% | -9.40% |
| CHE | Chemed Corp | | Medical Care Facilities | 442.04 | 30 | 0.32% | -16.01% |
| LBIO | Lion Biotechnologies | | Biotechnology | 38.34 | 30 | 0.08% | 0.00% |
| THRX | Theseus | | Biotechnology | 4.06 | 30 | 0.00% | 0.00% |
| PPD | PPD | | Drug Manufacturers Specialty & Generic | 47.28 | 30 | 0.00% | 0.00% |
| STSA | Satsuma | | Biotechnology | 1.10 | 30 | 0.00% | 0.00% |
| ABMD | Abiomed | | Equipment | 381.02 | 30 | 0.00% | 0.00% |
| ABAX | Abaxis | | Laboratories | 11.08 | 30 | 0.00% | 0.00% |
| BLU | BELLUS Health | | Biotechnology | 14.74 | 30 | 0.00% | 0.00% |
| LJPC | La Jolla | | Biotechnology | 6.22 | 30 | 0.00% | 0.00% |
| THRD | Third Harmonic | | Biotechnology | 5.38 | 30 | 0.00% | -51.27% |
| OSH | Oak Street | | Medical Care Facilities | 39.00 | 30 | 0.00% | 0.00% |
| IMDZ | Immune Design | | Biotechnology | 7.07 | 30 | 0.00% | 0.00% |
| SAGE | Sage | | Biotechnology | 8.68 | 30 | 0.00% | 50.17% |
| MYOV | Myovant Sciences | | Biotechnology | 26.98 | 30 | 0.00% | 0.00% |
| ENOB | Enochian Biosciences | | Biotechnology | 0.70 | 30 | 0.00% | 0.00% |
| PRVB | Provention Bio | | Biotechnology | 24.98 | 30 | 0.00% | 0.00% |
| For chart view version of above stock list: Chart View ➞ 0 - 25 , 25 - 50 , 50 - 75 , 75 - 100 , 100 - 125 , 125 - 150 , 150 - 175 , 175 - 200 , 200 - 225 , 225 - 250 , 250 - 275 , 275 - 300 , 300 - 325 , 325 - 350 , 350 - 375 , 375 - 400 , 400 - 425 , 425 - 450 , 450 - 475 , 475 - 500 , 500 - 525 , 525 - 550 , 550 - 575 , 575 - 600 , 600 - 625 , 625 - 650 , 650 - 675 , 675 - 700 , 700 - 725 , 725 - 750 , 750 - 775 , 775 - 800 , 800 - 825 , 825 - 850 , 850 - 875 , 875 - 900 , 900 - 925 , 925 - 950 , 950 - 975 , 975 - 1000 | ||
 | Click To Change The Sort Order: By Market Cap or Company Size Performance: Year-to-date, Week and Day |  |
|
Get the most comprehensive stock market coverage daily at 12Stocks.com ➞ Best Stocks Today ➞ Best Stocks Weekly ➞ Best Stocks Year-to-Date ➞ Best Stocks Trends ➞  Best Stocks Today 12Stocks.com Best Nasdaq Stocks ➞ Best S&P 500 Stocks ➞ Best Tech Stocks ➞ Best Biotech Stocks ➞ |
| Detailed Overview of Healthcare Stocks |
| Healthcare Technical Overview, Leaders & Laggards, Top Healthcare ETF Funds & Detailed Healthcare Stocks List, Charts, Trends & More |
| Healthcare Sector: Technical Analysis, Trends & YTD Performance | |
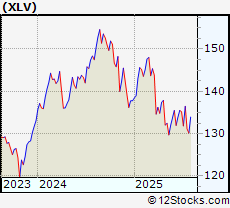
| Healthcare sector is composed of stocks
from pharmaceutical, biotech, diagnostics labs, insurance providers
and healthcare services. Healthcare sector, as represented by XLV, an exchange-traded fund [ETF] that holds basket of Healthcare stocks (e.g, Merck, Amgen) is up by 4.95646% and is currently underperforming the overall market by -9.80144% year-to-date. Below is a quick view of Technical charts and trends: |
|
 XLV Weekly Chart |
|
| Long Term Trend: Very Good | |
| Medium Term Trend: Very Good | |
 XLV Daily Chart |
|
| Short Term Trend: Very Good | |
| Overall Trend Score: 100 | |
| YTD Performance: 4.95646% | |
| **Trend Scores & Views Are Only For Educational Purposes And Not For Investing | |
| 12Stocks.com: Top Performing Healthcare Sector Stocks | ||||||||||||||||||||||||||||||||||||||||||||||
 The top performing Healthcare sector stocks year to date are
Now, more recently, over last week, the top performing Healthcare sector stocks on the move are


|
||||||||||||||||||||||||||||||||||||||||||||||
| 12Stocks.com: Investing in Healthcare Sector using Exchange Traded Funds | |
|
The following table shows list of key exchange traded funds (ETF) that
help investors track Healthcare Index. For detailed view, check out our ETF Funds section of our website. Quick View: Move mouse or cursor over ETF symbol (ticker) to view short-term Technical chart and over ETF name to view long term chart. Click on ticker or stock name for detailed view. Click on to add stock symbol to your watchlist and to view watchlist. |
12Stocks.com List of ETFs that track Healthcare Index
| Ticker | ETF Name | Watchlist | Recent Price | Smart Investing & Trading Score | Change % | Week % | Year-to-date % |
| BTEC | Principal Healthcare Innovators | | 39.49 | 30 | 0 | 1.02328 | 0% |
| 12Stocks.com: Charts, Trends, Fundamental Data and Performances of Healthcare Stocks | |
|
We now take in-depth look at all Healthcare stocks including charts, multi-period performances and overall trends (as measured by Smart Investing & Trading Score). One can sort Healthcare stocks (click link to choose) by Daily, Weekly and by Year-to-Date performances. Also, one can sort by size of the company or by market capitalization. |
| Select Your Default Chart Type: | |||||
| |||||
| Click on stock symbol or name for detailed view. Click on to add stock symbol to your watchlist and to view watchlist. Quick View: Move mouse or cursor over "Daily" to quickly view daily Technical stock chart and over "Weekly" to view weekly Technical stock chart. | |||||

 | RNLX Renalytix AI plc |
| Sector: Health Care | |
| SubSector: Diagnostics & Research | |
| MarketCap: 45487 Millions | |
| Recent Price: 0.14 Smart Investing & Trading Score: 30 | |
| Day Percent Change: 0.923952% Day Change: -9999 | |
| Week Change: -2.20386% Year-to-date Change: 0.0% | |
| RNLX Links: Profile News Message Board | |
| Charts:- Daily , Weekly | |
| Add RNLX to Watchlist: View: Get Complete RNLX Trend Analysis ➞ | |
 | IPXL Impax Laboratories, Inc. |
| Sector: Health Care | |
| SubSector: Drug Manufacturers - Major | |
| MarketCap: 697.54 Millions | |
| Recent Price: 16.67 Smart Investing & Trading Score: 30 | |
| Day Percent Change: 0.725076% Day Change: -9999 | |
| Week Change: -8.65753% Year-to-date Change: 0.0% | |
| IPXL Links: Profile News Message Board | |
| Charts:- Daily , Weekly | |
| Add IPXL to Watchlist: View: Get Complete IPXL Trend Analysis ➞ | |
 | BTMD biote Corp |
| Sector: Health Care | |
| SubSector: Medical Care Facilities | |
| MarketCap: 171.06 Millions | |
| Recent Price: 3.00 Smart Investing & Trading Score: 30 | |
| Day Percent Change: 0.671141% Day Change: 0.05 | |
| Week Change: 0.671141% Year-to-date Change: -50.2% | |
| BTMD Links: Profile News Message Board | |
| Charts:- Daily , Weekly | |
| Add BTMD to Watchlist: View: Get Complete BTMD Trend Analysis ➞ | |
 | HSIC Henry Schein Inc |
| Sector: Health Care | |
| SubSector: Medical Distribution | |
| MarketCap: 8419.67 Millions | |
| Recent Price: 66.03 Smart Investing & Trading Score: 30 | |
| Day Percent Change: 0.655488% Day Change: 0.26 | |
| Week Change: -2.53875% Year-to-date Change: -3.7% | |
| HSIC Links: Profile News Message Board | |
| Charts:- Daily , Weekly | |
| Add HSIC to Watchlist: View: Get Complete HSIC Trend Analysis ➞ | |
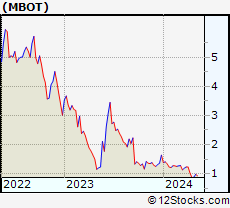 | MBOT Microbot Medical Inc |
| Sector: Health Care | |
| SubSector: Medical Instruments & Supplies | |
| MarketCap: 166.7 Millions | |
| Recent Price: 3.18 Smart Investing & Trading Score: 30 | |
| Day Percent Change: 0.632911% Day Change: 0.25 | |
| Week Change: -5.07463% Year-to-date Change: 178.9% | |
| MBOT Links: Profile News Message Board | |
| Charts:- Daily , Weekly | |
| Add MBOT to Watchlist: View: Get Complete MBOT Trend Analysis ➞ | |
 | OM Outset Medical Inc |
| Sector: Health Care | |
| SubSector: Medical Devices | |
| MarketCap: 248.61 Millions | |
| Recent Price: 14.09 Smart Investing & Trading Score: 30 | |
| Day Percent Change: 0.499287% Day Change: 0.33 | |
| Week Change: -4.73293% Year-to-date Change: -19.7% | |
| OM Links: Profile News Message Board | |
| Charts:- Daily , Weekly | |
| Add OM to Watchlist: View: Get Complete OM Trend Analysis ➞ | |
 | PTI Proteostasis Therapeutics, Inc. |
| Sector: Health Care | |
| SubSector: Biotechnology | |
| MarketCap: 79.8785 Millions | |
| Recent Price: 18.73 Smart Investing & Trading Score: 30 | |
| Day Percent Change: 0.482833% Day Change: -9999 | |
| Week Change: -60.7913% Year-to-date Change: 0.0% | |
| PTI Links: Profile News Message Board | |
| Charts:- Daily , Weekly | |
| Add PTI to Watchlist: View: Get Complete PTI Trend Analysis ➞ | |
 | GRTX Galera Therapeutics, Inc. |
| Sector: Health Care | |
| SubSector: Biotechnology | |
| MarketCap: 277.585 Millions | |
| Recent Price: 0.02 Smart Investing & Trading Score: 30 | |
| Day Percent Change: 0.444444% Day Change: -9999 | |
| Week Change: -1.73913% Year-to-date Change: -43.6% | |
| GRTX Links: Profile News Message Board | |
| Charts:- Daily , Weekly | |
| Add GRTX to Watchlist: View: Get Complete GRTX Trend Analysis ➞ | |
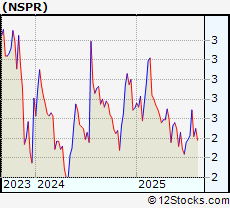 | NSPR InspireMD Inc |
| Sector: Health Care | |
| SubSector: Medical Devices | |
| MarketCap: 100.96 Millions | |
| Recent Price: 2.41 Smart Investing & Trading Score: 30 | |
| Day Percent Change: 0.416667% Day Change: -0.08 | |
| Week Change: -0.413223% Year-to-date Change: -9.4% | |
| NSPR Links: Profile News Message Board | |
| Charts:- Daily , Weekly | |
| Add NSPR to Watchlist: View: Get Complete NSPR Trend Analysis ➞ | |
 | CHE Chemed Corp |
| Sector: Health Care | |
| SubSector: Medical Care Facilities | |
| MarketCap: 6785.02 Millions | |
| Recent Price: 442.04 Smart Investing & Trading Score: 30 | |
| Day Percent Change: 0.31772% Day Change: 1.85 | |
| Week Change: -3.26929% Year-to-date Change: -16.0% | |
| CHE Links: Profile News Message Board | |
| Charts:- Daily , Weekly | |
| Add CHE to Watchlist: View: Get Complete CHE Trend Analysis ➞ | |
 | LBIO Lion Biotechnologies, Inc. |
| Sector: Health Care | |
| SubSector: Biotechnology | |
| MarketCap: 471.93 Millions | |
| Recent Price: 38.34 Smart Investing & Trading Score: 30 | |
| Day Percent Change: 0.0783085% Day Change: -9999 | |
| Week Change: -12.6452% Year-to-date Change: 0.0% | |
| LBIO Links: Profile News Message Board | |
| Charts:- Daily , Weekly | |
| Add LBIO to Watchlist: View: Get Complete LBIO Trend Analysis ➞ | |
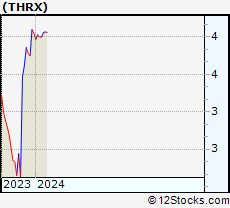 | THRX Theseus Pharmaceuticals, Inc. |
| Sector: Health Care | |
| SubSector: Biotechnology | |
| MarketCap: 445 Millions | |
| Recent Price: 4.06 Smart Investing & Trading Score: 30 | |
| Day Percent Change: 0% Day Change: -9999 | |
| Week Change: -0.490196% Year-to-date Change: 0.0% | |
| THRX Links: Profile News Message Board | |
| Charts:- Daily , Weekly | |
| Add THRX to Watchlist: View: Get Complete THRX Trend Analysis ➞ | |
 | PPD PPD, Inc. |
| Sector: Health Care | |
| SubSector: Drug Manufacturers Specialty & Generic | |
| MarketCap: 12287 Millions | |
| Recent Price: 47.28 Smart Investing & Trading Score: 30 | |
| Day Percent Change: 0% Day Change: -9999 | |
| Week Change: 0% Year-to-date Change: 0.0% | |
| PPD Links: Profile News Message Board | |
| Charts:- Daily , Weekly | |
| Add PPD to Watchlist: View: Get Complete PPD Trend Analysis ➞ | |
 | STSA Satsuma Pharmaceuticals, Inc. |
| Sector: Health Care | |
| SubSector: Biotechnology | |
| MarketCap: 836.185 Millions | |
| Recent Price: 1.10 Smart Investing & Trading Score: 30 | |
| Day Percent Change: 0% Day Change: -9999 | |
| Week Change: 0% Year-to-date Change: 0.0% | |
| STSA Links: Profile News Message Board | |
| Charts:- Daily , Weekly | |
| Add STSA to Watchlist: View: Get Complete STSA Trend Analysis ➞ | |
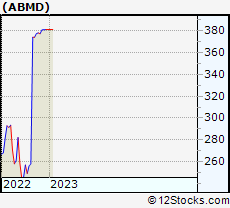 | ABMD Abiomed, Inc. |
| Sector: Health Care | |
| SubSector: Medical Appliances & Equipment | |
| MarketCap: 6488.9 Millions | |
| Recent Price: 381.02 Smart Investing & Trading Score: 30 | |
| Day Percent Change: 0% Day Change: -9999 | |
| Week Change: 0% Year-to-date Change: 0.0% | |
| ABMD Links: Profile News Message Board | |
| Charts:- Daily , Weekly | |
| Add ABMD to Watchlist: View: Get Complete ABMD Trend Analysis ➞ | |
 | ABAX Abaxis, Inc. |
| Sector: Health Care | |
| SubSector: Medical Laboratories & Research | |
| MarketCap: 1098.82 Millions | |
| Recent Price: 11.08 Smart Investing & Trading Score: 30 | |
| Day Percent Change: 0% Day Change: -9999 | |
| Week Change: 13.9918% Year-to-date Change: 0.0% | |
| ABAX Links: Profile News Message Board | |
| Charts:- Daily , Weekly | |
| Add ABAX to Watchlist: View: Get Complete ABAX Trend Analysis ➞ | |
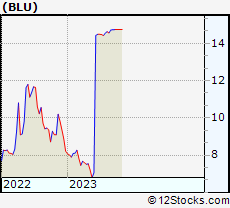 | BLU BELLUS Health Inc. |
| Sector: Health Care | |
| SubSector: Biotechnology | |
| MarketCap: 614.985 Millions | |
| Recent Price: 14.74 Smart Investing & Trading Score: 30 | |
| Day Percent Change: 0% Day Change: -9999 | |
| Week Change: 0% Year-to-date Change: 0.0% | |
| BLU Links: Profile News Message Board | |
| Charts:- Daily , Weekly | |
| Add BLU to Watchlist: View: Get Complete BLU Trend Analysis ➞ | |
 | LJPC La Jolla Pharmaceutical Company |
| Sector: Health Care | |
| SubSector: Biotechnology | |
| MarketCap: 138.185 Millions | |
| Recent Price: 6.22 Smart Investing & Trading Score: 30 | |
| Day Percent Change: 0% Day Change: -9999 | |
| Week Change: 0% Year-to-date Change: 0.0% | |
| LJPC Links: Profile News Message Board | |
| Charts:- Daily , Weekly | |
| Add LJPC to Watchlist: View: Get Complete LJPC Trend Analysis ➞ | |
 | THRD Third Harmonic Bio, Inc. |
| Sector: Health Care | |
| SubSector: Biotechnology | |
| MarketCap: 190 Millions | |
| Recent Price: 5.38 Smart Investing & Trading Score: 30 | |
| Day Percent Change: 0% Day Change: -9999 | |
| Week Change: 0% Year-to-date Change: -51.3% | |
| THRD Links: Profile News Message Board | |
| Charts:- Daily , Weekly | |
| Add THRD to Watchlist: View: Get Complete THRD Trend Analysis ➞ | |
 | OSH Oak Street Health, Inc. |
| Sector: Health Care | |
| SubSector: Medical Care Facilities | |
| MarketCap: 13467 Millions | |
| Recent Price: 39.00 Smart Investing & Trading Score: 30 | |
| Day Percent Change: 0% Day Change: -9999 | |
| Week Change: 0% Year-to-date Change: 0.0% | |
| OSH Links: Profile News Message Board | |
| Charts:- Daily , Weekly | |
| Add OSH to Watchlist: View: Get Complete OSH Trend Analysis ➞ | |
 | IMDZ Immune Design Corp. |
| Sector: Health Care | |
| SubSector: Biotechnology | |
| MarketCap: 162.8 Millions | |
| Recent Price: 7.07 Smart Investing & Trading Score: 30 | |
| Day Percent Change: 0% Day Change: -9999 | |
| Week Change: -1.80556% Year-to-date Change: 0.0% | |
| IMDZ Links: Profile News Message Board | |
| Charts:- Daily , Weekly | |
| Add IMDZ to Watchlist: View: Get Complete IMDZ Trend Analysis ➞ | |
 | SAGE Sage Therapeutics, Inc. |
| Sector: Health Care | |
| SubSector: Biotechnology | |
| MarketCap: 1683.75 Millions | |
| Recent Price: 8.68 Smart Investing & Trading Score: 30 | |
| Day Percent Change: 0% Day Change: -9999 | |
| Week Change: -1.02623% Year-to-date Change: 50.2% | |
| SAGE Links: Profile News Message Board | |
| Charts:- Daily , Weekly | |
| Add SAGE to Watchlist: View: Get Complete SAGE Trend Analysis ➞ | |
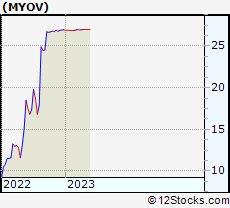 | MYOV Myovant Sciences Ltd. |
| Sector: Health Care | |
| SubSector: Biotechnology | |
| MarketCap: 814.985 Millions | |
| Recent Price: 26.98 Smart Investing & Trading Score: 30 | |
| Day Percent Change: 0% Day Change: -9999 | |
| Week Change: 0% Year-to-date Change: 0.0% | |
| MYOV Links: Profile News Message Board | |
| Charts:- Daily , Weekly | |
| Add MYOV to Watchlist: View: Get Complete MYOV Trend Analysis ➞ | |
 | ENOB Enochian Biosciences Inc. |
| Sector: Health Care | |
| SubSector: Biotechnology | |
| MarketCap: 120.685 Millions | |
| Recent Price: 0.70 Smart Investing & Trading Score: 30 | |
| Day Percent Change: 0% Day Change: -9999 | |
| Week Change: 0% Year-to-date Change: 0.0% | |
| ENOB Links: Profile News Message Board | |
| Charts:- Daily , Weekly | |
| Add ENOB to Watchlist: View: Get Complete ENOB Trend Analysis ➞ | |
 | PRVB Provention Bio, Inc. |
| Sector: Health Care | |
| SubSector: Biotechnology | |
| MarketCap: 397.685 Millions | |
| Recent Price: 24.98 Smart Investing & Trading Score: 30 | |
| Day Percent Change: 0% Day Change: -9999 | |
| Week Change: 0% Year-to-date Change: 0.0% | |
| PRVB Links: Profile News Message Board | |
| Charts:- Daily , Weekly | |
| Add PRVB to Watchlist: View: Get Complete PRVB Trend Analysis ➞ | |
| For tabular summary view of above stock list: Summary View ➞ 0 - 25 , 25 - 50 , 50 - 75 , 75 - 100 , 100 - 125 , 125 - 150 , 150 - 175 , 175 - 200 , 200 - 225 , 225 - 250 , 250 - 275 , 275 - 300 , 300 - 325 , 325 - 350 , 350 - 375 , 375 - 400 , 400 - 425 , 425 - 450 , 450 - 475 , 475 - 500 , 500 - 525 , 525 - 550 , 550 - 575 , 575 - 600 , 600 - 625 , 625 - 650 , 650 - 675 , 675 - 700 , 700 - 725 , 725 - 750 , 750 - 775 , 775 - 800 , 800 - 825 , 825 - 850 , 850 - 875 , 875 - 900 , 900 - 925 , 925 - 950 , 950 - 975 , 975 - 1000 | ||
| Click To Change The Sort Order: By Market Cap or Company Size Performance: Year-to-date, Week and Day | |
| Select Chart Type: | ||
|
Best Stocks Today 12Stocks.com |
© 2025 12Stocks.com Terms & Conditions Privacy Contact Us
All Information Provided Only For Education And Not To Be Used For Investing or Trading. See Terms & Conditions


One More Thing ... Get Best Stocks Delivered Daily!
Never Ever Miss A Move With Our Top Ten Stocks Lists
Find Best Stocks In Any Market - Bull or Bear Market
Take A Peek At Our Top Ten Stocks Lists: Daily, Weekly, Year-to-Date & Top Trends
Find Best Stocks In Any Market - Bull or Bear Market
Take A Peek At Our Top Ten Stocks Lists: Daily, Weekly, Year-to-Date & Top Trends
Healthcare Stocks With Best Up Trends [0-bearish to 100-bullish]: Taysha Gene[100], DBV Technologies[100], Valneva SE[100], ClearPoint Neuro[100], Prime Medicine[100], AlloVir [100], Sarepta [100], Monopar [100], Cara [100], Absci Corp[100], Spruce Biosciences[100]
Best Healthcare Stocks Year-to-Date:
Regencell Bioscience[12636.6%], Kaleido BioSciences[9900%], Vor Biopharma[3175%], Nanobiotix ADR[581.379%], Eagle [542.857%], So-Young [395.711%], I-Mab ADR[357.506%], Monopar [337.489%], Nektar [319.84%], 908 Devices[299.543%], DBV Technologies[276.923%] Best Healthcare Stocks This Week:
Athersys [193287%], Nobilis Health[101349%], VBI Vaccines[86898.5%], ContraFect [47677.8%], Clovis Oncology[39610.5%], Endo [28369.6%], NanoString Technologies[17224.7%], Neptune Wellness[14100%], ViewRay [11470.2%], Mallkrodt [11382.1%], Achillion [10033.3%] Best Healthcare Stocks Daily:
Kaleido BioSciences[9900%], Neoleukin [332.665%], Syros [226.23%], Athenex [103.333%], Taysha Gene[53.4591%], DBV Technologies[21.6485%], Valneva SE[20.197%], ClearPoint Neuro[19.7991%], Prime Medicine[19.4097%], Accelerate Diagnostics[17.6471%], Aptose Biosciences[17.5439%]