
 Login Sign Up


| |||||
 |  | ||||

| 12Stocks.com Market Intelligence |
Best Healthcare Stocks
 | "Discover best trending healthcare stocks with 12Stocks.com." |
| - Subu Vdaygiri, Founder, 12Stocks.com |
| In a hurry? Healthcare Stocks Lists: Performance Trends Table, Stock Charts
Sort Healthcare stocks: Daily, Weekly, Year-to-Date, Market Cap & Trends. Filter Healthcare stocks list by size:All Healthcare Large Mid-Range Small |
| 12Stocks.com Healthcare Stocks Performances & Trends Daily | |||||||||
|
|  The overall Smart Investing & Trading Score is 90 (0-bearish to 100-bullish) which puts Healthcare sector in short term bullish trend. The Smart Investing & Trading Score from previous trading session is 70 and an improvement of trend continues.
| ||||||||
Here are the Smart Investing & Trading Scores of the most requested Healthcare stocks at 12Stocks.com (click stock name for detailed review):
|


| 12Stocks.com: Investing in Healthcare sector with Stocks | |
|
The following table helps investors and traders sort through current performance and trends (as measured by Smart Investing & Trading Score) of various
stocks in the Healthcare sector. Quick View: Move mouse or cursor over stock symbol (ticker) to view short-term Technical chart and over stock name to view long term chart. Click on  to add stock symbol to your watchlist and to add stock symbol to your watchlist and  to view watchlist. Click on any ticker or stock name for detailed market intelligence report for that stock. to view watchlist. Click on any ticker or stock name for detailed market intelligence report for that stock. |
12Stocks.com Performance of Stocks in Healthcare Sector
| Ticker | Stock Name | Watchlist | Category | Recent Price | Smart Investing & Trading Score | Change % | Weekly Change% |
| RGNX | Regenxbio |   | Biotechnology | 8.93 | 100 | 0.50% | -10.49% |
| SAVA | Cassava Sciences | | Biotechnology | 2.28 | 20 | 0.47% | -10.79% |
| NNOX | Nano X | | Medical Devices | 3.87 | 10 | 2.69% | -10.89% |
| ICCC | Immucell Corp | | Biotechnology | 6.40 | 60 | -1.04% | -11.01% |
| MGNX | Macrogenics | | Biotechnology | 1.77 | 80 | -3.36% | -11.11% |
| MNPR | Monopar | | Biotechnology | 34.15 | 100 | -3.52% | -11.21% |
| ACB | Aurora Cannabis | | Drug Manufacturers - Specialty & Generic | 5.42 | 20 | 1.27% | -11.32% |
| PRME | Prime Medicine | | Biotechnology | 3.24 | 70 | -0.62% | -11.54% |
| VTYX | Ventyx Biosciences | | Biotechnology | 2.40 | 54 | 3.52% | -11.67% |
| CLDX | Celldex | | Biotechnology | 22.08 | 70 | 5.41% | -11.71% |
| CLPT | ClearPoint Neuro | | Medical Devices | 10.49 | 60 | -1.25% | -12.33% |
| BYSI | BeyondSpring | | Biotechnology | 1.72 | 30 | 2.33% | -12.44% |
| SMLR | Semler Scientific | | Medical Devices | 29.64 | 10 | -3.56% | -14.32% |
| MASS | 908 Devices | | Medical Devices | 6.25 | 0 | 0.67% | -14.85% |
| HYPR | Hyperfine | | Medical Devices | 1.24 | 40 | -3.91% | -15.17% |
| RXRX | Recursion | | Biotechnology | 4.70 | 10 | 0.21% | -15.25% |
| CGC | Canopy Growth | | Drug Manufacturers - Specialty & Generic | 1.80 | 60 | 2.48% | -16.78% |
| PROF | Profound | | Medical Devices | 4.47 | 0 | -0.86% | -16.97% |
| HUMA | Humacyte | | Biotechnology | 1.55 | 20 | -5.52% | -18.09% |
| RCEL | AVITA | | Medical Devices | 4.34 | 20 | 1.28% | -18.10% |
| NVAX | Novavax | | Biotechnology | 7.47 | 60 | -12.70% | -19.09% |
| SY | So-Young | | Health Information | 3.84 | 40 | -4.19% | -19.63% |
| CTSO | Cytosorbents Corp | | Medical Devices | 0.94 | 50 | -5.58% | -25.96% |
| VKTX | Viking | | Biotechnology | 27.05 | 50 | -0.12% | -36.23% |
| TNXP | Tonix | | Biotechnology | 29.63 | 10 | -0.55% | -39.83% |
| For chart view version of above stock list: Chart View ➞ 0 - 25 , 25 - 50 , 50 - 75 , 75 - 100 , 100 - 125 , 125 - 150 , 150 - 175 , 175 - 200 , 200 - 225 , 225 - 250 , 250 - 275 , 275 - 300 , 300 - 325 , 325 - 350 , 350 - 375 , 375 - 400 , 400 - 425 , 425 - 450 , 450 - 475 , 475 - 500 , 500 - 525 , 525 - 550 , 550 - 575 , 575 - 600 , 600 - 625 | ||
 | Click To Change The Sort Order: By Market Cap or Company Size Performance: Year-to-date, Week and Day |  |
|
Get the most comprehensive stock market coverage daily at 12Stocks.com ➞ Best Stocks Today ➞ Best Stocks Weekly ➞ Best Stocks Year-to-Date ➞ Best Stocks Trends ➞  Best Stocks Today 12Stocks.com Best Nasdaq Stocks ➞ Best S&P 500 Stocks ➞ Best Tech Stocks ➞ Best Biotech Stocks ➞ |
| Detailed Overview of Healthcare Stocks |
| Healthcare Technical Overview, Leaders & Laggards, Top Healthcare ETF Funds & Detailed Healthcare Stocks List, Charts, Trends & More |
| Healthcare Sector: Technical Analysis, Trends & YTD Performance | |
| Healthcare sector is composed of stocks
from pharmaceutical, biotech, diagnostics labs, insurance providers
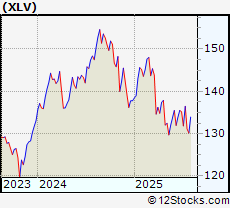
and healthcare services. Healthcare sector, as represented by XLV, an exchange-traded fund [ETF] that holds basket of Healthcare stocks (e.g, Merck, Amgen) is down by -5.29% and is currently underperforming the overall market by -13.01% year-to-date. Below is a quick view of Technical charts and trends: |
|
 XLV Weekly Chart |
|
| Long Term Trend: Very Good | |
| Medium Term Trend: Very Good | |
 XLV Daily Chart |
|
| Short Term Trend: Good | |
| Overall Trend Score: 90 | |
| YTD Performance: -5.29% | |
| **Trend Scores & Views Are Only For Educational Purposes And Not For Investing | |
| 12Stocks.com: Top Performing Healthcare Sector Stocks | |||||||||||||||||||||||||||||||||||||||||||||||
 The top performing Healthcare sector stocks year to date are
Now, more recently, over last week, the top performing Healthcare sector stocks on the move are


|
|||||||||||||||||||||||||||||||||||||||||||||||
| 12Stocks.com: Investing in Healthcare Sector using Exchange Traded Funds | |
|
The following table shows list of key exchange traded funds (ETF) that
help investors track Healthcare Index. For detailed view, check out our ETF Funds section of our website. Quick View: Move mouse or cursor over ETF symbol (ticker) to view short-term Technical chart and over ETF name to view long term chart. Click on ticker or stock name for detailed view. Click on to add stock symbol to your watchlist and to view watchlist. |
12Stocks.com List of ETFs that track Healthcare Index
| Ticker | ETF Name | Watchlist | Recent Price | Smart Investing & Trading Score | Change % | Week % | Year-to-date % |
| 12Stocks.com: Charts, Trends, Fundamental Data and Performances of Healthcare Stocks | |
|
We now take in-depth look at all Healthcare stocks including charts, multi-period performances and overall trends (as measured by Smart Investing & Trading Score). One can sort Healthcare stocks (click link to choose) by Daily, Weekly and by Year-to-Date performances. Also, one can sort by size of the company or by market capitalization. |
| Select Your Default Chart Type: | |||||
| |||||
| Click on stock symbol or name for detailed view. Click on to add stock symbol to your watchlist and to view watchlist. Quick View: Move mouse or cursor over "Daily" to quickly view daily Technical stock chart and over "Weekly" to view weekly Technical stock chart. | |||||

 | RGNX Regenxbio Inc |
| Sector: Health Care | |
| SubSector: Biotechnology | |
| MarketCap: 490.49 Millions | |
| Recent Price: 8.93 Smart Investing & Trading Score: 100 | |
| Day Percent Change: 0.5% Day Change: 0.04 | |
| Week Change: -10.49% Year-to-date Change: 4.9% | |
| RGNX Links: Profile News Message Board | |
| Charts:- Daily , Weekly | |
| Add RGNX to Watchlist: View: Get Complete RGNX Trend Analysis ➞ | |
 | SAVA Cassava Sciences Inc |
| Sector: Health Care | |
| SubSector: Biotechnology | |
| MarketCap: 104.35 Millions | |
| Recent Price: 2.28 Smart Investing & Trading Score: 20 | |
| Day Percent Change: 0.47% Day Change: 0.01 | |
| Week Change: -10.79% Year-to-date Change: -8.9% | |
| SAVA Links: Profile News Message Board | |
| Charts:- Daily , Weekly | |
| Add SAVA to Watchlist: View: Get Complete SAVA Trend Analysis ➞ | |
 | NNOX Nano X Imaging Ltd |
| Sector: Health Care | |
| SubSector: Medical Devices | |
| MarketCap: 235.28 Millions | |
| Recent Price: 3.87 Smart Investing & Trading Score: 10 | |
| Day Percent Change: 2.69% Day Change: 0.1 | |
| Week Change: -10.89% Year-to-date Change: -44.3% | |
| NNOX Links: Profile News Message Board | |
| Charts:- Daily , Weekly | |
| Add NNOX to Watchlist: View: Get Complete NNOX Trend Analysis ➞ | |
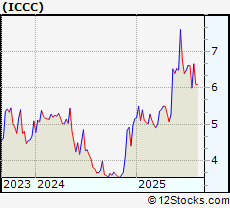 | ICCC Immucell Corp |
| Sector: Health Care | |
| SubSector: Biotechnology | |
| MarketCap: 57.26 Millions | |
| Recent Price: 6.40 Smart Investing & Trading Score: 60 | |
| Day Percent Change: -1.04% Day Change: -0.06 | |
| Week Change: -11.01% Year-to-date Change: 16.1% | |
| ICCC Links: Profile News Message Board | |
| Charts:- Daily , Weekly | |
| Add ICCC to Watchlist: View: Get Complete ICCC Trend Analysis ➞ | |
 | MGNX Macrogenics Inc |
| Sector: Health Care | |
| SubSector: Biotechnology | |
| MarketCap: 126.41 Millions | |
| Recent Price: 1.77 Smart Investing & Trading Score: 80 | |
| Day Percent Change: -3.36% Day Change: -0.05 | |
| Week Change: -11.11% Year-to-date Change: -55.7% | |
| MGNX Links: Profile News Message Board | |
| Charts:- Daily , Weekly | |
| Add MGNX to Watchlist: View: Get Complete MGNX Trend Analysis ➞ | |
 | MNPR Monopar Therapeutics Inc |
| Sector: Health Care | |
| SubSector: Biotechnology | |
| MarketCap: 272.77 Millions | |
| Recent Price: 34.15 Smart Investing & Trading Score: 100 | |
| Day Percent Change: -3.52% Day Change: -1.16 | |
| Week Change: -11.21% Year-to-date Change: 44.7% | |
| MNPR Links: Profile News Message Board | |
| Charts:- Daily , Weekly | |
| Add MNPR to Watchlist: View: Get Complete MNPR Trend Analysis ➞ | |
 | ACB Aurora Cannabis Inc |
| Sector: Health Care | |
| SubSector: Drug Manufacturers - Specialty & Generic | |
| MarketCap: 277.17 Millions | |
| Recent Price: 5.42 Smart Investing & Trading Score: 20 | |
| Day Percent Change: 1.27% Day Change: 0.06 | |
| Week Change: -11.32% Year-to-date Change: 12.5% | |
| ACB Links: Profile News Message Board | |
| Charts:- Daily , Weekly | |
| Add ACB to Watchlist: View: Get Complete ACB Trend Analysis ➞ | |
 | PRME Prime Medicine Inc |
| Sector: Health Care | |
| SubSector: Biotechnology | |
| MarketCap: 662.89 Millions | |
| Recent Price: 3.24 Smart Investing & Trading Score: 70 | |
| Day Percent Change: -0.62% Day Change: -0.02 | |
| Week Change: -11.54% Year-to-date Change: 10.3% | |
| PRME Links: Profile News Message Board | |
| Charts:- Daily , Weekly | |
| Add PRME to Watchlist: View: Get Complete PRME Trend Analysis ➞ | |
 | VTYX Ventyx Biosciences Inc |
| Sector: Health Care | |
| SubSector: Biotechnology | |
| MarketCap: 179.7 Millions | |
| Recent Price: 2.40 Smart Investing & Trading Score: 54 | |
| Day Percent Change: 3.52% Day Change: 0.09 | |
| Week Change: -11.67% Year-to-date Change: 21.0% | |
| VTYX Links: Profile News Message Board | |
| Charts:- Daily , Weekly | |
| Add VTYX to Watchlist: View: Get Complete VTYX Trend Analysis ➞ | |
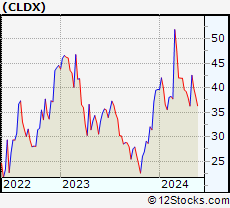 | CLDX Celldex Therapeutics Inc |
| Sector: Health Care | |
| SubSector: Biotechnology | |
| MarketCap: 1518.72 Millions | |
| Recent Price: 22.08 Smart Investing & Trading Score: 70 | |
| Day Percent Change: 5.41% Day Change: 1.13 | |
| Week Change: -11.71% Year-to-date Change: -12.9% | |
| CLDX Links: Profile News Message Board | |
| Charts:- Daily , Weekly | |
| Add CLDX to Watchlist: View: Get Complete CLDX Trend Analysis ➞ | |
 | CLPT ClearPoint Neuro Inc |
| Sector: Health Care | |
| SubSector: Medical Devices | |
| MarketCap: 314.12 Millions | |
| Recent Price: 10.49 Smart Investing & Trading Score: 60 | |
| Day Percent Change: -1.25% Day Change: -0.13 | |
| Week Change: -12.33% Year-to-date Change: -33.4% | |
| CLPT Links: Profile News Message Board | |
| Charts:- Daily , Weekly | |
| Add CLPT to Watchlist: View: Get Complete CLPT Trend Analysis ➞ | |
 | BYSI BeyondSpring Inc |
| Sector: Health Care | |
| SubSector: Biotechnology | |
| MarketCap: 75.02 Millions | |
| Recent Price: 1.72 Smart Investing & Trading Score: 30 | |
| Day Percent Change: 2.33% Day Change: 0.04 | |
| Week Change: -12.44% Year-to-date Change: 8.0% | |
| BYSI Links: Profile News Message Board | |
| Charts:- Daily , Weekly | |
| Add BYSI to Watchlist: View: Get Complete BYSI Trend Analysis ➞ | |
 | SMLR Semler Scientific Inc |
| Sector: Health Care | |
| SubSector: Medical Devices | |
| MarketCap: 416.31 Millions | |
| Recent Price: 29.64 Smart Investing & Trading Score: 10 | |
| Day Percent Change: -3.56% Day Change: -1.11 | |
| Week Change: -14.32% Year-to-date Change: -44.3% | |
| SMLR Links: Profile News Message Board | |
| Charts:- Daily , Weekly | |
| Add SMLR to Watchlist: View: Get Complete SMLR Trend Analysis ➞ | |
 | MASS 908 Devices Inc |
| Sector: Health Care | |
| SubSector: Medical Devices | |
| MarketCap: 196.31 Millions | |
| Recent Price: 6.25 Smart Investing & Trading Score: 0 | |
| Day Percent Change: 0.67% Day Change: 0.04 | |
| Week Change: -14.85% Year-to-date Change: 173.6% | |
| MASS Links: Profile News Message Board | |
| Charts:- Daily , Weekly | |
| Add MASS to Watchlist: View: Get Complete MASS Trend Analysis ➞ | |
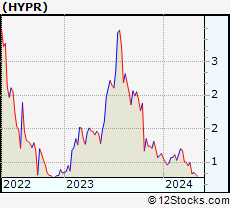 | HYPR Hyperfine Inc |
| Sector: Health Care | |
| SubSector: Medical Devices | |
| MarketCap: 91.94 Millions | |
| Recent Price: 1.24 Smart Investing & Trading Score: 40 | |
| Day Percent Change: -3.91% Day Change: -0.05 | |
| Week Change: -15.17% Year-to-date Change: 39.8% | |
| HYPR Links: Profile News Message Board | |
| Charts:- Daily , Weekly | |
| Add HYPR to Watchlist: View: Get Complete HYPR Trend Analysis ➞ | |
 | RXRX Recursion Pharmaceuticals Inc |
| Sector: Health Care | |
| SubSector: Biotechnology | |
| MarketCap: 2003.8 Millions | |
| Recent Price: 4.70 Smart Investing & Trading Score: 10 | |
| Day Percent Change: 0.21% Day Change: 0.01 | |
| Week Change: -15.25% Year-to-date Change: -29.3% | |
| RXRX Links: Profile News Message Board | |
| Charts:- Daily , Weekly | |
| Add RXRX to Watchlist: View: Get Complete RXRX Trend Analysis ➞ | |
 | CGC Canopy Growth Corporation |
| Sector: Health Care | |
| SubSector: Drug Manufacturers - Specialty & Generic | |
| MarketCap: 344.65 Millions | |
| Recent Price: 1.80 Smart Investing & Trading Score: 60 | |
| Day Percent Change: 2.48% Day Change: 0.03 | |
| Week Change: -16.78% Year-to-date Change: -54.7% | |
| CGC Links: Profile News Message Board | |
| Charts:- Daily , Weekly | |
| Add CGC to Watchlist: View: Get Complete CGC Trend Analysis ➞ | |
 | PROF Profound Medical Corp |
| Sector: Health Care | |
| SubSector: Medical Devices | |
| MarketCap: 123.81 Millions | |
| Recent Price: 4.47 Smart Investing & Trading Score: 0 | |
| Day Percent Change: -0.86% Day Change: -0.04 | |
| Week Change: -16.97% Year-to-date Change: -38.8% | |
| PROF Links: Profile News Message Board | |
| Charts:- Daily , Weekly | |
| Add PROF to Watchlist: View: Get Complete PROF Trend Analysis ➞ | |
 | HUMA Humacyte Inc |
| Sector: Health Care | |
| SubSector: Biotechnology | |
| MarketCap: 226.47 Millions | |
| Recent Price: 1.55 Smart Investing & Trading Score: 20 | |
| Day Percent Change: -5.52% Day Change: -0.09 | |
| Week Change: -18.09% Year-to-date Change: -69.5% | |
| HUMA Links: Profile News Message Board | |
| Charts:- Daily , Weekly | |
| Add HUMA to Watchlist: View: Get Complete HUMA Trend Analysis ➞ | |
 | RCEL AVITA Medical Inc |
| Sector: Health Care | |
| SubSector: Medical Devices | |
| MarketCap: 105.82 Millions | |
| Recent Price: 4.34 Smart Investing & Trading Score: 20 | |
| Day Percent Change: 1.28% Day Change: 0.06 | |
| Week Change: -18.1% Year-to-date Change: -62.9% | |
| RCEL Links: Profile News Message Board | |
| Charts:- Daily , Weekly | |
| Add RCEL to Watchlist: View: Get Complete RCEL Trend Analysis ➞ | |
 | NVAX Novavax, Inc |
| Sector: Health Care | |
| SubSector: Biotechnology | |
| MarketCap: 1283.13 Millions | |
| Recent Price: 7.47 Smart Investing & Trading Score: 60 | |
| Day Percent Change: -12.7% Day Change: -1.11 | |
| Week Change: -19.09% Year-to-date Change: -5.1% | |
| NVAX Links: Profile News Message Board | |
| Charts:- Daily , Weekly | |
| Add NVAX to Watchlist: View: Get Complete NVAX Trend Analysis ➞ | |
 | SY So-Young International Inc ADR |
| Sector: Health Care | |
| SubSector: Health Information Services | |
| MarketCap: 371.46 Millions | |
| Recent Price: 3.84 Smart Investing & Trading Score: 40 | |
| Day Percent Change: -4.19% Day Change: -0.17 | |
| Week Change: -19.63% Year-to-date Change: 384.7% | |
| SY Links: Profile News Message Board | |
| Charts:- Daily , Weekly | |
| Add SY to Watchlist: View: Get Complete SY Trend Analysis ➞ | |
 | CTSO Cytosorbents Corp |
| Sector: Health Care | |
| SubSector: Medical Devices | |
| MarketCap: 60.6 Millions | |
| Recent Price: 0.94 Smart Investing & Trading Score: 50 | |
| Day Percent Change: -5.58% Day Change: -0.05 | |
| Week Change: -25.96% Year-to-date Change: -7.3% | |
| CTSO Links: Profile News Message Board | |
| Charts:- Daily , Weekly | |
| Add CTSO to Watchlist: View: Get Complete CTSO Trend Analysis ➞ | |
 | VKTX Viking Therapeutics Inc |
| Sector: Health Care | |
| SubSector: Biotechnology | |
| MarketCap: 3033.77 Millions | |
| Recent Price: 27.05 Smart Investing & Trading Score: 50 | |
| Day Percent Change: -0.12% Day Change: -0.03 | |
| Week Change: -36.23% Year-to-date Change: -36.2% | |
| VKTX Links: Profile News Message Board | |
| Charts:- Daily , Weekly | |
| Add VKTX to Watchlist: View: Get Complete VKTX Trend Analysis ➞ | |
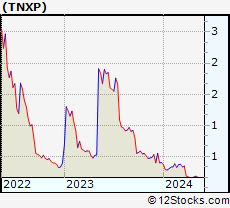 | TNXP Tonix Pharmaceuticals Holding Corp |
| Sector: Health Care | |
| SubSector: Biotechnology | |
| MarketCap: 232.65 Millions | |
| Recent Price: 29.63 Smart Investing & Trading Score: 10 | |
| Day Percent Change: -0.55% Day Change: -0.2 | |
| Week Change: -39.83% Year-to-date Change: 8.7% | |
| TNXP Links: Profile News Message Board | |
| Charts:- Daily , Weekly | |
| Add TNXP to Watchlist: View: Get Complete TNXP Trend Analysis ➞ | |
| For tabular summary view of above stock list: Summary View ➞ 0 - 25 , 25 - 50 , 50 - 75 , 75 - 100 , 100 - 125 , 125 - 150 , 150 - 175 , 175 - 200 , 200 - 225 , 225 - 250 , 250 - 275 , 275 - 300 , 300 - 325 , 325 - 350 , 350 - 375 , 375 - 400 , 400 - 425 , 425 - 450 , 450 - 475 , 475 - 500 , 500 - 525 , 525 - 550 , 550 - 575 , 575 - 600 , 600 - 625 | ||
| Click To Change The Sort Order: By Market Cap or Company Size Performance: Year-to-date, Week and Day | |
| Select Chart Type: | ||
|
Best Stocks Today 12Stocks.com |
© 2025 12Stocks.com Terms & Conditions Privacy Contact Us
All Information Provided Only For Education And Not To Be Used For Investing or Trading. See Terms & Conditions


One More Thing ... Get Best Stocks Delivered Daily!
Never Ever Miss A Move With Our Top Ten Stocks Lists
Find Best Stocks In Any Market - Bull or Bear Market
Take A Peek At Our Top Ten Stocks Lists: Daily, Weekly, Year-to-Date & Top Trends
Find Best Stocks In Any Market - Bull or Bear Market
Take A Peek At Our Top Ten Stocks Lists: Daily, Weekly, Year-to-Date & Top Trends
Healthcare Stocks With Best Up Trends [0-bearish to 100-bullish]: Gossamer Bio[100], Fortress Biotech[100], Design [100], Teva- [100], Compass Pathways[100], Edgewise [100], OptimizeRx Corp[100], Avadel [100], Nektar [100], Esperion [100], RAPT [100]
Best Healthcare Stocks Year-to-Date:
Regencell Bioscience[9561.54%], I-Mab ADR[454.12%], So-Young [384.74%], Celcuity [284.87%], Nanobiotix ADR[239.28%], OptimizeRx Corp[232.1%], ATAI Life[230.08%], Precigen [225%], Microbot [217.86%], DBV Technologies[208.74%], Galectin [200.78%] Best Healthcare Stocks This Week:
Precigen [96.76%], Equillium [59.17%], Immuneering Corp[52.3%], GoodRx [26.84%], Zentalis [26.35%], Rocket [23.1%], Tenaya [22.51%], Nanobiotix ADR[18.75%], Pro-Dex .[17.91%], Inovio [17.9%], Brainsway [16.84%] Best Healthcare Stocks Daily:
Equillium [36.84%], Immuneering Corp[34.99%], Tyra Biosciences[14.26%], Nanobiotix ADR[14.15%], Zentalis [14.02%], Zura Bio[13.71%], Precigen [13.4%], Achieve Life[12.02%], Gossamer Bio[11.28%], Quantum-Si [11%], ATAI Life[10.58%]