
 Login Sign Up


| |||||
 |  | ||||

| 12Stocks.com Market Intelligence |
Best Healthcare Stocks
 | "Discover best trending healthcare stocks with 12Stocks.com." |
| - Subu Vdaygiri, Founder, 12Stocks.com |
| In a hurry? Healthcare Stocks Lists: Performance Trends Table, Stock Charts
Sort Healthcare stocks: Daily, Weekly, Year-to-Date, Market Cap & Trends. Filter Healthcare stocks list by size:All Healthcare Large Mid-Range Small |
| 12Stocks.com Healthcare Stocks Performances & Trends Daily | |||||||||
|
|  The overall Smart Investing & Trading Score is 90 (0-bearish to 100-bullish) which puts Healthcare sector in short term bullish trend. The Smart Investing & Trading Score from previous trading session is 70 and an improvement of trend continues.
| ||||||||
Here are the Smart Investing & Trading Scores of the most requested Healthcare stocks at 12Stocks.com (click stock name for detailed review):
|


| 12Stocks.com: Investing in Healthcare sector with Stocks | |
|
The following table helps investors and traders sort through current performance and trends (as measured by Smart Investing & Trading Score) of various
stocks in the Healthcare sector. Quick View: Move mouse or cursor over stock symbol (ticker) to view short-term Technical chart and over stock name to view long term chart. Click on  to add stock symbol to your watchlist and to add stock symbol to your watchlist and  to view watchlist. Click on any ticker or stock name for detailed market intelligence report for that stock. to view watchlist. Click on any ticker or stock name for detailed market intelligence report for that stock. |
12Stocks.com Performance of Stocks in Healthcare Sector
| Ticker | Stock Name | Watchlist | Category | Recent Price | Smart Investing & Trading Score | Change % | Weekly Change% |
| PRCT | Procept BioRobotics |   | Medical Devices | 40.17 | 10 | -0.08% | -1.92% |
| IQV | IQVIA | | Diagnostics & Research | 187.47 | 60 | 1.84% | -1.93% |
| OCGN | Ocugen | | Biotechnology | 1.02 | 30 | 0.00% | -1.94% |
| ISRG | Intuitive Surgical | | Instruments | 466.86 | 40 | 2.71% | -1.95% |
| TMO | Thermo Fisher | | Diagnostics & Research | 490.2 | 90 | 0.15% | -1.96% |
| ATRA | Atara Bio | | Biotechnology | 12.05 | 70 | -2.30% | -1.96% |
| UFPT | UFP Technologies | | Medical Devices | 210.16 | 10 | 0.08% | -1.98% |
| VCYT | Veracyte | | Diagnostics & Research | 30.34 | 100 | -0.20% | -2.03% |
| FHTX | Foghorn | | Biotechnology | 5.06 | 100 | -4.18% | -2.04% |
| CNC | Centene Corp | | Healthcare Plans | 28.8 | 30 | 0.52% | -2.07% |
| STXS | Stereotaxis | | Instruments | 2.88 | 90 | -0.35% | -2.07% |
| DVA | DaVita | | Medical Care Facilities | 137.42 | 70 | 1.37% | -2.09% |
| CYH | Community Health | | Medical Care Facilities | 2.76 | 90 | -1.48% | -2.20% |
| HRTX | Heron | | Biotechnology | 1.35 | 10 | 1.54% | -2.22% |
| AVAH | Aveanna | | Medical Care Facilities | 8.00 | 80 | -2.22% | -2.22% |
| DYN | Dyne | | Biotechnology | 13.49 | 100 | 2.09% | -2.24% |
| ADPT | Adaptive Biotechnologies | | Biotechnology | 13.18 | 30 | 2.72% | -2.24% |
| ZTS | Zoetis | | Drug Manufacturers - Specialty & Generic | 153.06 | 50 | -0.09% | -2.27% |
| INNV | InnovAge Holding | | Medical Care Facilities | 3.83 | 50 | -1.15% | -2.27% |
| LIVN | LivaNova | | Medical Devices | 56.37 | 90 | -0.99% | -2.35% |
| BIO | Bio-Rad | | Medical Devices | 296.61 | 80 | 2.48% | -2.37% |
| IMVT | Immunovant | | Biotechnology | 14.69 | 100 | 0.13% | -2.37% |
| TSHA | Taysha Gene | | Biotechnology | 2.92 | 100 | 0.00% | -2.38% |
| ORIC | ORIC | | Biotechnology | 10.23 | 100 | 1.89% | -2.42% |
| HOLX | Hologic | | Instruments | 66.58 | 70 | 0.29% | -2.46% |
| For chart view version of above stock list: Chart View ➞ 0 - 25 , 25 - 50 , 50 - 75 , 75 - 100 , 100 - 125 , 125 - 150 , 150 - 175 , 175 - 200 , 200 - 225 , 225 - 250 , 250 - 275 , 275 - 300 , 300 - 325 , 325 - 350 , 350 - 375 , 375 - 400 , 400 - 425 , 425 - 450 , 450 - 475 , 475 - 500 , 500 - 525 , 525 - 550 , 550 - 575 , 575 - 600 , 600 - 625 | ||
 | Click To Change The Sort Order: By Market Cap or Company Size Performance: Year-to-date, Week and Day |  |
|
Get the most comprehensive stock market coverage daily at 12Stocks.com ➞ Best Stocks Today ➞ Best Stocks Weekly ➞ Best Stocks Year-to-Date ➞ Best Stocks Trends ➞  Best Stocks Today 12Stocks.com Best Nasdaq Stocks ➞ Best S&P 500 Stocks ➞ Best Tech Stocks ➞ Best Biotech Stocks ➞ |
| Detailed Overview of Healthcare Stocks |
| Healthcare Technical Overview, Leaders & Laggards, Top Healthcare ETF Funds & Detailed Healthcare Stocks List, Charts, Trends & More |
| Healthcare Sector: Technical Analysis, Trends & YTD Performance | |
| Healthcare sector is composed of stocks
from pharmaceutical, biotech, diagnostics labs, insurance providers
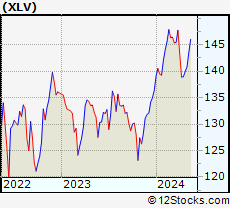
and healthcare services. Healthcare sector, as represented by XLV, an exchange-traded fund [ETF] that holds basket of Healthcare stocks (e.g, Merck, Amgen) is down by -5.29% and is currently underperforming the overall market by -13.01% year-to-date. Below is a quick view of Technical charts and trends: |
|
 XLV Weekly Chart |
|
| Long Term Trend: Very Good | |
| Medium Term Trend: Very Good | |
 XLV Daily Chart |
|
| Short Term Trend: Good | |
| Overall Trend Score: 90 | |
| YTD Performance: -5.29% | |
| **Trend Scores & Views Are Only For Educational Purposes And Not For Investing | |
| 12Stocks.com: Top Performing Healthcare Sector Stocks | |||||||||||||||||||||||||||||||||||||||||||||||
 The top performing Healthcare sector stocks year to date are
Now, more recently, over last week, the top performing Healthcare sector stocks on the move are


|
|||||||||||||||||||||||||||||||||||||||||||||||
| 12Stocks.com: Investing in Healthcare Sector using Exchange Traded Funds | |
|
The following table shows list of key exchange traded funds (ETF) that
help investors track Healthcare Index. For detailed view, check out our ETF Funds section of our website. Quick View: Move mouse or cursor over ETF symbol (ticker) to view short-term Technical chart and over ETF name to view long term chart. Click on ticker or stock name for detailed view. Click on to add stock symbol to your watchlist and to view watchlist. |
12Stocks.com List of ETFs that track Healthcare Index
| Ticker | ETF Name | Watchlist | Recent Price | Smart Investing & Trading Score | Change % | Week % | Year-to-date % |
| 12Stocks.com: Charts, Trends, Fundamental Data and Performances of Healthcare Stocks | |
|
We now take in-depth look at all Healthcare stocks including charts, multi-period performances and overall trends (as measured by Smart Investing & Trading Score). One can sort Healthcare stocks (click link to choose) by Daily, Weekly and by Year-to-Date performances. Also, one can sort by size of the company or by market capitalization. |
| Select Your Default Chart Type: | |||||
| |||||
| Click on stock symbol or name for detailed view. Click on to add stock symbol to your watchlist and to view watchlist. Quick View: Move mouse or cursor over "Daily" to quickly view daily Technical stock chart and over "Weekly" to view weekly Technical stock chart. | |||||

 | PRCT Procept BioRobotics Corp |
| Sector: Health Care | |
| SubSector: Medical Devices | |
| MarketCap: 2263.27 Millions | |
| Recent Price: 40.17 Smart Investing & Trading Score: 10 | |
| Day Percent Change: -0.08% Day Change: -0.03 | |
| Week Change: -1.92% Year-to-date Change: -51.1% | |
| PRCT Links: Profile News Message Board | |
| Charts:- Daily , Weekly | |
| Add PRCT to Watchlist: View: Get Complete PRCT Trend Analysis ➞ | |
 | IQV IQVIA Holdings Inc |
| Sector: Health Care | |
| SubSector: Diagnostics & Research | |
| MarketCap: 31905.6 Millions | |
| Recent Price: 187.47 Smart Investing & Trading Score: 60 | |
| Day Percent Change: 1.84% Day Change: 3.39 | |
| Week Change: -1.93% Year-to-date Change: -6.9% | |
| IQV Links: Profile News Message Board | |
| Charts:- Daily , Weekly | |
| Add IQV to Watchlist: View: Get Complete IQV Trend Analysis ➞ | |
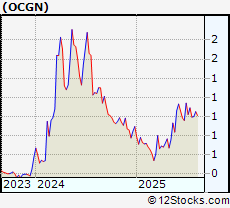 | OCGN Ocugen Inc |
| Sector: Health Care | |
| SubSector: Biotechnology | |
| MarketCap: 321.67 Millions | |
| Recent Price: 1.02 Smart Investing & Trading Score: 30 | |
| Day Percent Change: 0% Day Change: 0 | |
| Week Change: -1.94% Year-to-date Change: 25.5% | |
| OCGN Links: Profile News Message Board | |
| Charts:- Daily , Weekly | |
| Add OCGN to Watchlist: View: Get Complete OCGN Trend Analysis ➞ | |
 | ISRG Intuitive Surgical Inc |
| Sector: Health Care | |
| SubSector: Medical Instruments & Supplies | |
| MarketCap: 167358 Millions | |
| Recent Price: 466.86 Smart Investing & Trading Score: 40 | |
| Day Percent Change: 2.71% Day Change: 12.34 | |
| Week Change: -1.95% Year-to-date Change: -18.4% | |
| ISRG Links: Profile News Message Board | |
| Charts:- Daily , Weekly | |
| Add ISRG to Watchlist: View: Get Complete ISRG Trend Analysis ➞ | |
 | TMO Thermo Fisher Scientific Inc |
| Sector: Health Care | |
| SubSector: Diagnostics & Research | |
| MarketCap: 186012 Millions | |
| Recent Price: 490.2 Smart Investing & Trading Score: 90 | |
| Day Percent Change: 0.15% Day Change: 0.71 | |
| Week Change: -1.96% Year-to-date Change: -17.8% | |
| TMO Links: Profile News Message Board | |
| Charts:- Daily , Weekly | |
| Add TMO to Watchlist: View: Get Complete TMO Trend Analysis ➞ | |
 | ATRA Atara Biotherapeutics Inc |
| Sector: Health Care | |
| SubSector: Biotechnology | |
| MarketCap: 90.67 Millions | |
| Recent Price: 12.05 Smart Investing & Trading Score: 70 | |
| Day Percent Change: -2.3% Day Change: -0.27 | |
| Week Change: -1.96% Year-to-date Change: -13.7% | |
| ATRA Links: Profile News Message Board | |
| Charts:- Daily , Weekly | |
| Add ATRA to Watchlist: View: Get Complete ATRA Trend Analysis ➞ | |
 | UFPT UFP Technologies Inc |
| Sector: Health Care | |
| SubSector: Medical Devices | |
| MarketCap: 1598.44 Millions | |
| Recent Price: 210.16 Smart Investing & Trading Score: 10 | |
| Day Percent Change: 0.08% Day Change: 0.17 | |
| Week Change: -1.98% Year-to-date Change: -10.2% | |
| UFPT Links: Profile News Message Board | |
| Charts:- Daily , Weekly | |
| Add UFPT to Watchlist: View: Get Complete UFPT Trend Analysis ➞ | |
 | VCYT Veracyte Inc |
| Sector: Health Care | |
| SubSector: Diagnostics & Research | |
| MarketCap: 2551.32 Millions | |
| Recent Price: 30.34 Smart Investing & Trading Score: 100 | |
| Day Percent Change: -0.2% Day Change: -0.06 | |
| Week Change: -2.03% Year-to-date Change: -25.7% | |
| VCYT Links: Profile News Message Board | |
| Charts:- Daily , Weekly | |
| Add VCYT to Watchlist: View: Get Complete VCYT Trend Analysis ➞ | |
 | FHTX Foghorn Therapeutics Inc |
| Sector: Health Care | |
| SubSector: Biotechnology | |
| MarketCap: 326.18 Millions | |
| Recent Price: 5.06 Smart Investing & Trading Score: 100 | |
| Day Percent Change: -4.18% Day Change: -0.22 | |
| Week Change: -2.04% Year-to-date Change: 6.8% | |
| FHTX Links: Profile News Message Board | |
| Charts:- Daily , Weekly | |
| Add FHTX to Watchlist: View: Get Complete FHTX Trend Analysis ➞ | |
 | CNC Centene Corp |
| Sector: Health Care | |
| SubSector: Healthcare Plans | |
| MarketCap: 14233 Millions | |
| Recent Price: 28.8 Smart Investing & Trading Score: 30 | |
| Day Percent Change: 0.52% Day Change: 0.15 | |
| Week Change: -2.07% Year-to-date Change: -55.0% | |
| CNC Links: Profile News Message Board | |
| Charts:- Daily , Weekly | |
| Add CNC to Watchlist: View: Get Complete CNC Trend Analysis ➞ | |
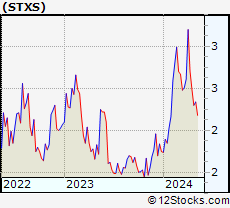 | STXS Stereotaxis Inc |
| Sector: Health Care | |
| SubSector: Medical Instruments & Supplies | |
| MarketCap: 264.11 Millions | |
| Recent Price: 2.88 Smart Investing & Trading Score: 90 | |
| Day Percent Change: -0.35% Day Change: -0.01 | |
| Week Change: -2.07% Year-to-date Change: 24.6% | |
| STXS Links: Profile News Message Board | |
| Charts:- Daily , Weekly | |
| Add STXS to Watchlist: View: Get Complete STXS Trend Analysis ➞ | |
 | DVA DaVita Inc |
| Sector: Health Care | |
| SubSector: Medical Care Facilities | |
| MarketCap: 9857.7 Millions | |
| Recent Price: 137.42 Smart Investing & Trading Score: 70 | |
| Day Percent Change: 1.37% Day Change: 1.86 | |
| Week Change: -2.09% Year-to-date Change: -22.0% | |
| DVA Links: Profile News Message Board | |
| Charts:- Daily , Weekly | |
| Add DVA to Watchlist: View: Get Complete DVA Trend Analysis ➞ | |
 | CYH Community Health Systems, Inc |
| Sector: Health Care | |
| SubSector: Medical Care Facilities | |
| MarketCap: 409.15 Millions | |
| Recent Price: 2.76 Smart Investing & Trading Score: 90 | |
| Day Percent Change: -1.48% Day Change: -0.04 | |
| Week Change: -2.2% Year-to-date Change: -10.7% | |
| CYH Links: Profile News Message Board | |
| Charts:- Daily , Weekly | |
| Add CYH to Watchlist: View: Get Complete CYH Trend Analysis ➞ | |
 | HRTX Heron Therapeutics Inc |
| Sector: Health Care | |
| SubSector: Biotechnology | |
| MarketCap: 200.81 Millions | |
| Recent Price: 1.35 Smart Investing & Trading Score: 10 | |
| Day Percent Change: 1.54% Day Change: 0.02 | |
| Week Change: -2.22% Year-to-date Change: -13.7% | |
| HRTX Links: Profile News Message Board | |
| Charts:- Daily , Weekly | |
| Add HRTX to Watchlist: View: Get Complete HRTX Trend Analysis ➞ | |
 | AVAH Aveanna Healthcare Holdings Inc |
| Sector: Health Care | |
| SubSector: Medical Care Facilities | |
| MarketCap: 1717.13 Millions | |
| Recent Price: 8.00 Smart Investing & Trading Score: 80 | |
| Day Percent Change: -2.22% Day Change: -0.16 | |
| Week Change: -2.22% Year-to-date Change: 54.1% | |
| AVAH Links: Profile News Message Board | |
| Charts:- Daily , Weekly | |
| Add AVAH to Watchlist: View: Get Complete AVAH Trend Analysis ➞ | |
 | DYN Dyne Therapeutics Inc |
| Sector: Health Care | |
| SubSector: Biotechnology | |
| MarketCap: 2022.99 Millions | |
| Recent Price: 13.49 Smart Investing & Trading Score: 100 | |
| Day Percent Change: 2.09% Day Change: 0.25 | |
| Week Change: -2.24% Year-to-date Change: -48.1% | |
| DYN Links: Profile News Message Board | |
| Charts:- Daily , Weekly | |
| Add DYN to Watchlist: View: Get Complete DYN Trend Analysis ➞ | |
 | ADPT Adaptive Biotechnologies Corp |
| Sector: Health Care | |
| SubSector: Biotechnology | |
| MarketCap: 1956.72 Millions | |
| Recent Price: 13.18 Smart Investing & Trading Score: 30 | |
| Day Percent Change: 2.72% Day Change: 0.34 | |
| Week Change: -2.24% Year-to-date Change: 110.7% | |
| ADPT Links: Profile News Message Board | |
| Charts:- Daily , Weekly | |
| Add ADPT to Watchlist: View: Get Complete ADPT Trend Analysis ➞ | |
 | ZTS Zoetis Inc |
| Sector: Health Care | |
| SubSector: Drug Manufacturers - Specialty & Generic | |
| MarketCap: 67948.9 Millions | |
| Recent Price: 153.06 Smart Investing & Trading Score: 50 | |
| Day Percent Change: -0.09% Day Change: -0.14 | |
| Week Change: -2.27% Year-to-date Change: -9.8% | |
| ZTS Links: Profile News Message Board | |
| Charts:- Daily , Weekly | |
| Add ZTS to Watchlist: View: Get Complete ZTS Trend Analysis ➞ | |
 | INNV InnovAge Holding Corp |
| Sector: Health Care | |
| SubSector: Medical Care Facilities | |
| MarketCap: 511.7 Millions | |
| Recent Price: 3.83 Smart Investing & Trading Score: 50 | |
| Day Percent Change: -1.15% Day Change: -0.04 | |
| Week Change: -2.27% Year-to-date Change: -12.2% | |
| INNV Links: Profile News Message Board | |
| Charts:- Daily , Weekly | |
| Add INNV to Watchlist: View: Get Complete INNV Trend Analysis ➞ | |
 | LIVN LivaNova PLC |
| Sector: Health Care | |
| SubSector: Medical Devices | |
| MarketCap: 3165.22 Millions | |
| Recent Price: 56.37 Smart Investing & Trading Score: 90 | |
| Day Percent Change: -0.99% Day Change: -0.53 | |
| Week Change: -2.35% Year-to-date Change: 14.1% | |
| LIVN Links: Profile News Message Board | |
| Charts:- Daily , Weekly | |
| Add LIVN to Watchlist: View: Get Complete LIVN Trend Analysis ➞ | |
 | BIO Bio-Rad Laboratories Inc |
| Sector: Health Care | |
| SubSector: Medical Devices | |
| MarketCap: 7998.24 Millions | |
| Recent Price: 296.61 Smart Investing & Trading Score: 80 | |
| Day Percent Change: 2.48% Day Change: 7.18 | |
| Week Change: -2.37% Year-to-date Change: -17.8% | |
| BIO Links: Profile News Message Board | |
| Charts:- Daily , Weekly | |
| Add BIO to Watchlist: View: Get Complete BIO Trend Analysis ➞ | |
 | IMVT Immunovant Inc |
| Sector: Health Care | |
| SubSector: Biotechnology | |
| MarketCap: 2987.79 Millions | |
| Recent Price: 14.69 Smart Investing & Trading Score: 100 | |
| Day Percent Change: 0.13% Day Change: 0.02 | |
| Week Change: -2.37% Year-to-date Change: -40.1% | |
| IMVT Links: Profile News Message Board | |
| Charts:- Daily , Weekly | |
| Add IMVT to Watchlist: View: Get Complete IMVT Trend Analysis ➞ | |
 | TSHA Taysha Gene Therapies Inc |
| Sector: Health Care | |
| SubSector: Biotechnology | |
| MarketCap: 916.59 Millions | |
| Recent Price: 2.92 Smart Investing & Trading Score: 100 | |
| Day Percent Change: 0% Day Change: 0 | |
| Week Change: -2.38% Year-to-date Change: 65.9% | |
| TSHA Links: Profile News Message Board | |
| Charts:- Daily , Weekly | |
| Add TSHA to Watchlist: View: Get Complete TSHA Trend Analysis ➞ | |
 | ORIC ORIC Pharmaceuticals Inc |
| Sector: Health Care | |
| SubSector: Biotechnology | |
| MarketCap: 1056.7 Millions | |
| Recent Price: 10.23 Smart Investing & Trading Score: 100 | |
| Day Percent Change: 1.89% Day Change: 0.18 | |
| Week Change: -2.42% Year-to-date Change: 20.1% | |
| ORIC Links: Profile News Message Board | |
| Charts:- Daily , Weekly | |
| Add ORIC to Watchlist: View: Get Complete ORIC Trend Analysis ➞ | |
 | HOLX Hologic, Inc |
| Sector: Health Care | |
| SubSector: Medical Instruments & Supplies | |
| MarketCap: 14848.7 Millions | |
| Recent Price: 66.58 Smart Investing & Trading Score: 70 | |
| Day Percent Change: 0.29% Day Change: 0.19 | |
| Week Change: -2.46% Year-to-date Change: -7.7% | |
| HOLX Links: Profile News Message Board | |
| Charts:- Daily , Weekly | |
| Add HOLX to Watchlist: View: Get Complete HOLX Trend Analysis ➞ | |
| For tabular summary view of above stock list: Summary View ➞ 0 - 25 , 25 - 50 , 50 - 75 , 75 - 100 , 100 - 125 , 125 - 150 , 150 - 175 , 175 - 200 , 200 - 225 , 225 - 250 , 250 - 275 , 275 - 300 , 300 - 325 , 325 - 350 , 350 - 375 , 375 - 400 , 400 - 425 , 425 - 450 , 450 - 475 , 475 - 500 , 500 - 525 , 525 - 550 , 550 - 575 , 575 - 600 , 600 - 625 | ||
| Click To Change The Sort Order: By Market Cap or Company Size Performance: Year-to-date, Week and Day | |
| Select Chart Type: | ||
|
Best Stocks Today 12Stocks.com |
© 2025 12Stocks.com Terms & Conditions Privacy Contact Us
All Information Provided Only For Education And Not To Be Used For Investing or Trading. See Terms & Conditions


One More Thing ... Get Best Stocks Delivered Daily!
Never Ever Miss A Move With Our Top Ten Stocks Lists
Find Best Stocks In Any Market - Bull or Bear Market
Take A Peek At Our Top Ten Stocks Lists: Daily, Weekly, Year-to-Date & Top Trends
Find Best Stocks In Any Market - Bull or Bear Market
Take A Peek At Our Top Ten Stocks Lists: Daily, Weekly, Year-to-Date & Top Trends
Healthcare Stocks With Best Up Trends [0-bearish to 100-bullish]: Gossamer Bio[100], Fortress Biotech[100], Design [100], Teva- [100], Compass Pathways[100], Edgewise [100], OptimizeRx Corp[100], Avadel [100], Nektar [100], Esperion [100], RAPT [100]
Best Healthcare Stocks Year-to-Date:
Regencell Bioscience[9561.54%], I-Mab ADR[454.12%], So-Young [384.74%], Celcuity [284.87%], Nanobiotix ADR[239.28%], OptimizeRx Corp[232.1%], ATAI Life[230.08%], Precigen [225%], Microbot [217.86%], DBV Technologies[208.74%], Galectin [200.78%] Best Healthcare Stocks This Week:
Precigen [96.76%], Equillium [59.17%], Immuneering Corp[52.3%], GoodRx [26.84%], Zentalis [26.35%], Rocket [23.1%], Tenaya [22.51%], Nanobiotix ADR[18.75%], Pro-Dex .[17.91%], Inovio [17.9%], Brainsway [16.84%] Best Healthcare Stocks Daily:
Equillium [36.84%], Immuneering Corp[34.99%], Tyra Biosciences[14.26%], Nanobiotix ADR[14.15%], Zentalis [14.02%], Zura Bio[13.71%], Precigen [13.4%], Achieve Life[12.02%], Gossamer Bio[11.28%], Quantum-Si [11%], ATAI Life[10.58%]