
 Login Sign Up


| |||||
 |  | ||||

| 12Stocks.com Market Intelligence |
Best Financial Stocks
| In a hurry? Financial Stocks Lists: Performance Trends Table, Stock Charts
Sort Financial stocks: Daily, Weekly, Year-to-Date, Market Cap & Trends. Filter Financial stocks list by size:All Financial Large Mid-Range Small & MicroCap |
| 12Stocks.com Financial Stocks Performances & Trends Daily | |||||||||
|
|  The overall Smart Investing & Trading Score is 33 (0-bearish to 100-bullish) which puts Financial sector in short term bearish to neutral trend. The Smart Investing & Trading Score from previous trading session is 26 and an improvement of trend continues.
| ||||||||
Here are the Smart Investing & Trading Scores of the most requested Financial stocks at 12Stocks.com (click stock name for detailed review):
|


| 12Stocks.com: Investing in Financial sector with Stocks | |
|
The following table helps investors and traders sort through current performance and trends (as measured by Smart Investing & Trading Score) of various
stocks in the Financial sector. Quick View: Move mouse or cursor over stock symbol (ticker) to view short-term Technical chart and over stock name to view long term chart. Click on  to add stock symbol to your watchlist and to add stock symbol to your watchlist and  to view watchlist. Click on any ticker or stock name for detailed market intelligence report for that stock. to view watchlist. Click on any ticker or stock name for detailed market intelligence report for that stock. |
12Stocks.com Performance of Stocks in Financial Sector
| Ticker | Stock Name | Watchlist | Category | Recent Price | Trend Score | Change % | YTD Change% |
| FFBC | First |   | Regional Banks | 23.92 | 17 | 0.13% | -10.23% |
| UNM | Unum | | Insurance | 70.01 | 17 | 0.09% | -3.09% |
| MET | MetLife | | Life Insurance | 74.89 | 17 | 0.08% | -7.95% |
| CFR | Cullen/Frost Bankers | | Regional - Southwest Banks | 125.60 | 17 | 0.06% | -5.79% |
| EQH | Equitable | | Insurance | 50.93 | 17 | -0.12% | 8.48% |
| VEL | Velocity | | Mortgage Finance | 16.61 | 17 | -0.18% | -15.08% |
| SLM | SLM | | Credit Services | 31.80 | 17 | -0.19% | 15.82% |
| AMP | Ameriprise | | Asset Mgmt | 505.03 | 17 | -0.25% | -4.88% |
| PYPL | PayPal | | Credit Services | 67.83 | 17 | -0.26% | -20.53% |
| IBTA | iShares iBonds | | Exchange Traded Fund | 35.38 | 17 | -1.64% | -45.64% |
| RNR | RenaissanceRe | | Insurance | 240.30 | 15 | 0.13% | -3.26% |
| ALX | Alexander s | | REIT - Retail | 226.51 | 13 | 6.14% | 15.76% |
| MKL | Markel | | Insurance | 1938.58 | 13 | -0.40% | 12.30% |
| DLR | Digital Realty | | REIT - Office | 172.17 | 13 | -0.43% | -2.09% |
| FCNCA | First Citizens | | Regional Banks | 1862.62 | 13 | -1.13% | -11.77% |
| CPT | Camden Property | | REIT | 107.67 | 10 | 1.80% | -6.41% |
| UDR | UDR | | REIT | 38.55 | 10 | 1.53% | -9.29% |
| TIPT | Tiptree | | Life Insurance | 20.41 | 10 | 0.94% | -1.90% |
| KRNY | Kearny | | S&L | 5.92 | 10 | 0.51% | -15.15% |
| INBK | First Internet | | Regional Banks | 21.95 | 10 | 0.46% | -38.87% |
| IBCP | Independent Bank | | Regional Banks | 30.25 | 10 | 0.46% | -12.51% |
| CUZ | Cousins Properties | | REIT - | 26.70 | 10 | 0.34% | -10.98% |
| HIW | Highwoods Properties | | REIT - Office | 28.56 | 10 | 0.32% | -4.98% |
| PGC | Peapack-Gladstone | | Regional Banks | 25.01 | 10 | 0.24% | -21.85% |
| CASH | Meta | | S&L | 74.58 | 10 | 0.08% | 1.43% |
| For chart view version of above stock list: Chart View ➞ 0 - 25 , 25 - 50 , 50 - 75 , 75 - 100 , 100 - 125 , 125 - 150 , 150 - 175 , 175 - 200 , 200 - 225 , 225 - 250 , 250 - 275 , 275 - 300 , 300 - 325 , 325 - 350 , 350 - 375 , 375 - 400 , 400 - 425 , 425 - 450 , 450 - 475 , 475 - 500 , 500 - 525 , 525 - 550 , 550 - 575 | ||
 | Click To Change The Sort Order: By Market Cap or Company Size Performance: Year-to-date, Week and Day |  |
|
Get the most comprehensive stock market coverage daily at 12Stocks.com ➞ Best Stocks Today ➞ Best Stocks Weekly ➞ Best Stocks Year-to-Date ➞ Best Stocks Trends ➞  Best Stocks Today 12Stocks.com Best Nasdaq Stocks ➞ Best S&P 500 Stocks ➞ Best Tech Stocks ➞ Best Biotech Stocks ➞ |
| Detailed Overview of Financial Stocks |
| Financial Technical Overview, Leaders & Laggards, Top Financial ETF Funds & Detailed Financial Stocks List, Charts, Trends & More |
| Financial Sector: Technical Analysis, Trends & YTD Performance | |
| Financial sector is composed of stocks
from banks, brokers, insurance, REITs
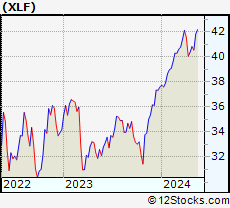
and services subsectors. Financial sector, as represented by XLF, an exchange-traded fund [ETF] that holds basket of Financial stocks (e.g, Bank of America, Goldman Sachs) is up by 7.36% and is currently outperforming the overall market by 0.31% year-to-date. Below is a quick view of Technical charts and trends: |
|
 XLF Weekly Chart |
|
| Long Term Trend: Good | |
| Medium Term Trend: Not Good | |
 XLF Daily Chart |
|
| Short Term Trend: Not Good | |
| Overall Trend Score: 33 | |
| YTD Performance: 7.36% | |
| **Trend Scores & Views Are Only For Educational Purposes And Not For Investing | |
| 12Stocks.com: Top Performing Financial Sector Stocks | ||||||||||||||||||||||||||||||||||||||||||||||||
 The top performing Financial sector stocks year to date are
Now, more recently, over last week, the top performing Financial sector stocks on the move are


|
||||||||||||||||||||||||||||||||||||||||||||||||
| 12Stocks.com: Investing in Financial Sector using Exchange Traded Funds | |
|
The following table shows list of key exchange traded funds (ETF) that
help investors track Financial Index. For detailed view, check out our ETF Funds section of our website. Quick View: Move mouse or cursor over ETF symbol (ticker) to view short-term Technical chart and over ETF name to view long term chart. Click on ticker or stock name for detailed view. Click on to add stock symbol to your watchlist and to view watchlist. |
12Stocks.com List of ETFs that track Financial Index
| Ticker | ETF Name | Watchlist | Recent Price | Smart Investing & Trading Score | Change % | Week % | Year-to-date % |
| XLF | Financial | | 51.70 | 33 | -0.4 | 0.58 | 7.36% |
| IAI | Broker-Dealers & Secs | | 173.45 | 53 | -0.87 | 1.45 | 20.77% |
| KBE | Bank | | 56.27 | 51 | 0.52 | 1.83 | 2.16% |
| FAS | Financial Bull 3X | | 159.77 | 33 | -1.27 | 1.61 | 6.12% |
| FAZ | Financial Bear 3X | | 4.60 | 62 | 1.32 | -1.5 | -26.44% |
| UYG | Financials | | 92.14 | 26 | -0.79 | 0.92 | 8.14% |
| KIE | Insurance | | 56.82 | 35 | 0.71 | 1.99 | 1.03% |
| 12Stocks.com: Charts, Trends, Fundamental Data and Performances of Financial Stocks | |
|
We now take in-depth look at all Financial stocks including charts, multi-period performances and overall trends (as measured by Smart Investing & Trading Score). One can sort Financial stocks (click link to choose) by Daily, Weekly and by Year-to-Date performances. Also, one can sort by size of the company or by market capitalization. |
| Select Your Default Chart Type: | |||||
| |||||
| Click on stock symbol or name for detailed view. Click on to add stock symbol to your watchlist and to view watchlist. Quick View: Move mouse or cursor over "Daily" to quickly view daily Technical stock chart and over "Weekly" to view weekly Technical stock chart. | |||||

 | FFBC First Financial Bancorp. |
| Sector: Financials | |
| SubSector: Regional - Midwest Banks | |
| MarketCap: 1363.7 Millions | |
| Recent Price: 23.92 Smart Investing & Trading Score: 17 | |
| Day Percent Change: 0.13% Day Change: 0.03 | |
| Week Change: 1.18% Year-to-date Change: -10.2% | |
| FFBC Links: Profile News Message Board | |
| Charts:- Daily , Weekly | |
| Add FFBC to Watchlist: View: Get Complete FFBC Trend Analysis ➞ | |
 | UNM Unum Group |
| Sector: Financials | |
| SubSector: Accident & Health Insurance | |
| MarketCap: 2760.9 Millions | |
| Recent Price: 70.01 Smart Investing & Trading Score: 17 | |
| Day Percent Change: 0.09% Day Change: 0.06 | |
| Week Change: 0.4% Year-to-date Change: -3.1% | |
| UNM Links: Profile News Message Board | |
| Charts:- Daily , Weekly | |
| Add UNM to Watchlist: View: Get Complete UNM Trend Analysis ➞ | |
 | MET MetLife, Inc. |
| Sector: Financials | |
| SubSector: Life Insurance | |
| MarketCap: 26272.9 Millions | |
| Recent Price: 74.89 Smart Investing & Trading Score: 17 | |
| Day Percent Change: 0.08% Day Change: 0.06 | |
| Week Change: 1.19% Year-to-date Change: -8.0% | |
| MET Links: Profile News Message Board | |
| Charts:- Daily , Weekly | |
| Add MET to Watchlist: View: Get Complete MET Trend Analysis ➞ | |
 | CFR Cullen/Frost Bankers, Inc. |
| Sector: Financials | |
| SubSector: Regional - Southwest Banks | |
| MarketCap: 3536.75 Millions | |
| Recent Price: 125.60 Smart Investing & Trading Score: 17 | |
| Day Percent Change: 0.06% Day Change: 0.07 | |
| Week Change: 1.13% Year-to-date Change: -5.8% | |
| CFR Links: Profile News Message Board | |
| Charts:- Daily , Weekly | |
| Add CFR to Watchlist: View: Get Complete CFR Trend Analysis ➞ | |
 | EQH Equitable Holdings, Inc. |
| Sector: Financials | |
| SubSector: Insurance Brokers | |
| MarketCap: 5520.07 Millions | |
| Recent Price: 50.93 Smart Investing & Trading Score: 17 | |
| Day Percent Change: -0.12% Day Change: -0.06 | |
| Week Change: 1.68% Year-to-date Change: 8.5% | |
| EQH Links: Profile News Message Board | |
| Charts:- Daily , Weekly | |
| Add EQH to Watchlist: View: Get Complete EQH Trend Analysis ➞ | |
 | VEL Velocity Financial, Inc. |
| Sector: Financials | |
| SubSector: Mortgage Finance | |
| MarketCap: 12157 Millions | |
| Recent Price: 16.61 Smart Investing & Trading Score: 17 | |
| Day Percent Change: -0.18% Day Change: -0.03 | |
| Week Change: 1.59% Year-to-date Change: -15.1% | |
| VEL Links: Profile News Message Board | |
| Charts:- Daily , Weekly | |
| Add VEL to Watchlist: View: Get Complete VEL Trend Analysis ➞ | |
 | SLM SLM Corporation |
| Sector: Financials | |
| SubSector: Credit Services | |
| MarketCap: 3099.78 Millions | |
| Recent Price: 31.80 Smart Investing & Trading Score: 17 | |
| Day Percent Change: -0.19% Day Change: -0.06 | |
| Week Change: 1.83% Year-to-date Change: 15.8% | |
| SLM Links: Profile News Message Board | |
| Charts:- Daily , Weekly | |
| Add SLM to Watchlist: View: Get Complete SLM Trend Analysis ➞ | |
 | AMP Ameriprise Financial, Inc. |
| Sector: Financials | |
| SubSector: Asset Management | |
| MarketCap: 13270.5 Millions | |
| Recent Price: 505.03 Smart Investing & Trading Score: 17 | |
| Day Percent Change: -0.25% Day Change: -1.25 | |
| Week Change: 0.7% Year-to-date Change: -4.9% | |
| AMP Links: Profile News Message Board | |
| Charts:- Daily , Weekly | |
| Add AMP to Watchlist: View: Get Complete AMP Trend Analysis ➞ | |
 | PYPL PayPal Holdings, Inc. |
| Sector: Financials | |
| SubSector: Credit Services | |
| MarketCap: 108949 Millions | |
| Recent Price: 67.83 Smart Investing & Trading Score: 17 | |
| Day Percent Change: -0.26% Day Change: -0.18 | |
| Week Change: 1.07% Year-to-date Change: -20.5% | |
| PYPL Links: Profile News Message Board | |
| Charts:- Daily , Weekly | |
| Add PYPL to Watchlist: View: Get Complete PYPL Trend Analysis ➞ | |
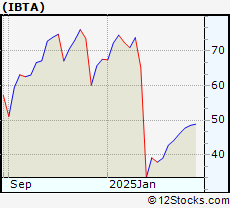 | IBTA iShares iBonds Dec 2021 Term Treasury ETF |
| Sector: Financials | |
| SubSector: Exchange Traded Fund | |
| MarketCap: 60157 Millions | |
| Recent Price: 35.38 Smart Investing & Trading Score: 17 | |
| Day Percent Change: -1.64% Day Change: -0.59 | |
| Week Change: 1.87% Year-to-date Change: -45.6% | |
| IBTA Links: Profile News Message Board | |
| Charts:- Daily , Weekly | |
| Add IBTA to Watchlist: View: Get Complete IBTA Trend Analysis ➞ | |
 | RNR RenaissanceRe Holdings Ltd. |
| Sector: Financials | |
| SubSector: Property & Casualty Insurance | |
| MarketCap: 6153.32 Millions | |
| Recent Price: 240.30 Smart Investing & Trading Score: 15 | |
| Day Percent Change: 0.13% Day Change: 0.32 | |
| Week Change: -0.63% Year-to-date Change: -3.3% | |
| RNR Links: Profile News Message Board | |
| Charts:- Daily , Weekly | |
| Add RNR to Watchlist: View: Get Complete RNR Trend Analysis ➞ | |
 | ALX Alexander s, Inc. |
| Sector: Financials | |
| SubSector: REIT - Retail | |
| MarketCap: 1251.54 Millions | |
| Recent Price: 226.51 Smart Investing & Trading Score: 13 | |
| Day Percent Change: 6.14% Day Change: 13.1 | |
| Week Change: -7.64% Year-to-date Change: 15.8% | |
| ALX Links: Profile News Message Board | |
| Charts:- Daily , Weekly | |
| Add ALX to Watchlist: View: Get Complete ALX Trend Analysis ➞ | |
 | MKL Markel Corporation |
| Sector: Financials | |
| SubSector: Property & Casualty Insurance | |
| MarketCap: 12405.9 Millions | |
| Recent Price: 1938.58 Smart Investing & Trading Score: 13 | |
| Day Percent Change: -0.4% Day Change: -7.84 | |
| Week Change: 0.45% Year-to-date Change: 12.3% | |
| MKL Links: Profile News Message Board | |
| Charts:- Daily , Weekly | |
| Add MKL to Watchlist: View: Get Complete MKL Trend Analysis ➞ | |
 | DLR Digital Realty Trust, Inc. |
| Sector: Financials | |
| SubSector: REIT - Office | |
| MarketCap: 27038.6 Millions | |
| Recent Price: 172.17 Smart Investing & Trading Score: 13 | |
| Day Percent Change: -0.43% Day Change: -0.74 | |
| Week Change: -0.02% Year-to-date Change: -2.1% | |
| DLR Links: Profile News Message Board | |
| Charts:- Daily , Weekly | |
| Add DLR to Watchlist: View: Get Complete DLR Trend Analysis ➞ | |
 | FCNCA First Citizens BancShares, Inc. |
| Sector: Financials | |
| SubSector: Regional - Mid-Atlantic Banks | |
| MarketCap: 3157.19 Millions | |
| Recent Price: 1862.62 Smart Investing & Trading Score: 13 | |
| Day Percent Change: -1.13% Day Change: -21.21 | |
| Week Change: -2.62% Year-to-date Change: -11.8% | |
| FCNCA Links: Profile News Message Board | |
| Charts:- Daily , Weekly | |
| Add FCNCA to Watchlist: View: Get Complete FCNCA Trend Analysis ➞ | |
 | CPT Camden Property Trust |
| Sector: Financials | |
| SubSector: REIT - Residential | |
| MarketCap: 7535.21 Millions | |
| Recent Price: 107.67 Smart Investing & Trading Score: 10 | |
| Day Percent Change: 1.8% Day Change: 1.9 | |
| Week Change: 0.67% Year-to-date Change: -6.4% | |
| CPT Links: Profile News Message Board | |
| Charts:- Daily , Weekly | |
| Add CPT to Watchlist: View: Get Complete CPT Trend Analysis ➞ | |
 | UDR UDR, Inc. |
| Sector: Financials | |
| SubSector: REIT - Residential | |
| MarketCap: 10180.1 Millions | |
| Recent Price: 38.55 Smart Investing & Trading Score: 10 | |
| Day Percent Change: 1.53% Day Change: 0.58 | |
| Week Change: -0.31% Year-to-date Change: -9.3% | |
| UDR Links: Profile News Message Board | |
| Charts:- Daily , Weekly | |
| Add UDR to Watchlist: View: Get Complete UDR Trend Analysis ➞ | |
 | TIPT Tiptree Inc. |
| Sector: Financials | |
| SubSector: Life Insurance | |
| MarketCap: 183.486 Millions | |
| Recent Price: 20.41 Smart Investing & Trading Score: 10 | |
| Day Percent Change: 0.94% Day Change: 0.19 | |
| Week Change: 0.74% Year-to-date Change: -1.9% | |
| TIPT Links: Profile News Message Board | |
| Charts:- Daily , Weekly | |
| Add TIPT to Watchlist: View: Get Complete TIPT Trend Analysis ➞ | |
 | KRNY Kearny Financial Corp. |
| Sector: Financials | |
| SubSector: Savings & Loans | |
| MarketCap: 781.73 Millions | |
| Recent Price: 5.92 Smart Investing & Trading Score: 10 | |
| Day Percent Change: 0.51% Day Change: 0.03 | |
| Week Change: 1.2% Year-to-date Change: -15.2% | |
| KRNY Links: Profile News Message Board | |
| Charts:- Daily , Weekly | |
| Add KRNY to Watchlist: View: Get Complete KRNY Trend Analysis ➞ | |
 | INBK First Internet Bancorp |
| Sector: Financials | |
| SubSector: Regional - Midwest Banks | |
| MarketCap: 149.07 Millions | |
| Recent Price: 21.95 Smart Investing & Trading Score: 10 | |
| Day Percent Change: 0.46% Day Change: 0.1 | |
| Week Change: 2.28% Year-to-date Change: -38.9% | |
| INBK Links: Profile News Message Board | |
| Charts:- Daily , Weekly | |
| Add INBK to Watchlist: View: Get Complete INBK Trend Analysis ➞ | |
 | IBCP Independent Bank Corporation |
| Sector: Financials | |
| SubSector: Regional - Midwest Banks | |
| MarketCap: 273.67 Millions | |
| Recent Price: 30.25 Smart Investing & Trading Score: 10 | |
| Day Percent Change: 0.46% Day Change: 0.14 | |
| Week Change: 0.53% Year-to-date Change: -12.5% | |
| IBCP Links: Profile News Message Board | |
| Charts:- Daily , Weekly | |
| Add IBCP to Watchlist: View: Get Complete IBCP Trend Analysis ➞ | |
 | CUZ Cousins Properties Incorporated |
| Sector: Financials | |
| SubSector: REIT - Diversified | |
| MarketCap: 3828.13 Millions | |
| Recent Price: 26.70 Smart Investing & Trading Score: 10 | |
| Day Percent Change: 0.34% Day Change: 0.09 | |
| Week Change: 0.64% Year-to-date Change: -11.0% | |
| CUZ Links: Profile News Message Board | |
| Charts:- Daily , Weekly | |
| Add CUZ to Watchlist: View: Get Complete CUZ Trend Analysis ➞ | |
 | HIW Highwoods Properties, Inc. |
| Sector: Financials | |
| SubSector: REIT - Office | |
| MarketCap: 3227.46 Millions | |
| Recent Price: 28.56 Smart Investing & Trading Score: 10 | |
| Day Percent Change: 0.32% Day Change: 0.09 | |
| Week Change: -0.21% Year-to-date Change: -5.0% | |
| HIW Links: Profile News Message Board | |
| Charts:- Daily , Weekly | |
| Add HIW to Watchlist: View: Get Complete HIW Trend Analysis ➞ | |
 | PGC Peapack-Gladstone Financial Corporation |
| Sector: Financials | |
| SubSector: Regional - Northeast Banks | |
| MarketCap: 284.399 Millions | |
| Recent Price: 25.01 Smart Investing & Trading Score: 10 | |
| Day Percent Change: 0.24% Day Change: 0.06 | |
| Week Change: 1.05% Year-to-date Change: -21.9% | |
| PGC Links: Profile News Message Board | |
| Charts:- Daily , Weekly | |
| Add PGC to Watchlist: View: Get Complete PGC Trend Analysis ➞ | |
 | CASH Meta Financial Group, Inc. |
| Sector: Financials | |
| SubSector: Savings & Loans | |
| MarketCap: 849.33 Millions | |
| Recent Price: 74.58 Smart Investing & Trading Score: 10 | |
| Day Percent Change: 0.08% Day Change: 0.06 | |
| Week Change: -0.28% Year-to-date Change: 1.4% | |
| CASH Links: Profile News Message Board | |
| Charts:- Daily , Weekly | |
| Add CASH to Watchlist: View: Get Complete CASH Trend Analysis ➞ | |
| For tabular summary view of above stock list: Summary View ➞ 0 - 25 , 25 - 50 , 50 - 75 , 75 - 100 , 100 - 125 , 125 - 150 , 150 - 175 , 175 - 200 , 200 - 225 , 225 - 250 , 250 - 275 , 275 - 300 , 300 - 325 , 325 - 350 , 350 - 375 , 375 - 400 , 400 - 425 , 425 - 450 , 450 - 475 , 475 - 500 , 500 - 525 , 525 - 550 , 550 - 575 | ||
| Click To Change The Sort Order: By Market Cap or Company Size Performance: Year-to-date, Week and Day | |
| Select Chart Type: | ||
|
Best Stocks Today 12Stocks.com |
© 2025 12Stocks.com Terms & Conditions Privacy Contact Us
All Information Provided Only For Education And Not To Be Used For Investing or Trading. See Terms & Conditions


One More Thing ... Get Best Stocks Delivered Daily!
Never Ever Miss A Move With Our Top Ten Stocks Lists
Find Best Stocks In Any Market - Bull or Bear Market
Take A Peek At Our Top Ten Stocks Lists: Daily, Weekly, Year-to-Date & Top Trends
Find Best Stocks In Any Market - Bull or Bear Market
Take A Peek At Our Top Ten Stocks Lists: Daily, Weekly, Year-to-Date & Top Trends
Financial Stocks With Best Up Trends [0-bearish to 100-bullish]: Lemonade [100], MBIA [100], AlTi Global[100], Cushman & Wakefield[100], LGI Homes[100], Rocket [100], Tanger Factory[100], Mr. Cooper[100], CBL & Associates Properties[100], Hamilton Lane[100], Simon Property[100]
Best Financial Stocks Year-to-Date:
ESSA Bancorp[3207.77%], Easterly Government[107.23%], Mr. Cooper[97.21%], Heritage Insurance[79.01%], Root [72.94%], Industrial Logistics[70.13%], Rocket [69.21%], Diversified Healthcare[50.49%], ProAssurance [49.72%], World Acceptance[41.78%], XP [41.43%] Best Financial Stocks This Week:
Uniti [47.66%], Lemonade [31.68%], AlTi Global[24.1%], MBIA [20.54%], Industrial Logistics[14.9%], Cushman & Wakefield[12.24%], Tanger Factory[9.38%], Hippo [9.07%], Rocket [9.01%], LGI Homes[8.92%], eXp World[8.81%] Best Financial Stocks Daily:
Lemonade [29.54%], MBIA [22.5%], AlTi Global[18.05%], Cushman & Wakefield[8.69%], LGI Homes[8.6%], Rocket [6.81%], Alexander s[6.14%], Tanger Factory[5.97%], Brookfield Business[5.91%], Mr. Cooper[5.69%], B. Riley[5.38%]