
 Login Sign Up


| |||||
 |  | ||||

| 12Stocks.com Market Intelligence |
Best Financial Stocks
| In a hurry? Financial Stocks Lists: Performance Trends Table, Stock Charts
Sort Financial stocks: Daily, Weekly, Year-to-Date, Market Cap & Trends. Filter Financial stocks list by size:All Financial Large Mid-Range Small & MicroCap |
| 12Stocks.com Financial Stocks Performances & Trends Daily | |||||||||
|
|  The overall Smart Investing & Trading Score is 33 (0-bearish to 100-bullish) which puts Financial sector in short term bearish to neutral trend. The Smart Investing & Trading Score from previous trading session is 26 and an improvement of trend continues.
| ||||||||
Here are the Smart Investing & Trading Scores of the most requested Financial stocks at 12Stocks.com (click stock name for detailed review):
|


| 12Stocks.com: Investing in Financial sector with Stocks | |
|
The following table helps investors and traders sort through current performance and trends (as measured by Smart Investing & Trading Score) of various
stocks in the Financial sector. Quick View: Move mouse or cursor over stock symbol (ticker) to view short-term Technical chart and over stock name to view long term chart. Click on  to add stock symbol to your watchlist and to add stock symbol to your watchlist and  to view watchlist. Click on any ticker or stock name for detailed market intelligence report for that stock. to view watchlist. Click on any ticker or stock name for detailed market intelligence report for that stock. |
12Stocks.com Performance of Stocks in Financial Sector
| Ticker | Stock Name | Watchlist | Category | Recent Price | Trend Score | Change % | YTD Change% |
| BMRC | Bank of Marin Bancorp |   | Regional Banks | 22.29 | 36 | 0.04% | -5.31% |
| SFNC | Simmons First | | Banks | 19.04 | 36 | 0.00% | -13.24% |
| BSRR | Sierra Bancorp | | Regional Banks | 28.59 | 36 | -0.03% | -0.31% |
| CHCO | City Holding | | Regional Banks | 120.90 | 36 | -0.04% | 3.46% |
| FULT | Fulton | | Regional Banks | 17.72 | 36 | -0.23% | -7.17% |
| SBSI | Southside Bancshares | | Regional Banks | 28.88 | 36 | -0.35% | -8.01% |
| C | Citi | | Banks | 91.52 | 36 | -0.61% | 30.92% |
| ORRF | Orrstown | | Regional Banks | 32.18 | 36 | -1.14% | -11.42% |
| UNTY | Unity Bancorp | | Banks | 47.31 | 36 | -1.19% | 8.85% |
| RC | Ready Capital | | Mortgage | 4.18 | 35 | 0.00% | -37.13% |
| CUBE | CubeSmart | | REIT - Industrial | 39.66 | 35 | -0.15% | -5.15% |
| CXW | CoreCivic | | REIT - | 20.11 | 35 | 2.29% | -7.50% |
| PECO | Phillips Edison | | REIT - Retail | 34.02 | 35 | 0.92% | -8.13% |
| UVE | Universal Insurance | | Insurance | 23.51 | 35 | 0.86% | 12.47% |
| MMC | Marsh & McLennan | | Insurance | 200.50 | 35 | 0.71% | -4.94% |
| PLYM | Plymouth Industrial | | REIT - Industrial | 14.55 | 35 | 0.69% | -17.08% |
| PGR | Progressive | | Insurance | 242.94 | 35 | 0.56% | 3.45% |
| KRG | Kite Realty | | REIT - Retail | 21.93 | 35 | 0.55% | -10.83% |
| HCI | HCI | | Insurance | 140.20 | 35 | 0.51% | 20.72% |
| ESRT | Empire State | | REIT - | 7.25 | 35 | 0.42% | -29.44% |
| WSR | Whitestone REIT | | REIT - Retail | 12.17 | 35 | 0.41% | -12.99% |
| FRPH | FRP | | Property Mgmt | 26.41 | 35 | 0.34% | -13.78% |
| SAFT | Safety Insurance | | Insurance | 70.23 | 35 | 0.27% | -13.75% |
| AXS | AXIS Capital | | Insurance | 94.33 | 35 | 0.26% | 6.92% |
| SHO | Sunstone Hotel | | REIT | 8.77 | 35 | 0.23% | -25.22% |
| For chart view version of above stock list: Chart View ➞ 0 - 25 , 25 - 50 , 50 - 75 , 75 - 100 , 100 - 125 , 125 - 150 , 150 - 175 , 175 - 200 , 200 - 225 , 225 - 250 , 250 - 275 , 275 - 300 , 300 - 325 , 325 - 350 , 350 - 375 , 375 - 400 , 400 - 425 , 425 - 450 , 450 - 475 , 475 - 500 , 500 - 525 , 525 - 550 , 550 - 575 | ||
 | Click To Change The Sort Order: By Market Cap or Company Size Performance: Year-to-date, Week and Day |  |
|
Get the most comprehensive stock market coverage daily at 12Stocks.com ➞ Best Stocks Today ➞ Best Stocks Weekly ➞ Best Stocks Year-to-Date ➞ Best Stocks Trends ➞  Best Stocks Today 12Stocks.com Best Nasdaq Stocks ➞ Best S&P 500 Stocks ➞ Best Tech Stocks ➞ Best Biotech Stocks ➞ |
| Detailed Overview of Financial Stocks |
| Financial Technical Overview, Leaders & Laggards, Top Financial ETF Funds & Detailed Financial Stocks List, Charts, Trends & More |
| Financial Sector: Technical Analysis, Trends & YTD Performance | |
| Financial sector is composed of stocks
from banks, brokers, insurance, REITs
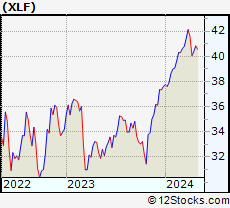
and services subsectors. Financial sector, as represented by XLF, an exchange-traded fund [ETF] that holds basket of Financial stocks (e.g, Bank of America, Goldman Sachs) is up by 7.36% and is currently outperforming the overall market by 0.31% year-to-date. Below is a quick view of Technical charts and trends: |
|
 XLF Weekly Chart |
|
| Long Term Trend: Good | |
| Medium Term Trend: Not Good | |
 XLF Daily Chart |
|
| Short Term Trend: Not Good | |
| Overall Trend Score: 33 | |
| YTD Performance: 7.36% | |
| **Trend Scores & Views Are Only For Educational Purposes And Not For Investing | |
| 12Stocks.com: Top Performing Financial Sector Stocks | ||||||||||||||||||||||||||||||||||||||||||||||||
 The top performing Financial sector stocks year to date are
Now, more recently, over last week, the top performing Financial sector stocks on the move are


|
||||||||||||||||||||||||||||||||||||||||||||||||
| 12Stocks.com: Investing in Financial Sector using Exchange Traded Funds | |
|
The following table shows list of key exchange traded funds (ETF) that
help investors track Financial Index. For detailed view, check out our ETF Funds section of our website. Quick View: Move mouse or cursor over ETF symbol (ticker) to view short-term Technical chart and over ETF name to view long term chart. Click on ticker or stock name for detailed view. Click on to add stock symbol to your watchlist and to view watchlist. |
12Stocks.com List of ETFs that track Financial Index
| Ticker | ETF Name | Watchlist | Recent Price | Smart Investing & Trading Score | Change % | Week % | Year-to-date % |
| XLF | Financial | | 51.70 | 33 | -0.4 | 0.58 | 7.36% |
| IAI | Broker-Dealers & Secs | | 173.45 | 53 | -0.87 | 1.45 | 20.77% |
| KBE | Bank | | 56.27 | 51 | 0.52 | 1.83 | 2.16% |
| FAS | Financial Bull 3X | | 159.77 | 33 | -1.27 | 1.61 | 6.12% |
| FAZ | Financial Bear 3X | | 4.60 | 62 | 1.32 | -1.5 | -26.44% |
| UYG | Financials | | 92.14 | 26 | -0.79 | 0.92 | 8.14% |
| KIE | Insurance | | 56.82 | 35 | 0.71 | 1.99 | 1.03% |
| 12Stocks.com: Charts, Trends, Fundamental Data and Performances of Financial Stocks | |
|
We now take in-depth look at all Financial stocks including charts, multi-period performances and overall trends (as measured by Smart Investing & Trading Score). One can sort Financial stocks (click link to choose) by Daily, Weekly and by Year-to-Date performances. Also, one can sort by size of the company or by market capitalization. |
| Select Your Default Chart Type: | |||||
| |||||
| Click on stock symbol or name for detailed view. Click on to add stock symbol to your watchlist and to view watchlist. Quick View: Move mouse or cursor over "Daily" to quickly view daily Technical stock chart and over "Weekly" to view weekly Technical stock chart. | |||||

 | BMRC Bank of Marin Bancorp |
| Sector: Financials | |
| SubSector: Regional - Pacific Banks | |
| MarketCap: 367.929 Millions | |
| Recent Price: 22.29 Smart Investing & Trading Score: 36 | |
| Day Percent Change: 0.04% Day Change: 0.01 | |
| Week Change: 0.32% Year-to-date Change: -5.3% | |
| BMRC Links: Profile News Message Board | |
| Charts:- Daily , Weekly | |
| Add BMRC to Watchlist: View: Get Complete BMRC Trend Analysis ➞ | |
 | SFNC Simmons First National Corporation |
| Sector: Financials | |
| SubSector: Money Center Banks | |
| MarketCap: 2125.49 Millions | |
| Recent Price: 19.04 Smart Investing & Trading Score: 36 | |
| Day Percent Change: 0% Day Change: 0 | |
| Week Change: 0.11% Year-to-date Change: -13.2% | |
| SFNC Links: Profile News Message Board | |
| Charts:- Daily , Weekly | |
| Add SFNC to Watchlist: View: Get Complete SFNC Trend Analysis ➞ | |
 | BSRR Sierra Bancorp |
| Sector: Financials | |
| SubSector: Regional - Pacific Banks | |
| MarketCap: 256.929 Millions | |
| Recent Price: 28.59 Smart Investing & Trading Score: 36 | |
| Day Percent Change: -0.03% Day Change: -0.01 | |
| Week Change: 0% Year-to-date Change: -0.3% | |
| BSRR Links: Profile News Message Board | |
| Charts:- Daily , Weekly | |
| Add BSRR to Watchlist: View: Get Complete BSRR Trend Analysis ➞ | |
 | CHCO City Holding Company |
| Sector: Financials | |
| SubSector: Regional - Mid-Atlantic Banks | |
| MarketCap: 1059.59 Millions | |
| Recent Price: 120.90 Smart Investing & Trading Score: 36 | |
| Day Percent Change: -0.04% Day Change: -0.05 | |
| Week Change: 0.12% Year-to-date Change: 3.5% | |
| CHCO Links: Profile News Message Board | |
| Charts:- Daily , Weekly | |
| Add CHCO to Watchlist: View: Get Complete CHCO Trend Analysis ➞ | |
 | FULT Fulton Financial Corporation |
| Sector: Financials | |
| SubSector: Regional - Northeast Banks | |
| MarketCap: 2030.89 Millions | |
| Recent Price: 17.72 Smart Investing & Trading Score: 36 | |
| Day Percent Change: -0.23% Day Change: -0.04 | |
| Week Change: 0.57% Year-to-date Change: -7.2% | |
| FULT Links: Profile News Message Board | |
| Charts:- Daily , Weekly | |
| Add FULT to Watchlist: View: Get Complete FULT Trend Analysis ➞ | |
 | SBSI Southside Bancshares, Inc. |
| Sector: Financials | |
| SubSector: Regional - Mid-Atlantic Banks | |
| MarketCap: 971.259 Millions | |
| Recent Price: 28.88 Smart Investing & Trading Score: 36 | |
| Day Percent Change: -0.35% Day Change: -0.1 | |
| Week Change: 0.66% Year-to-date Change: -8.0% | |
| SBSI Links: Profile News Message Board | |
| Charts:- Daily , Weekly | |
| Add SBSI to Watchlist: View: Get Complete SBSI Trend Analysis ➞ | |
 | C Citigroup Inc. |
| Sector: Financials | |
| SubSector: Money Center Banks | |
| MarketCap: 94128 Millions | |
| Recent Price: 91.52 Smart Investing & Trading Score: 36 | |
| Day Percent Change: -0.61% Day Change: -0.56 | |
| Week Change: -0.34% Year-to-date Change: 30.9% | |
| C Links: Profile News Message Board | |
| Charts:- Daily , Weekly | |
| Add C to Watchlist: View: Get Complete C Trend Analysis ➞ | |
 | ORRF Orrstown Financial Services, Inc. |
| Sector: Financials | |
| SubSector: Regional - Northeast Banks | |
| MarketCap: 159.999 Millions | |
| Recent Price: 32.18 Smart Investing & Trading Score: 36 | |
| Day Percent Change: -1.14% Day Change: -0.37 | |
| Week Change: -0.09% Year-to-date Change: -11.4% | |
| ORRF Links: Profile News Message Board | |
| Charts:- Daily , Weekly | |
| Add ORRF to Watchlist: View: Get Complete ORRF Trend Analysis ➞ | |
 | UNTY Unity Bancorp, Inc. |
| Sector: Financials | |
| SubSector: Money Center Banks | |
| MarketCap: 149.099 Millions | |
| Recent Price: 47.31 Smart Investing & Trading Score: 36 | |
| Day Percent Change: -1.19% Day Change: -0.57 | |
| Week Change: -1.13% Year-to-date Change: 8.9% | |
| UNTY Links: Profile News Message Board | |
| Charts:- Daily , Weekly | |
| Add UNTY to Watchlist: View: Get Complete UNTY Trend Analysis ➞ | |
 | RC Ready Capital Corporation |
| Sector: Financials | |
| SubSector: Mortgage Investment | |
| MarketCap: 358.039 Millions | |
| Recent Price: 4.18 Smart Investing & Trading Score: 35 | |
| Day Percent Change: 0% Day Change: 0 | |
| Week Change: 0.48% Year-to-date Change: -37.1% | |
| RC Links: Profile News Message Board | |
| Charts:- Daily , Weekly | |
| Add RC to Watchlist: View: Get Complete RC Trend Analysis ➞ | |
 | CUBE CubeSmart |
| Sector: Financials | |
| SubSector: REIT - Industrial | |
| MarketCap: 4562.99 Millions | |
| Recent Price: 39.66 Smart Investing & Trading Score: 35 | |
| Day Percent Change: -0.15% Day Change: -0.06 | |
| Week Change: -0.6% Year-to-date Change: -5.2% | |
| CUBE Links: Profile News Message Board | |
| Charts:- Daily , Weekly | |
| Add CUBE to Watchlist: View: Get Complete CUBE Trend Analysis ➞ | |
 | CXW CoreCivic, Inc. |
| Sector: Financials | |
| SubSector: REIT - Diversified | |
| MarketCap: 1440.23 Millions | |
| Recent Price: 20.11 Smart Investing & Trading Score: 35 | |
| Day Percent Change: 2.29% Day Change: 0.45 | |
| Week Change: 2.55% Year-to-date Change: -7.5% | |
| CXW Links: Profile News Message Board | |
| Charts:- Daily , Weekly | |
| Add CXW to Watchlist: View: Get Complete CXW Trend Analysis ➞ | |
 | PECO Phillips Edison & Company, Inc. |
| Sector: Financials | |
| SubSector: REIT - Retail | |
| MarketCap: 3920 Millions | |
| Recent Price: 34.02 Smart Investing & Trading Score: 35 | |
| Day Percent Change: 0.92% Day Change: 0.31 | |
| Week Change: 1.46% Year-to-date Change: -8.1% | |
| PECO Links: Profile News Message Board | |
| Charts:- Daily , Weekly | |
| Add PECO to Watchlist: View: Get Complete PECO Trend Analysis ➞ | |
 | UVE Universal Insurance Holdings, Inc. |
| Sector: Financials | |
| SubSector: Property & Casualty Insurance | |
| MarketCap: 616.212 Millions | |
| Recent Price: 23.51 Smart Investing & Trading Score: 35 | |
| Day Percent Change: 0.86% Day Change: 0.2 | |
| Week Change: 2.22% Year-to-date Change: 12.5% | |
| UVE Links: Profile News Message Board | |
| Charts:- Daily , Weekly | |
| Add UVE to Watchlist: View: Get Complete UVE Trend Analysis ➞ | |
 | MMC Marsh & McLennan Companies, Inc. |
| Sector: Financials | |
| SubSector: Insurance Brokers | |
| MarketCap: 42821.8 Millions | |
| Recent Price: 200.50 Smart Investing & Trading Score: 35 | |
| Day Percent Change: 0.71% Day Change: 1.42 | |
| Week Change: 1.38% Year-to-date Change: -4.9% | |
| MMC Links: Profile News Message Board | |
| Charts:- Daily , Weekly | |
| Add MMC to Watchlist: View: Get Complete MMC Trend Analysis ➞ | |
 | PLYM Plymouth Industrial REIT, Inc. |
| Sector: Financials | |
| SubSector: REIT - Industrial | |
| MarketCap: 153.449 Millions | |
| Recent Price: 14.55 Smart Investing & Trading Score: 35 | |
| Day Percent Change: 0.69% Day Change: 0.1 | |
| Week Change: 1.11% Year-to-date Change: -17.1% | |
| PLYM Links: Profile News Message Board | |
| Charts:- Daily , Weekly | |
| Add PLYM to Watchlist: View: Get Complete PLYM Trend Analysis ➞ | |
 | PGR The Progressive Corporation |
| Sector: Financials | |
| SubSector: Property & Casualty Insurance | |
| MarketCap: 43112 Millions | |
| Recent Price: 242.94 Smart Investing & Trading Score: 35 | |
| Day Percent Change: 0.56% Day Change: 1.36 | |
| Week Change: 0.77% Year-to-date Change: 3.5% | |
| PGR Links: Profile News Message Board | |
| Charts:- Daily , Weekly | |
| Add PGR to Watchlist: View: Get Complete PGR Trend Analysis ➞ | |
 | KRG Kite Realty Group Trust |
| Sector: Financials | |
| SubSector: REIT - Retail | |
| MarketCap: 1030.14 Millions | |
| Recent Price: 21.93 Smart Investing & Trading Score: 35 | |
| Day Percent Change: 0.55% Day Change: 0.12 | |
| Week Change: 1.34% Year-to-date Change: -10.8% | |
| KRG Links: Profile News Message Board | |
| Charts:- Daily , Weekly | |
| Add KRG to Watchlist: View: Get Complete KRG Trend Analysis ➞ | |
 | HCI HCI Group, Inc. |
| Sector: Financials | |
| SubSector: Property & Casualty Insurance | |
| MarketCap: 297.412 Millions | |
| Recent Price: 140.20 Smart Investing & Trading Score: 35 | |
| Day Percent Change: 0.51% Day Change: 0.71 | |
| Week Change: 0.97% Year-to-date Change: 20.7% | |
| HCI Links: Profile News Message Board | |
| Charts:- Daily , Weekly | |
| Add HCI to Watchlist: View: Get Complete HCI Trend Analysis ➞ | |
 | ESRT Empire State Realty Trust, Inc. |
| Sector: Financials | |
| SubSector: REIT - Diversified | |
| MarketCap: 1632.13 Millions | |
| Recent Price: 7.25 Smart Investing & Trading Score: 35 | |
| Day Percent Change: 0.42% Day Change: 0.03 | |
| Week Change: 1.4% Year-to-date Change: -29.4% | |
| ESRT Links: Profile News Message Board | |
| Charts:- Daily , Weekly | |
| Add ESRT to Watchlist: View: Get Complete ESRT Trend Analysis ➞ | |
 | WSR Whitestone REIT |
| Sector: Financials | |
| SubSector: REIT - Retail | |
| MarketCap: 316.114 Millions | |
| Recent Price: 12.17 Smart Investing & Trading Score: 35 | |
| Day Percent Change: 0.41% Day Change: 0.05 | |
| Week Change: 3.14% Year-to-date Change: -13.0% | |
| WSR Links: Profile News Message Board | |
| Charts:- Daily , Weekly | |
| Add WSR to Watchlist: View: Get Complete WSR Trend Analysis ➞ | |
 | FRPH FRP Holdings, Inc. |
| Sector: Financials | |
| SubSector: Property Management | |
| MarketCap: 374.442 Millions | |
| Recent Price: 26.41 Smart Investing & Trading Score: 35 | |
| Day Percent Change: 0.34% Day Change: 0.09 | |
| Week Change: 1.77% Year-to-date Change: -13.8% | |
| FRPH Links: Profile News Message Board | |
| Charts:- Daily , Weekly | |
| Add FRPH to Watchlist: View: Get Complete FRPH Trend Analysis ➞ | |
 | SAFT Safety Insurance Group, Inc. |
| Sector: Financials | |
| SubSector: Property & Casualty Insurance | |
| MarketCap: 1145.12 Millions | |
| Recent Price: 70.23 Smart Investing & Trading Score: 35 | |
| Day Percent Change: 0.27% Day Change: 0.19 | |
| Week Change: 1.34% Year-to-date Change: -13.8% | |
| SAFT Links: Profile News Message Board | |
| Charts:- Daily , Weekly | |
| Add SAFT to Watchlist: View: Get Complete SAFT Trend Analysis ➞ | |
 | AXS AXIS Capital Holdings Limited |
| Sector: Financials | |
| SubSector: Property & Casualty Insurance | |
| MarketCap: 3709.12 Millions | |
| Recent Price: 94.33 Smart Investing & Trading Score: 35 | |
| Day Percent Change: 0.26% Day Change: 0.24 | |
| Week Change: 1.07% Year-to-date Change: 6.9% | |
| AXS Links: Profile News Message Board | |
| Charts:- Daily , Weekly | |
| Add AXS to Watchlist: View: Get Complete AXS Trend Analysis ➞ | |
 | SHO Sunstone Hotel Investors, Inc. |
| Sector: Financials | |
| SubSector: REIT - Hotel/Motel | |
| MarketCap: 1861.04 Millions | |
| Recent Price: 8.77 Smart Investing & Trading Score: 35 | |
| Day Percent Change: 0.23% Day Change: 0.02 | |
| Week Change: 1.5% Year-to-date Change: -25.2% | |
| SHO Links: Profile News Message Board | |
| Charts:- Daily , Weekly | |
| Add SHO to Watchlist: View: Get Complete SHO Trend Analysis ➞ | |
| For tabular summary view of above stock list: Summary View ➞ 0 - 25 , 25 - 50 , 50 - 75 , 75 - 100 , 100 - 125 , 125 - 150 , 150 - 175 , 175 - 200 , 200 - 225 , 225 - 250 , 250 - 275 , 275 - 300 , 300 - 325 , 325 - 350 , 350 - 375 , 375 - 400 , 400 - 425 , 425 - 450 , 450 - 475 , 475 - 500 , 500 - 525 , 525 - 550 , 550 - 575 | ||
| Click To Change The Sort Order: By Market Cap or Company Size Performance: Year-to-date, Week and Day | |
| Select Chart Type: | ||
|
Best Stocks Today 12Stocks.com |
© 2025 12Stocks.com Terms & Conditions Privacy Contact Us
All Information Provided Only For Education And Not To Be Used For Investing or Trading. See Terms & Conditions


One More Thing ... Get Best Stocks Delivered Daily!
Never Ever Miss A Move With Our Top Ten Stocks Lists
Find Best Stocks In Any Market - Bull or Bear Market
Take A Peek At Our Top Ten Stocks Lists: Daily, Weekly, Year-to-Date & Top Trends
Find Best Stocks In Any Market - Bull or Bear Market
Take A Peek At Our Top Ten Stocks Lists: Daily, Weekly, Year-to-Date & Top Trends
Financial Stocks With Best Up Trends [0-bearish to 100-bullish]: Lemonade [100], MBIA [100], AlTi Global[100], Cushman & Wakefield[100], LGI Homes[100], Rocket [100], Tanger Factory[100], Mr. Cooper[100], CBL & Associates Properties[100], Hamilton Lane[100], Simon Property[100]
Best Financial Stocks Year-to-Date:
ESSA Bancorp[3207.77%], Easterly Government[107.23%], Mr. Cooper[97.21%], Heritage Insurance[79.01%], Root [72.94%], Industrial Logistics[70.13%], Rocket [69.21%], Diversified Healthcare[50.49%], ProAssurance [49.72%], World Acceptance[41.78%], XP [41.43%] Best Financial Stocks This Week:
Uniti [47.66%], Lemonade [31.68%], AlTi Global[24.1%], MBIA [20.54%], Industrial Logistics[14.9%], Cushman & Wakefield[12.24%], Tanger Factory[9.38%], Hippo [9.07%], Rocket [9.01%], LGI Homes[8.92%], eXp World[8.81%] Best Financial Stocks Daily:
Lemonade [29.54%], MBIA [22.5%], AlTi Global[18.05%], Cushman & Wakefield[8.69%], LGI Homes[8.6%], Rocket [6.81%], Alexander s[6.14%], Tanger Factory[5.97%], Brookfield Business[5.91%], Mr. Cooper[5.69%], B. Riley[5.38%]