
 Login Sign Up


| |||||
 |  | ||||

| 12Stocks.com Market Intelligence |
Best Financial Stocks
| In a hurry? Financial Stocks Lists: Performance Trends Table, Stock Charts
Sort Financial stocks: Daily, Weekly, Year-to-Date, Market Cap & Trends. Filter Financial stocks list by size:All Financial Large Mid-Range Small & MicroCap |
| 12Stocks.com Financial Stocks Performances & Trends Daily | |||||||||
|
|  The overall Smart Investing & Trading Score is 33 (0-bearish to 100-bullish) which puts Financial sector in short term bearish to neutral trend. The Smart Investing & Trading Score from previous trading session is 26 and an improvement of trend continues.
| ||||||||
Here are the Smart Investing & Trading Scores of the most requested Financial stocks at 12Stocks.com (click stock name for detailed review):
|


| 12Stocks.com: Investing in Financial sector with Stocks | |
|
The following table helps investors and traders sort through current performance and trends (as measured by Smart Investing & Trading Score) of various
stocks in the Financial sector. Quick View: Move mouse or cursor over stock symbol (ticker) to view short-term Technical chart and over stock name to view long term chart. Click on  to add stock symbol to your watchlist and to add stock symbol to your watchlist and  to view watchlist. Click on any ticker or stock name for detailed market intelligence report for that stock. to view watchlist. Click on any ticker or stock name for detailed market intelligence report for that stock. |
12Stocks.com Performance of Stocks in Financial Sector
| Ticker | Stock Name | Watchlist | Category | Recent Price | Trend Score | Change % | YTD Change% |
| TRST | TrustCo Bank |   | Regional Banks | 33.21 | 41 | 0.06% | 0.86% |
| TCBI | Texas Capital | | Regional - Southwest Banks | 81.34 | 41 | 0.04% | 4.02% |
| GDOT | Green Dot | | Credit Services | 9.79 | 41 | -1.81% | -7.99% |
| TMP | Tompkins | | Regional Banks | 63.32 | 40 | -0.30% | -5.82% |
| FR | First Industrial | | REIT - Industrial | 48.75 | 40 | 1.23% | -1.94% |
| NMIH | NMI | | Insurance | 37.85 | 40 | 0.66% | 2.97% |
| MKTX | MarketAxess | | Brokerage | 207.81 | 40 | -0.77% | -7.70% |
| FPI | Farmland Partners | | REIT - | 10.86 | 39 | 1.02% | -6.68% |
| NBN | Northeast Bank | | Regional Banks | 95.69 | 39 | 1.78% | 4.33% |
| BHLB | Berkshire Hills | | S&L | 24.73 | 38 | 0.77% | -12.48% |
| AFG | American | | Insurance | 124.32 | 38 | 0.58% | -6.61% |
| BRKL | Brookline Bancorp | | S&L | 10.36 | 38 | 0.39% | -11.23% |
| STBA | S&T Bancorp | | Regional Banks | 36.48 | 38 | 0.36% | -3.72% |
| WABC | Westamerica Ban | | Regional Banks | 47.87 | 38 | 0.21% | -7.97% |
| RBCAA | Republic Bancorp | | Regional Banks | 68.64 | 38 | 0.01% | -1.07% |
| HTBK | Heritage Commerce | | Regional Banks | 9.32 | 38 | -0.75% | 0.67% |
| FMAO | Farmers & Merchants Bancorp | | Regional Banks | 23.94 | 38 | -2.84% | -17.89% |
| UHT | Universal Health | | REIT | 39.36 | 37 | 0.36% | 7.72% |
| FBP | First Ban | | Foreign Banks | 20.53 | 36 | 0.44% | 11.43% |
| MBWM | Mercantile Bank | | Regional Banks | 45.04 | 36 | 0.42% | 2.06% |
| SMBC | Southern Missouri | | S&L | 53.19 | 36 | 0.34% | -6.93% |
| SYBT | Stock Yards | | Regional Banks | 74.13 | 36 | 0.31% | 3.99% |
| LKFN | Lakeland | | Regional Banks | 62.00 | 36 | 0.26% | -8.32% |
| MCB | Metropolitan Bank | | Regional Banks | 69.28 | 36 | 0.13% | 18.63% |
| SMBK | Smart | | Regional Banks | 33.73 | 36 | 0.06% | 8.88% |
| For chart view version of above stock list: Chart View ➞ 0 - 25 , 25 - 50 , 50 - 75 , 75 - 100 , 100 - 125 , 125 - 150 , 150 - 175 , 175 - 200 , 200 - 225 , 225 - 250 , 250 - 275 , 275 - 300 , 300 - 325 , 325 - 350 , 350 - 375 , 375 - 400 , 400 - 425 , 425 - 450 , 450 - 475 , 475 - 500 , 500 - 525 , 525 - 550 , 550 - 575 | ||
 | Click To Change The Sort Order: By Market Cap or Company Size Performance: Year-to-date, Week and Day |  |
|
Get the most comprehensive stock market coverage daily at 12Stocks.com ➞ Best Stocks Today ➞ Best Stocks Weekly ➞ Best Stocks Year-to-Date ➞ Best Stocks Trends ➞  Best Stocks Today 12Stocks.com Best Nasdaq Stocks ➞ Best S&P 500 Stocks ➞ Best Tech Stocks ➞ Best Biotech Stocks ➞ |
| Detailed Overview of Financial Stocks |
| Financial Technical Overview, Leaders & Laggards, Top Financial ETF Funds & Detailed Financial Stocks List, Charts, Trends & More |
| Financial Sector: Technical Analysis, Trends & YTD Performance | |
| Financial sector is composed of stocks
from banks, brokers, insurance, REITs
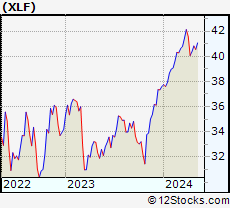
and services subsectors. Financial sector, as represented by XLF, an exchange-traded fund [ETF] that holds basket of Financial stocks (e.g, Bank of America, Goldman Sachs) is up by 7.36% and is currently outperforming the overall market by 0.31% year-to-date. Below is a quick view of Technical charts and trends: |
|
 XLF Weekly Chart |
|
| Long Term Trend: Good | |
| Medium Term Trend: Not Good | |
 XLF Daily Chart |
|
| Short Term Trend: Not Good | |
| Overall Trend Score: 33 | |
| YTD Performance: 7.36% | |
| **Trend Scores & Views Are Only For Educational Purposes And Not For Investing | |
| 12Stocks.com: Top Performing Financial Sector Stocks | ||||||||||||||||||||||||||||||||||||||||||||||||
 The top performing Financial sector stocks year to date are
Now, more recently, over last week, the top performing Financial sector stocks on the move are


|
||||||||||||||||||||||||||||||||||||||||||||||||
| 12Stocks.com: Investing in Financial Sector using Exchange Traded Funds | |
|
The following table shows list of key exchange traded funds (ETF) that
help investors track Financial Index. For detailed view, check out our ETF Funds section of our website. Quick View: Move mouse or cursor over ETF symbol (ticker) to view short-term Technical chart and over ETF name to view long term chart. Click on ticker or stock name for detailed view. Click on to add stock symbol to your watchlist and to view watchlist. |
12Stocks.com List of ETFs that track Financial Index
| Ticker | ETF Name | Watchlist | Recent Price | Smart Investing & Trading Score | Change % | Week % | Year-to-date % |
| XLF | Financial | | 51.70 | 33 | -0.4 | 0.58 | 7.36% |
| IAI | Broker-Dealers & Secs | | 173.45 | 53 | -0.87 | 1.45 | 20.77% |
| KBE | Bank | | 56.27 | 51 | 0.52 | 1.83 | 2.16% |
| FAS | Financial Bull 3X | | 159.77 | 33 | -1.27 | 1.61 | 6.12% |
| FAZ | Financial Bear 3X | | 4.60 | 62 | 1.32 | -1.5 | -26.44% |
| UYG | Financials | | 92.14 | 26 | -0.79 | 0.92 | 8.14% |
| KIE | Insurance | | 56.82 | 35 | 0.71 | 1.99 | 1.03% |
| 12Stocks.com: Charts, Trends, Fundamental Data and Performances of Financial Stocks | |
|
We now take in-depth look at all Financial stocks including charts, multi-period performances and overall trends (as measured by Smart Investing & Trading Score). One can sort Financial stocks (click link to choose) by Daily, Weekly and by Year-to-Date performances. Also, one can sort by size of the company or by market capitalization. |
| Select Your Default Chart Type: | |||||
| |||||
| Click on stock symbol or name for detailed view. Click on to add stock symbol to your watchlist and to view watchlist. Quick View: Move mouse or cursor over "Daily" to quickly view daily Technical stock chart and over "Weekly" to view weekly Technical stock chart. | |||||

 | TRST TrustCo Bank Corp NY |
| Sector: Financials | |
| SubSector: Regional - Northeast Banks | |
| MarketCap: 543.999 Millions | |
| Recent Price: 33.21 Smart Investing & Trading Score: 41 | |
| Day Percent Change: 0.06% Day Change: 0.02 | |
| Week Change: 0.48% Year-to-date Change: 0.9% | |
| TRST Links: Profile News Message Board | |
| Charts:- Daily , Weekly | |
| Add TRST to Watchlist: View: Get Complete TRST Trend Analysis ➞ | |
 | TCBI Texas Capital Bancshares, Inc. |
| Sector: Financials | |
| SubSector: Regional - Southwest Banks | |
| MarketCap: 1202.75 Millions | |
| Recent Price: 81.34 Smart Investing & Trading Score: 41 | |
| Day Percent Change: 0.04% Day Change: 0.03 | |
| Week Change: 0.52% Year-to-date Change: 4.0% | |
| TCBI Links: Profile News Message Board | |
| Charts:- Daily , Weekly | |
| Add TCBI to Watchlist: View: Get Complete TCBI Trend Analysis ➞ | |
 | GDOT Green Dot Corporation |
| Sector: Financials | |
| SubSector: Credit Services | |
| MarketCap: 1320.08 Millions | |
| Recent Price: 9.79 Smart Investing & Trading Score: 41 | |
| Day Percent Change: -1.81% Day Change: -0.18 | |
| Week Change: -0.91% Year-to-date Change: -8.0% | |
| GDOT Links: Profile News Message Board | |
| Charts:- Daily , Weekly | |
| Add GDOT to Watchlist: View: Get Complete GDOT Trend Analysis ➞ | |
 | TMP Tompkins Financial Corporation |
| Sector: Financials | |
| SubSector: Regional - Northeast Banks | |
| MarketCap: 1144.79 Millions | |
| Recent Price: 63.32 Smart Investing & Trading Score: 40 | |
| Day Percent Change: -0.3% Day Change: -0.19 | |
| Week Change: 0.83% Year-to-date Change: -5.8% | |
| TMP Links: Profile News Message Board | |
| Charts:- Daily , Weekly | |
| Add TMP to Watchlist: View: Get Complete TMP Trend Analysis ➞ | |
 | FR First Industrial Realty Trust, Inc. |
| Sector: Financials | |
| SubSector: REIT - Industrial | |
| MarketCap: 3883.39 Millions | |
| Recent Price: 48.75 Smart Investing & Trading Score: 40 | |
| Day Percent Change: 1.23% Day Change: 0.59 | |
| Week Change: 1.82% Year-to-date Change: -1.9% | |
| FR Links: Profile News Message Board | |
| Charts:- Daily , Weekly | |
| Add FR to Watchlist: View: Get Complete FR Trend Analysis ➞ | |
 | NMIH NMI Holdings, Inc. |
| Sector: Financials | |
| SubSector: Surety & Title Insurance | |
| MarketCap: 816.018 Millions | |
| Recent Price: 37.85 Smart Investing & Trading Score: 40 | |
| Day Percent Change: 0.66% Day Change: 0.25 | |
| Week Change: 1.77% Year-to-date Change: 3.0% | |
| NMIH Links: Profile News Message Board | |
| Charts:- Daily , Weekly | |
| Add NMIH to Watchlist: View: Get Complete NMIH Trend Analysis ➞ | |
 | MKTX MarketAxess Holdings Inc. |
| Sector: Financials | |
| SubSector: Investment Brokerage - National | |
| MarketCap: 12431.5 Millions | |
| Recent Price: 207.81 Smart Investing & Trading Score: 40 | |
| Day Percent Change: -0.77% Day Change: -1.62 | |
| Week Change: 0.03% Year-to-date Change: -7.7% | |
| MKTX Links: Profile News Message Board | |
| Charts:- Daily , Weekly | |
| Add MKTX to Watchlist: View: Get Complete MKTX Trend Analysis ➞ | |
 | FPI Farmland Partners Inc. |
| Sector: Financials | |
| SubSector: REIT - Diversified | |
| MarketCap: 182.653 Millions | |
| Recent Price: 10.86 Smart Investing & Trading Score: 39 | |
| Day Percent Change: 1.02% Day Change: 0.11 | |
| Week Change: 2.36% Year-to-date Change: -6.7% | |
| FPI Links: Profile News Message Board | |
| Charts:- Daily , Weekly | |
| Add FPI to Watchlist: View: Get Complete FPI Trend Analysis ➞ | |
 | NBN Northeast Bank |
| Sector: Financials | |
| SubSector: Regional - Northeast Banks | |
| MarketCap: 114.199 Millions | |
| Recent Price: 95.69 Smart Investing & Trading Score: 39 | |
| Day Percent Change: 1.78% Day Change: 1.67 | |
| Week Change: 2.89% Year-to-date Change: 4.3% | |
| NBN Links: Profile News Message Board | |
| Charts:- Daily , Weekly | |
| Add NBN to Watchlist: View: Get Complete NBN Trend Analysis ➞ | |
 | BHLB Berkshire Hills Bancorp, Inc. |
| Sector: Financials | |
| SubSector: Savings & Loans | |
| MarketCap: 686.33 Millions | |
| Recent Price: 24.73 Smart Investing & Trading Score: 38 | |
| Day Percent Change: 0.77% Day Change: 0.19 | |
| Week Change: 1.6% Year-to-date Change: -12.5% | |
| BHLB Links: Profile News Message Board | |
| Charts:- Daily , Weekly | |
| Add BHLB to Watchlist: View: Get Complete BHLB Trend Analysis ➞ | |
 | AFG American Financial Group, Inc. |
| Sector: Financials | |
| SubSector: Property & Casualty Insurance | |
| MarketCap: 5353.82 Millions | |
| Recent Price: 124.32 Smart Investing & Trading Score: 38 | |
| Day Percent Change: 0.58% Day Change: 0.72 | |
| Week Change: 1.55% Year-to-date Change: -6.6% | |
| AFG Links: Profile News Message Board | |
| Charts:- Daily , Weekly | |
| Add AFG to Watchlist: View: Get Complete AFG Trend Analysis ➞ | |
 | BRKL Brookline Bancorp, Inc. |
| Sector: Financials | |
| SubSector: Savings & Loans | |
| MarketCap: 894.43 Millions | |
| Recent Price: 10.36 Smart Investing & Trading Score: 38 | |
| Day Percent Change: 0.39% Day Change: 0.04 | |
| Week Change: 1.67% Year-to-date Change: -11.2% | |
| BRKL Links: Profile News Message Board | |
| Charts:- Daily , Weekly | |
| Add BRKL to Watchlist: View: Get Complete BRKL Trend Analysis ➞ | |
 | STBA S&T Bancorp, Inc. |
| Sector: Financials | |
| SubSector: Regional - Northeast Banks | |
| MarketCap: 1136.99 Millions | |
| Recent Price: 36.48 Smart Investing & Trading Score: 38 | |
| Day Percent Change: 0.36% Day Change: 0.13 | |
| Week Change: 2.1% Year-to-date Change: -3.7% | |
| STBA Links: Profile News Message Board | |
| Charts:- Daily , Weekly | |
| Add STBA to Watchlist: View: Get Complete STBA Trend Analysis ➞ | |
 | WABC Westamerica Bancorporation |
| Sector: Financials | |
| SubSector: Regional - Pacific Banks | |
| MarketCap: 1557.69 Millions | |
| Recent Price: 47.87 Smart Investing & Trading Score: 38 | |
| Day Percent Change: 0.21% Day Change: 0.1 | |
| Week Change: 1.16% Year-to-date Change: -8.0% | |
| WABC Links: Profile News Message Board | |
| Charts:- Daily , Weekly | |
| Add WABC to Watchlist: View: Get Complete WABC Trend Analysis ➞ | |
 | RBCAA Republic Bancorp, Inc. |
| Sector: Financials | |
| SubSector: Regional - Southeast Banks | |
| MarketCap: 671.835 Millions | |
| Recent Price: 68.64 Smart Investing & Trading Score: 38 | |
| Day Percent Change: 0.01% Day Change: 0.01 | |
| Week Change: 1.69% Year-to-date Change: -1.1% | |
| RBCAA Links: Profile News Message Board | |
| Charts:- Daily , Weekly | |
| Add RBCAA to Watchlist: View: Get Complete RBCAA Trend Analysis ➞ | |
 | HTBK Heritage Commerce Corp |
| Sector: Financials | |
| SubSector: Regional - Pacific Banks | |
| MarketCap: 416.129 Millions | |
| Recent Price: 9.32 Smart Investing & Trading Score: 38 | |
| Day Percent Change: -0.75% Day Change: -0.07 | |
| Week Change: 0.76% Year-to-date Change: 0.7% | |
| HTBK Links: Profile News Message Board | |
| Charts:- Daily , Weekly | |
| Add HTBK to Watchlist: View: Get Complete HTBK Trend Analysis ➞ | |
 | FMAO Farmers & Merchants Bancorp, Inc. |
| Sector: Financials | |
| SubSector: Regional - Midwest Banks | |
| MarketCap: 280.27 Millions | |
| Recent Price: 23.94 Smart Investing & Trading Score: 38 | |
| Day Percent Change: -2.84% Day Change: -0.7 | |
| Week Change: 0.63% Year-to-date Change: -17.9% | |
| FMAO Links: Profile News Message Board | |
| Charts:- Daily , Weekly | |
| Add FMAO to Watchlist: View: Get Complete FMAO Trend Analysis ➞ | |
 | UHT Universal Health Realty Income Trust |
| Sector: Financials | |
| SubSector: REIT - Healthcare Facilities | |
| MarketCap: 1121.14 Millions | |
| Recent Price: 39.36 Smart Investing & Trading Score: 37 | |
| Day Percent Change: 0.36% Day Change: 0.14 | |
| Week Change: 1.97% Year-to-date Change: 7.7% | |
| UHT Links: Profile News Message Board | |
| Charts:- Daily , Weekly | |
| Add UHT to Watchlist: View: Get Complete UHT Trend Analysis ➞ | |
 | FBP First BanCorp. |
| Sector: Financials | |
| SubSector: Foreign Regional Banks | |
| MarketCap: 913.079 Millions | |
| Recent Price: 20.53 Smart Investing & Trading Score: 36 | |
| Day Percent Change: 0.44% Day Change: 0.09 | |
| Week Change: 1.03% Year-to-date Change: 11.4% | |
| FBP Links: Profile News Message Board | |
| Charts:- Daily , Weekly | |
| Add FBP to Watchlist: View: Get Complete FBP Trend Analysis ➞ | |
 | MBWM Mercantile Bank Corporation |
| Sector: Financials | |
| SubSector: Regional - Midwest Banks | |
| MarketCap: 372.77 Millions | |
| Recent Price: 45.04 Smart Investing & Trading Score: 36 | |
| Day Percent Change: 0.42% Day Change: 0.19 | |
| Week Change: 1.35% Year-to-date Change: 2.1% | |
| MBWM Links: Profile News Message Board | |
| Charts:- Daily , Weekly | |
| Add MBWM to Watchlist: View: Get Complete MBWM Trend Analysis ➞ | |
 | SMBC Southern Missouri Bancorp, Inc. |
| Sector: Financials | |
| SubSector: Savings & Loans | |
| MarketCap: 272.53 Millions | |
| Recent Price: 53.19 Smart Investing & Trading Score: 36 | |
| Day Percent Change: 0.34% Day Change: 0.18 | |
| Week Change: 1.37% Year-to-date Change: -6.9% | |
| SMBC Links: Profile News Message Board | |
| Charts:- Daily , Weekly | |
| Add SMBC to Watchlist: View: Get Complete SMBC Trend Analysis ➞ | |
 | SYBT Stock Yards Bancorp, Inc. |
| Sector: Financials | |
| SubSector: Regional - Southeast Banks | |
| MarketCap: 629.235 Millions | |
| Recent Price: 74.13 Smart Investing & Trading Score: 36 | |
| Day Percent Change: 0.31% Day Change: 0.23 | |
| Week Change: 0.75% Year-to-date Change: 4.0% | |
| SYBT Links: Profile News Message Board | |
| Charts:- Daily , Weekly | |
| Add SYBT to Watchlist: View: Get Complete SYBT Trend Analysis ➞ | |
 | LKFN Lakeland Financial Corporation |
| Sector: Financials | |
| SubSector: Regional - Midwest Banks | |
| MarketCap: 903.27 Millions | |
| Recent Price: 62.00 Smart Investing & Trading Score: 36 | |
| Day Percent Change: 0.26% Day Change: 0.16 | |
| Week Change: 0.65% Year-to-date Change: -8.3% | |
| LKFN Links: Profile News Message Board | |
| Charts:- Daily , Weekly | |
| Add LKFN to Watchlist: View: Get Complete LKFN Trend Analysis ➞ | |
 | MCB Metropolitan Bank Holding Corp. |
| Sector: Financials | |
| SubSector: Regional - Northeast Banks | |
| MarketCap: 212.999 Millions | |
| Recent Price: 69.28 Smart Investing & Trading Score: 36 | |
| Day Percent Change: 0.13% Day Change: 0.09 | |
| Week Change: 0.76% Year-to-date Change: 18.6% | |
| MCB Links: Profile News Message Board | |
| Charts:- Daily , Weekly | |
| Add MCB to Watchlist: View: Get Complete MCB Trend Analysis ➞ | |
 | SMBK SmartFinancial, Inc. |
| Sector: Financials | |
| SubSector: Regional - Southeast Banks | |
| MarketCap: 174.035 Millions | |
| Recent Price: 33.73 Smart Investing & Trading Score: 36 | |
| Day Percent Change: 0.06% Day Change: 0.02 | |
| Week Change: 1.41% Year-to-date Change: 8.9% | |
| SMBK Links: Profile News Message Board | |
| Charts:- Daily , Weekly | |
| Add SMBK to Watchlist: View: Get Complete SMBK Trend Analysis ➞ | |
| For tabular summary view of above stock list: Summary View ➞ 0 - 25 , 25 - 50 , 50 - 75 , 75 - 100 , 100 - 125 , 125 - 150 , 150 - 175 , 175 - 200 , 200 - 225 , 225 - 250 , 250 - 275 , 275 - 300 , 300 - 325 , 325 - 350 , 350 - 375 , 375 - 400 , 400 - 425 , 425 - 450 , 450 - 475 , 475 - 500 , 500 - 525 , 525 - 550 , 550 - 575 | ||
| Click To Change The Sort Order: By Market Cap or Company Size Performance: Year-to-date, Week and Day | |
| Select Chart Type: | ||
|
Best Stocks Today 12Stocks.com |
© 2025 12Stocks.com Terms & Conditions Privacy Contact Us
All Information Provided Only For Education And Not To Be Used For Investing or Trading. See Terms & Conditions


One More Thing ... Get Best Stocks Delivered Daily!
Never Ever Miss A Move With Our Top Ten Stocks Lists
Find Best Stocks In Any Market - Bull or Bear Market
Take A Peek At Our Top Ten Stocks Lists: Daily, Weekly, Year-to-Date & Top Trends
Find Best Stocks In Any Market - Bull or Bear Market
Take A Peek At Our Top Ten Stocks Lists: Daily, Weekly, Year-to-Date & Top Trends
Financial Stocks With Best Up Trends [0-bearish to 100-bullish]: Lemonade [100], MBIA [100], AlTi Global[100], Cushman & Wakefield[100], LGI Homes[100], Rocket [100], Tanger Factory[100], Mr. Cooper[100], CBL & Associates Properties[100], Hamilton Lane[100], Simon Property[100]
Best Financial Stocks Year-to-Date:
ESSA Bancorp[3207.77%], Easterly Government[107.23%], Mr. Cooper[97.21%], Heritage Insurance[79.01%], Root [72.94%], Industrial Logistics[70.13%], Rocket [69.21%], Diversified Healthcare[50.49%], ProAssurance [49.72%], World Acceptance[41.78%], XP [41.43%] Best Financial Stocks This Week:
Uniti [47.66%], Lemonade [31.68%], AlTi Global[24.1%], MBIA [20.54%], Industrial Logistics[14.9%], Cushman & Wakefield[12.24%], Tanger Factory[9.38%], Hippo [9.07%], Rocket [9.01%], LGI Homes[8.92%], eXp World[8.81%] Best Financial Stocks Daily:
Lemonade [29.54%], MBIA [22.5%], AlTi Global[18.05%], Cushman & Wakefield[8.69%], LGI Homes[8.6%], Rocket [6.81%], Alexander s[6.14%], Tanger Factory[5.97%], Brookfield Business[5.91%], Mr. Cooper[5.69%], B. Riley[5.38%]