
 Login Sign Up


| |||||
 |  | ||||

| 12Stocks.com Market Intelligence |
Best Financial Stocks
| In a hurry? Financial Stocks Lists: Performance Trends Table, Stock Charts
Sort Financial stocks: Daily, Weekly, Year-to-Date, Market Cap & Trends. Filter Financial stocks list by size:All Financial Large Mid-Range Small & MicroCap |
| 12Stocks.com Financial Stocks Performances & Trends Daily | |||||||||
|
|  The overall Smart Investing & Trading Score is 33 (0-bearish to 100-bullish) which puts Financial sector in short term bearish to neutral trend. The Smart Investing & Trading Score from previous trading session is 26 and hence an improvement of trend.
| ||||||||
Here are the Smart Investing & Trading Scores of the most requested Financial stocks at 12Stocks.com (click stock name for detailed review):
|


| 12Stocks.com: Investing in Financial sector with Stocks | |
|
The following table helps investors and traders sort through current performance and trends (as measured by Smart Investing & Trading Score) of various
stocks in the Financial sector. Quick View: Move mouse or cursor over stock symbol (ticker) to view short-term Technical chart and over stock name to view long term chart. Click on  to add stock symbol to your watchlist and to add stock symbol to your watchlist and  to view watchlist. Click on any ticker or stock name for detailed market intelligence report for that stock. to view watchlist. Click on any ticker or stock name for detailed market intelligence report for that stock. |
12Stocks.com Performance of Stocks in Financial Sector
| Ticker | Stock Name | Watchlist | Category | Recent Price | Trend Score | Change % | YTD Change% |
| AIG | American |   | Insurance | 78.29 | 32 | 1.68% | 8.06% |
| CTO | Consolidated-Tomoka Land | | Real Estatet | 16.66 | 32 | 1.34% | -13.74% |
| LTC | LTC Properties | | REIT | 34.74 | 32 | 1.31% | 2.77% |
| MKTX | MarketAxess | | Brokerage | 209.43 | 32 | 0.81% | -6.98% |
| TCBI | Texas Capital | | Regional - Southwest Banks | 81.31 | 31 | 0.48% | 3.98% |
| OMF | OneMain | | Credit Services | 55.84 | 31 | -1.15% | 9.12% |
| AFG | American | | Insurance | 123.60 | 31 | 0.96% | -7.15% |
| ATLC | Atlanticus | | Credit Services | 48.93 | 30 | 1.90% | -12.28% |
| RBCAA | Republic Bancorp | | Regional Banks | 68.63 | 30 | 1.67% | -1.09% |
| BHB | Bar Harbor | | Regional Banks | 29.00 | 30 | 1.26% | -4.31% |
| WABC | Westamerica Ban | | Regional Banks | 47.77 | 30 | 0.95% | -8.16% |
| AMP | Ameriprise | | Asset Mgmt | 506.28 | 30 | 0.95% | -4.65% |
| SYBT | Stock Yards | | Regional Banks | 73.90 | 30 | 0.43% | 3.67% |
| BRT | BRT Apartments | | Mortgage | 14.94 | 28 | 2.89% | -15.97% |
| SIGI | Selective Insurance | | Insurance | 79.09 | 28 | 2.09% | -15.04% |
| KMPR | Kemper | | Insurance | 60.91 | 28 | 1.42% | -7.89% |
| SAFT | Safety Insurance | | Insurance | 70.04 | 28 | 1.07% | -13.98% |
| HCI | HCI | | Insurance | 139.49 | 28 | 0.45% | 20.11% |
| PGR | Progressive | | Insurance | 241.58 | 28 | 0.20% | 2.87% |
| WTM | White Mountains | | Insurance | 1774.50 | 28 | -0.02% | -8.72% |
| REFI | Chicago Atlantic | | REIT - Mortgage | 13.08 | 27 | 1.40% | -12.49% |
| SLQT | SelectQuote | | Insurance | 1.76 | 27 | 1.15% | -52.69% |
| ESRT | Empire State | | REIT - | 7.22 | 27 | 0.98% | -29.73% |
| CHCT | Community Healthcare | | REIT | 15.47 | 27 | 0.85% | -17.41% |
| FCPT | Four Corners | | REIT | 25.68 | 27 | 0.75% | -4.19% |
| For chart view version of above stock list: Chart View ➞ 0 - 25 , 25 - 50 , 50 - 75 , 75 - 100 , 100 - 125 , 125 - 150 , 150 - 175 , 175 - 200 , 200 - 225 , 225 - 250 , 250 - 275 , 275 - 300 , 300 - 325 , 325 - 350 , 350 - 375 , 375 - 400 , 400 - 425 , 425 - 450 , 450 - 475 , 475 - 500 , 500 - 525 , 525 - 550 , 550 - 575 | ||
 | Click To Change The Sort Order: By Market Cap or Company Size Performance: Year-to-date, Week and Day |  |
|
Get the most comprehensive stock market coverage daily at 12Stocks.com ➞ Best Stocks Today ➞ Best Stocks Weekly ➞ Best Stocks Year-to-Date ➞ Best Stocks Trends ➞  Best Stocks Today 12Stocks.com Best Nasdaq Stocks ➞ Best S&P 500 Stocks ➞ Best Tech Stocks ➞ Best Biotech Stocks ➞ |
| Detailed Overview of Financial Stocks |
| Financial Technical Overview, Leaders & Laggards, Top Financial ETF Funds & Detailed Financial Stocks List, Charts, Trends & More |
| Financial Sector: Technical Analysis, Trends & YTD Performance | |
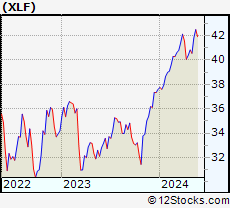
| Financial sector is composed of stocks
from banks, brokers, insurance, REITs
and services subsectors. Financial sector, as represented by XLF, an exchange-traded fund [ETF] that holds basket of Financial stocks (e.g, Bank of America, Goldman Sachs) is up by 7.8% and is currently outperforming the overall market by 0.27% year-to-date. Below is a quick view of Technical charts and trends: |
|
 XLF Weekly Chart |
|
| Long Term Trend: Good | |
| Medium Term Trend: Not Good | |
 XLF Daily Chart |
|
| Short Term Trend: Not Good | |
| Overall Trend Score: 33 | |
| YTD Performance: 7.8% | |
| **Trend Scores & Views Are Only For Educational Purposes And Not For Investing | |
| 12Stocks.com: Top Performing Financial Sector Stocks | ||||||||||||||||||||||||||||||||||||||||||||||||
 The top performing Financial sector stocks year to date are
Now, more recently, over last week, the top performing Financial sector stocks on the move are


|
||||||||||||||||||||||||||||||||||||||||||||||||
| 12Stocks.com: Investing in Financial Sector using Exchange Traded Funds | |
|
The following table shows list of key exchange traded funds (ETF) that
help investors track Financial Index. For detailed view, check out our ETF Funds section of our website. Quick View: Move mouse or cursor over ETF symbol (ticker) to view short-term Technical chart and over ETF name to view long term chart. Click on ticker or stock name for detailed view. Click on to add stock symbol to your watchlist and to view watchlist. |
12Stocks.com List of ETFs that track Financial Index
| Ticker | ETF Name | Watchlist | Recent Price | Smart Investing & Trading Score | Change % | Week % | Year-to-date % |
| XLF | Financial | | 51.91 | 33 | 0.99 | 0.99 | 7.8% |
| IAI | Broker-Dealers & Secs | | 174.97 | 63 | 2.34 | 2.34 | 21.82% |
| KBE | Bank | | 55.98 | 43 | 1.3 | 1.3 | 1.64% |
| FAS | Financial Bull 3X | | 161.82 | 33 | 2.91 | 2.91 | 7.48% |
| FAZ | Financial Bear 3X | | 4.54 | 62 | -2.78 | -2.78 | -27.4% |
| UYG | Financials | | 92.87 | 26 | 1.72 | 1.72 | 9% |
| KIE | Insurance | | 56.42 | 25 | 1.27 | 1.27 | 0.32% |
| 12Stocks.com: Charts, Trends, Fundamental Data and Performances of Financial Stocks | |
|
We now take in-depth look at all Financial stocks including charts, multi-period performances and overall trends (as measured by Smart Investing & Trading Score). One can sort Financial stocks (click link to choose) by Daily, Weekly and by Year-to-Date performances. Also, one can sort by size of the company or by market capitalization. |
| Select Your Default Chart Type: | |||||
| |||||
| Click on stock symbol or name for detailed view. Click on to add stock symbol to your watchlist and to view watchlist. Quick View: Move mouse or cursor over "Daily" to quickly view daily Technical stock chart and over "Weekly" to view weekly Technical stock chart. | |||||

 | AIG American International Group, Inc. |
| Sector: Financials | |
| SubSector: Property & Casualty Insurance | |
| MarketCap: 21219 Millions | |
| Recent Price: 78.29 Smart Investing & Trading Score: 32 | |
| Day Percent Change: 1.68% Day Change: 1.29 | |
| Week Change: 1.68% Year-to-date Change: 8.1% | |
| AIG Links: Profile News Message Board | |
| Charts:- Daily , Weekly | |
| Add AIG to Watchlist: View: Get Complete AIG Trend Analysis ➞ | |
 | CTO Consolidated-Tomoka Land Co. |
| Sector: Financials | |
| SubSector: Real Estate Development | |
| MarketCap: 205.119 Millions | |
| Recent Price: 16.66 Smart Investing & Trading Score: 32 | |
| Day Percent Change: 1.34% Day Change: 0.22 | |
| Week Change: 1.34% Year-to-date Change: -13.7% | |
| CTO Links: Profile News Message Board | |
| Charts:- Daily , Weekly | |
| Add CTO to Watchlist: View: Get Complete CTO Trend Analysis ➞ | |
 | LTC LTC Properties, Inc. |
| Sector: Financials | |
| SubSector: REIT - Healthcare Facilities | |
| MarketCap: 1369.24 Millions | |
| Recent Price: 34.74 Smart Investing & Trading Score: 32 | |
| Day Percent Change: 1.31% Day Change: 0.45 | |
| Week Change: 1.31% Year-to-date Change: 2.8% | |
| LTC Links: Profile News Message Board | |
| Charts:- Daily , Weekly | |
| Add LTC to Watchlist: View: Get Complete LTC Trend Analysis ➞ | |
 | MKTX MarketAxess Holdings Inc. |
| Sector: Financials | |
| SubSector: Investment Brokerage - National | |
| MarketCap: 12431.5 Millions | |
| Recent Price: 209.43 Smart Investing & Trading Score: 32 | |
| Day Percent Change: 0.81% Day Change: 1.68 | |
| Week Change: 0.81% Year-to-date Change: -7.0% | |
| MKTX Links: Profile News Message Board | |
| Charts:- Daily , Weekly | |
| Add MKTX to Watchlist: View: Get Complete MKTX Trend Analysis ➞ | |
 | TCBI Texas Capital Bancshares, Inc. |
| Sector: Financials | |
| SubSector: Regional - Southwest Banks | |
| MarketCap: 1202.75 Millions | |
| Recent Price: 81.31 Smart Investing & Trading Score: 31 | |
| Day Percent Change: 0.48% Day Change: 0.39 | |
| Week Change: 0.48% Year-to-date Change: 4.0% | |
| TCBI Links: Profile News Message Board | |
| Charts:- Daily , Weekly | |
| Add TCBI to Watchlist: View: Get Complete TCBI Trend Analysis ➞ | |
 | OMF OneMain Holdings, Inc. |
| Sector: Financials | |
| SubSector: Credit Services | |
| MarketCap: 2753.38 Millions | |
| Recent Price: 55.84 Smart Investing & Trading Score: 31 | |
| Day Percent Change: -1.15% Day Change: -0.65 | |
| Week Change: -1.15% Year-to-date Change: 9.1% | |
| OMF Links: Profile News Message Board | |
| Charts:- Daily , Weekly | |
| Add OMF to Watchlist: View: Get Complete OMF Trend Analysis ➞ | |
 | AFG American Financial Group, Inc. |
| Sector: Financials | |
| SubSector: Property & Casualty Insurance | |
| MarketCap: 5353.82 Millions | |
| Recent Price: 123.60 Smart Investing & Trading Score: 31 | |
| Day Percent Change: 0.96% Day Change: 1.18 | |
| Week Change: 0.96% Year-to-date Change: -7.2% | |
| AFG Links: Profile News Message Board | |
| Charts:- Daily , Weekly | |
| Add AFG to Watchlist: View: Get Complete AFG Trend Analysis ➞ | |
 | ATLC Atlanticus Holdings Corporation |
| Sector: Financials | |
| SubSector: Credit Services | |
| MarketCap: 122.008 Millions | |
| Recent Price: 48.93 Smart Investing & Trading Score: 30 | |
| Day Percent Change: 1.9% Day Change: 0.91 | |
| Week Change: 1.9% Year-to-date Change: -12.3% | |
| ATLC Links: Profile News Message Board | |
| Charts:- Daily , Weekly | |
| Add ATLC to Watchlist: View: Get Complete ATLC Trend Analysis ➞ | |
 | RBCAA Republic Bancorp, Inc. |
| Sector: Financials | |
| SubSector: Regional - Southeast Banks | |
| MarketCap: 671.835 Millions | |
| Recent Price: 68.63 Smart Investing & Trading Score: 30 | |
| Day Percent Change: 1.67% Day Change: 1.13 | |
| Week Change: 1.67% Year-to-date Change: -1.1% | |
| RBCAA Links: Profile News Message Board | |
| Charts:- Daily , Weekly | |
| Add RBCAA to Watchlist: View: Get Complete RBCAA Trend Analysis ➞ | |
 | BHB Bar Harbor Bankshares |
| Sector: Financials | |
| SubSector: Regional - Northeast Banks | |
| MarketCap: 298.099 Millions | |
| Recent Price: 29.00 Smart Investing & Trading Score: 30 | |
| Day Percent Change: 1.26% Day Change: 0.36 | |
| Week Change: 1.26% Year-to-date Change: -4.3% | |
| BHB Links: Profile News Message Board | |
| Charts:- Daily , Weekly | |
| Add BHB to Watchlist: View: Get Complete BHB Trend Analysis ➞ | |
 | WABC Westamerica Bancorporation |
| Sector: Financials | |
| SubSector: Regional - Pacific Banks | |
| MarketCap: 1557.69 Millions | |
| Recent Price: 47.77 Smart Investing & Trading Score: 30 | |
| Day Percent Change: 0.95% Day Change: 0.45 | |
| Week Change: 0.95% Year-to-date Change: -8.2% | |
| WABC Links: Profile News Message Board | |
| Charts:- Daily , Weekly | |
| Add WABC to Watchlist: View: Get Complete WABC Trend Analysis ➞ | |
 | AMP Ameriprise Financial, Inc. |
| Sector: Financials | |
| SubSector: Asset Management | |
| MarketCap: 13270.5 Millions | |
| Recent Price: 506.28 Smart Investing & Trading Score: 30 | |
| Day Percent Change: 0.95% Day Change: 4.76 | |
| Week Change: 0.95% Year-to-date Change: -4.7% | |
| AMP Links: Profile News Message Board | |
| Charts:- Daily , Weekly | |
| Add AMP to Watchlist: View: Get Complete AMP Trend Analysis ➞ | |
 | SYBT Stock Yards Bancorp, Inc. |
| Sector: Financials | |
| SubSector: Regional - Southeast Banks | |
| MarketCap: 629.235 Millions | |
| Recent Price: 73.90 Smart Investing & Trading Score: 30 | |
| Day Percent Change: 0.43% Day Change: 0.32 | |
| Week Change: 0.43% Year-to-date Change: 3.7% | |
| SYBT Links: Profile News Message Board | |
| Charts:- Daily , Weekly | |
| Add SYBT to Watchlist: View: Get Complete SYBT Trend Analysis ➞ | |
 | BRT BRT Apartments Corp. |
| Sector: Financials | |
| SubSector: Mortgage Investment | |
| MarketCap: 163.239 Millions | |
| Recent Price: 14.94 Smart Investing & Trading Score: 28 | |
| Day Percent Change: 2.89% Day Change: 0.42 | |
| Week Change: 2.89% Year-to-date Change: -16.0% | |
| BRT Links: Profile News Message Board | |
| Charts:- Daily , Weekly | |
| Add BRT to Watchlist: View: Get Complete BRT Trend Analysis ➞ | |
 | SIGI Selective Insurance Group, Inc. |
| Sector: Financials | |
| SubSector: Property & Casualty Insurance | |
| MarketCap: 3039.12 Millions | |
| Recent Price: 79.09 Smart Investing & Trading Score: 28 | |
| Day Percent Change: 2.09% Day Change: 1.62 | |
| Week Change: 2.09% Year-to-date Change: -15.0% | |
| SIGI Links: Profile News Message Board | |
| Charts:- Daily , Weekly | |
| Add SIGI to Watchlist: View: Get Complete SIGI Trend Analysis ➞ | |
 | KMPR Kemper Corporation |
| Sector: Financials | |
| SubSector: Property & Casualty Insurance | |
| MarketCap: 4035.12 Millions | |
| Recent Price: 60.91 Smart Investing & Trading Score: 28 | |
| Day Percent Change: 1.42% Day Change: 0.85 | |
| Week Change: 1.42% Year-to-date Change: -7.9% | |
| KMPR Links: Profile News Message Board | |
| Charts:- Daily , Weekly | |
| Add KMPR to Watchlist: View: Get Complete KMPR Trend Analysis ➞ | |
 | SAFT Safety Insurance Group, Inc. |
| Sector: Financials | |
| SubSector: Property & Casualty Insurance | |
| MarketCap: 1145.12 Millions | |
| Recent Price: 70.04 Smart Investing & Trading Score: 28 | |
| Day Percent Change: 1.07% Day Change: 0.74 | |
| Week Change: 1.07% Year-to-date Change: -14.0% | |
| SAFT Links: Profile News Message Board | |
| Charts:- Daily , Weekly | |
| Add SAFT to Watchlist: View: Get Complete SAFT Trend Analysis ➞ | |
 | HCI HCI Group, Inc. |
| Sector: Financials | |
| SubSector: Property & Casualty Insurance | |
| MarketCap: 297.412 Millions | |
| Recent Price: 139.49 Smart Investing & Trading Score: 28 | |
| Day Percent Change: 0.45% Day Change: 0.63 | |
| Week Change: 0.45% Year-to-date Change: 20.1% | |
| HCI Links: Profile News Message Board | |
| Charts:- Daily , Weekly | |
| Add HCI to Watchlist: View: Get Complete HCI Trend Analysis ➞ | |
 | PGR The Progressive Corporation |
| Sector: Financials | |
| SubSector: Property & Casualty Insurance | |
| MarketCap: 43112 Millions | |
| Recent Price: 241.58 Smart Investing & Trading Score: 28 | |
| Day Percent Change: 0.2% Day Change: 0.49 | |
| Week Change: 0.2% Year-to-date Change: 2.9% | |
| PGR Links: Profile News Message Board | |
| Charts:- Daily , Weekly | |
| Add PGR to Watchlist: View: Get Complete PGR Trend Analysis ➞ | |
 | WTM White Mountains Insurance Group, Ltd. |
| Sector: Financials | |
| SubSector: Property & Casualty Insurance | |
| MarketCap: 2502.62 Millions | |
| Recent Price: 1774.50 Smart Investing & Trading Score: 28 | |
| Day Percent Change: -0.02% Day Change: -0.37 | |
| Week Change: -0.02% Year-to-date Change: -8.7% | |
| WTM Links: Profile News Message Board | |
| Charts:- Daily , Weekly | |
| Add WTM to Watchlist: View: Get Complete WTM Trend Analysis ➞ | |
 | REFI Chicago Atlantic Financials Finance, Inc. |
| Sector: Financials | |
| SubSector: REIT - Mortgage | |
| MarketCap: 285 Millions | |
| Recent Price: 13.08 Smart Investing & Trading Score: 27 | |
| Day Percent Change: 1.4% Day Change: 0.18 | |
| Week Change: 1.4% Year-to-date Change: -12.5% | |
| REFI Links: Profile News Message Board | |
| Charts:- Daily , Weekly | |
| Add REFI to Watchlist: View: Get Complete REFI Trend Analysis ➞ | |
 | SLQT SelectQuote, Inc. |
| Sector: Financials | |
| SubSector: Insurance Brokers | |
| MarketCap: 38257 Millions | |
| Recent Price: 1.76 Smart Investing & Trading Score: 27 | |
| Day Percent Change: 1.15% Day Change: 0.02 | |
| Week Change: 1.15% Year-to-date Change: -52.7% | |
| SLQT Links: Profile News Message Board | |
| Charts:- Daily , Weekly | |
| Add SLQT to Watchlist: View: Get Complete SLQT Trend Analysis ➞ | |
 | ESRT Empire State Realty Trust, Inc. |
| Sector: Financials | |
| SubSector: REIT - Diversified | |
| MarketCap: 1632.13 Millions | |
| Recent Price: 7.22 Smart Investing & Trading Score: 27 | |
| Day Percent Change: 0.98% Day Change: 0.07 | |
| Week Change: 0.98% Year-to-date Change: -29.7% | |
| ESRT Links: Profile News Message Board | |
| Charts:- Daily , Weekly | |
| Add ESRT to Watchlist: View: Get Complete ESRT Trend Analysis ➞ | |
 | CHCT Community Healthcare Trust Incorporated |
| Sector: Financials | |
| SubSector: REIT - Healthcare Facilities | |
| MarketCap: 698.614 Millions | |
| Recent Price: 15.47 Smart Investing & Trading Score: 27 | |
| Day Percent Change: 0.85% Day Change: 0.13 | |
| Week Change: 0.85% Year-to-date Change: -17.4% | |
| CHCT Links: Profile News Message Board | |
| Charts:- Daily , Weekly | |
| Add CHCT to Watchlist: View: Get Complete CHCT Trend Analysis ➞ | |
 | FCPT Four Corners Property Trust, Inc. |
| Sector: Financials | |
| SubSector: REIT - Hotel/Motel | |
| MarketCap: 1218.94 Millions | |
| Recent Price: 25.68 Smart Investing & Trading Score: 27 | |
| Day Percent Change: 0.75% Day Change: 0.19 | |
| Week Change: 0.75% Year-to-date Change: -4.2% | |
| FCPT Links: Profile News Message Board | |
| Charts:- Daily , Weekly | |
| Add FCPT to Watchlist: View: Get Complete FCPT Trend Analysis ➞ | |
| For tabular summary view of above stock list: Summary View ➞ 0 - 25 , 25 - 50 , 50 - 75 , 75 - 100 , 100 - 125 , 125 - 150 , 150 - 175 , 175 - 200 , 200 - 225 , 225 - 250 , 250 - 275 , 275 - 300 , 300 - 325 , 325 - 350 , 350 - 375 , 375 - 400 , 400 - 425 , 425 - 450 , 450 - 475 , 475 - 500 , 500 - 525 , 525 - 550 , 550 - 575 | ||
| Click To Change The Sort Order: By Market Cap or Company Size Performance: Year-to-date, Week and Day | |
| Select Chart Type: | ||
|
Best Stocks Today 12Stocks.com |
© 2025 12Stocks.com Terms & Conditions Privacy Contact Us
All Information Provided Only For Education And Not To Be Used For Investing or Trading. See Terms & Conditions


One More Thing ... Get Best Stocks Delivered Daily!
Never Ever Miss A Move With Our Top Ten Stocks Lists
Find Best Stocks In Any Market - Bull or Bear Market
Take A Peek At Our Top Ten Stocks Lists: Daily, Weekly, Year-to-Date & Top Trends
Find Best Stocks In Any Market - Bull or Bear Market
Take A Peek At Our Top Ten Stocks Lists: Daily, Weekly, Year-to-Date & Top Trends
Financial Stocks With Best Up Trends [0-bearish to 100-bullish]: Uniti [100], LendingTree [100], Mercury General[100], Perella Weinberg[100], Broadstone Net[100], LendingClub [100], TPG RE[100], CareTrust REIT[100], Stewart Information[100], Healthcare Realty[100], VICI Properties[100]
Best Financial Stocks Year-to-Date:
ESSA Bancorp[3207.77%], Easterly Government[108.45%], Mr. Cooper[86.58%], Heritage Insurance[75.29%], Root [65.29%], Industrial Logistics[64.89%], Rocket [58.42%], Diversified Healthcare[49.61%], ProAssurance [49.59%], Uniti [47.09%], SoFi Technologies[41.62%] Best Financial Stocks This Week:
Uniti [64.77%], Industrial Logistics[11.36%], LendingTree [7.32%], eXp World[7.27%], EverQuote [6.89%], Camping World[6.84%], First Foundation[6.69%], Diamond Hill[5.46%], Mercury General[5.36%], Cipher Mining[5.27%], AlTi Global[5.13%] Best Financial Stocks Daily:
Uniti [64.77%], Industrial Logistics[11.36%], LendingTree [7.32%], eXp World[7.27%], EverQuote [6.89%], Camping World[6.84%], First Foundation[6.69%], Diamond Hill[5.46%], Mercury General[5.36%], Cipher Mining[5.27%], AlTi Global[5.13%]