
 Login Sign Up


| |||||
 |  | ||||

| 12Stocks.com Market Intelligence |
Best Financial Stocks
| In a hurry? Financial Stocks Lists: Performance Trends Table, Stock Charts
Sort Financial stocks: Daily, Weekly, Year-to-Date, Market Cap & Trends. Filter Financial stocks list by size:All Financial Large Mid-Range Small & MicroCap |
| 12Stocks.com Financial Stocks Performances & Trends Daily | |||||||||
|
|  The overall Smart Investing & Trading Score is 33 (0-bearish to 100-bullish) which puts Financial sector in short term bearish to neutral trend. The Smart Investing & Trading Score from previous trading session is 26 and an improvement of trend continues.
| ||||||||
Here are the Smart Investing & Trading Scores of the most requested Financial stocks at 12Stocks.com (click stock name for detailed review):
|


| 12Stocks.com: Investing in Financial sector with Stocks | |
|
The following table helps investors and traders sort through current performance and trends (as measured by Smart Investing & Trading Score) of various
stocks in the Financial sector. Quick View: Move mouse or cursor over stock symbol (ticker) to view short-term Technical chart and over stock name to view long term chart. Click on  to add stock symbol to your watchlist and to add stock symbol to your watchlist and  to view watchlist. Click on any ticker or stock name for detailed market intelligence report for that stock. to view watchlist. Click on any ticker or stock name for detailed market intelligence report for that stock. |
12Stocks.com Performance of Stocks in Financial Sector
| Ticker | Stock Name | Watchlist | Category | Recent Price | Trend Score | Change % | YTD Change% |
| MPW | Medical Properties |   | REIT | 4.18 | 64 | 3.47% | 7.25% |
| ITIC | Investors Title | | Insurance | 218.30 | 64 | 1.26% | -7.62% |
| ALL | Allstate | | Insurance | 205.55 | 64 | 1.24% | 7.15% |
| HIG | Hartford | | Insurance | 127.57 | 64 | 1.08% | 17.12% |
| AON | Aon | | Insurance | 361.60 | 64 | 0.33% | 0.86% |
| EPRT | Essential Properties | | REIT - | 30.75 | 64 | -0.29% | -0.80% |
| WRB | W. R. | | Insurance | 70.06 | 64 | -0.60% | 19.87% |
| CME | CME | | Brokerage | 284.61 | 64 | -0.87% | 23.16% |
| BBUC | Brookfield Business | | Asset Mgmt | 30.83 | 63 | 5.91% | 27.37% |
| RMAX | RE/MAX | | Property Mgmt | 7.80 | 63 | 3.86% | -26.90% |
| WRLD | World Acceptance | | Credit Services | 159.42 | 63 | 0.58% | 41.78% |
| INDB | Independent Bank | | Regional Banks | 64.12 | 63 | 0.25% | 0.83% |
| NNI | Nelnet | | Credit Services | 124.78 | 63 | -0.04% | 17.12% |
| JBGS | JBG SMITH | | Property Mgmt | 20.43 | 63 | -0.63% | 32.92% |
| BWFG | Bankwell | | Regional Banks | 39.60 | 63 | -0.83% | 27.94% |
| ABCB | Ameris Bancorp | | Regional Banks | 67.21 | 63 | 0.92% | 7.79% |
| CINF | Cinnati | | Insurance | 150.43 | 63 | 0.46% | 5.31% |
| DX | Dynex Capital | | Mortgage | 12.53 | 63 | -0.32% | 5.30% |
| MTAL | Metals Acquisition | | SPAC | 12.07 | 62 | 0.00% | 13.65% |
| GLPI | Gaming and | | REIT - | 46.53 | 62 | -1.17% | -1.88% |
| GOCO | GoHealth | | Insurance | 5.91 | 61 | 5.16% | -55.86% |
| STHO | Star | | Financials Services | 7.27 | 61 | 0.69% | -25.28% |
| HLI | Houlihan Lokey | | Brokerage | 192.39 | 61 | -0.39% | 11.15% |
| NYMT | New York | | Mortgage | 6.68 | 61 | -0.60% | 13.73% |
| PKBK | Parke Bancorp | | Regional Banks | 20.68 | 61 | 1.55% | 2.77% |
| For chart view version of above stock list: Chart View ➞ 0 - 25 , 25 - 50 , 50 - 75 , 75 - 100 , 100 - 125 , 125 - 150 , 150 - 175 , 175 - 200 , 200 - 225 , 225 - 250 , 250 - 275 , 275 - 300 , 300 - 325 , 325 - 350 , 350 - 375 , 375 - 400 , 400 - 425 , 425 - 450 , 450 - 475 , 475 - 500 , 500 - 525 , 525 - 550 , 550 - 575 | ||
 | Click To Change The Sort Order: By Market Cap or Company Size Performance: Year-to-date, Week and Day |  |
|
Get the most comprehensive stock market coverage daily at 12Stocks.com ➞ Best Stocks Today ➞ Best Stocks Weekly ➞ Best Stocks Year-to-Date ➞ Best Stocks Trends ➞  Best Stocks Today 12Stocks.com Best Nasdaq Stocks ➞ Best S&P 500 Stocks ➞ Best Tech Stocks ➞ Best Biotech Stocks ➞ |
| Detailed Overview of Financial Stocks |
| Financial Technical Overview, Leaders & Laggards, Top Financial ETF Funds & Detailed Financial Stocks List, Charts, Trends & More |
| Financial Sector: Technical Analysis, Trends & YTD Performance | |
| Financial sector is composed of stocks
from banks, brokers, insurance, REITs
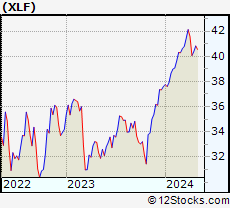
and services subsectors. Financial sector, as represented by XLF, an exchange-traded fund [ETF] that holds basket of Financial stocks (e.g, Bank of America, Goldman Sachs) is up by 7.36% and is currently outperforming the overall market by 0.31% year-to-date. Below is a quick view of Technical charts and trends: |
|
 XLF Weekly Chart |
|
| Long Term Trend: Good | |
| Medium Term Trend: Not Good | |
 XLF Daily Chart |
|
| Short Term Trend: Not Good | |
| Overall Trend Score: 33 | |
| YTD Performance: 7.36% | |
| **Trend Scores & Views Are Only For Educational Purposes And Not For Investing | |
| 12Stocks.com: Top Performing Financial Sector Stocks | ||||||||||||||||||||||||||||||||||||||||||||||||
 The top performing Financial sector stocks year to date are
Now, more recently, over last week, the top performing Financial sector stocks on the move are


|
||||||||||||||||||||||||||||||||||||||||||||||||
| 12Stocks.com: Investing in Financial Sector using Exchange Traded Funds | |
|
The following table shows list of key exchange traded funds (ETF) that
help investors track Financial Index. For detailed view, check out our ETF Funds section of our website. Quick View: Move mouse or cursor over ETF symbol (ticker) to view short-term Technical chart and over ETF name to view long term chart. Click on ticker or stock name for detailed view. Click on to add stock symbol to your watchlist and to view watchlist. |
12Stocks.com List of ETFs that track Financial Index
| Ticker | ETF Name | Watchlist | Recent Price | Smart Investing & Trading Score | Change % | Week % | Year-to-date % |
| XLF | Financial | | 51.70 | 33 | -0.4 | 0.58 | 7.36% |
| IAI | Broker-Dealers & Secs | | 173.45 | 53 | -0.87 | 1.45 | 20.77% |
| KBE | Bank | | 56.27 | 51 | 0.52 | 1.83 | 2.16% |
| FAS | Financial Bull 3X | | 159.77 | 33 | -1.27 | 1.61 | 6.12% |
| FAZ | Financial Bear 3X | | 4.60 | 62 | 1.32 | -1.5 | -26.44% |
| UYG | Financials | | 92.14 | 26 | -0.79 | 0.92 | 8.14% |
| KIE | Insurance | | 56.82 | 35 | 0.71 | 1.99 | 1.03% |
| 12Stocks.com: Charts, Trends, Fundamental Data and Performances of Financial Stocks | |
|
We now take in-depth look at all Financial stocks including charts, multi-period performances and overall trends (as measured by Smart Investing & Trading Score). One can sort Financial stocks (click link to choose) by Daily, Weekly and by Year-to-Date performances. Also, one can sort by size of the company or by market capitalization. |
| Select Your Default Chart Type: | |||||
| |||||
| Click on stock symbol or name for detailed view. Click on to add stock symbol to your watchlist and to view watchlist. Quick View: Move mouse or cursor over "Daily" to quickly view daily Technical stock chart and over "Weekly" to view weekly Technical stock chart. | |||||

 | MPW Medical Properties Trust, Inc. |
| Sector: Financials | |
| SubSector: REIT - Healthcare Facilities | |
| MarketCap: 8586.74 Millions | |
| Recent Price: 4.18 Smart Investing & Trading Score: 64 | |
| Day Percent Change: 3.47% Day Change: 0.14 | |
| Week Change: 2.96% Year-to-date Change: 7.3% | |
| MPW Links: Profile News Message Board | |
| Charts:- Daily , Weekly | |
| Add MPW to Watchlist: View: Get Complete MPW Trend Analysis ➞ | |
 | ITIC Investors Title Company |
| Sector: Financials | |
| SubSector: Surety & Title Insurance | |
| MarketCap: 219.518 Millions | |
| Recent Price: 218.30 Smart Investing & Trading Score: 64 | |
| Day Percent Change: 1.26% Day Change: 2.72 | |
| Week Change: 3.81% Year-to-date Change: -7.6% | |
| ITIC Links: Profile News Message Board | |
| Charts:- Daily , Weekly | |
| Add ITIC to Watchlist: View: Get Complete ITIC Trend Analysis ➞ | |
 | ALL The Allstate Corporation |
| Sector: Financials | |
| SubSector: Property & Casualty Insurance | |
| MarketCap: 25916.6 Millions | |
| Recent Price: 205.55 Smart Investing & Trading Score: 64 | |
| Day Percent Change: 1.24% Day Change: 2.52 | |
| Week Change: 2.89% Year-to-date Change: 7.2% | |
| ALL Links: Profile News Message Board | |
| Charts:- Daily , Weekly | |
| Add ALL to Watchlist: View: Get Complete ALL Trend Analysis ➞ | |
 | HIG The Hartford Financial Services Group, Inc. |
| Sector: Financials | |
| SubSector: Property & Casualty Insurance | |
| MarketCap: 12582.8 Millions | |
| Recent Price: 127.57 Smart Investing & Trading Score: 64 | |
| Day Percent Change: 1.08% Day Change: 1.36 | |
| Week Change: 3.72% Year-to-date Change: 17.1% | |
| HIG Links: Profile News Message Board | |
| Charts:- Daily , Weekly | |
| Add HIG to Watchlist: View: Get Complete HIG Trend Analysis ➞ | |
 | AON Aon plc |
| Sector: Financials | |
| SubSector: Insurance Brokers | |
| MarketCap: 36870.1 Millions | |
| Recent Price: 361.60 Smart Investing & Trading Score: 64 | |
| Day Percent Change: 0.33% Day Change: 1.2 | |
| Week Change: 2.3% Year-to-date Change: 0.9% | |
| AON Links: Profile News Message Board | |
| Charts:- Daily , Weekly | |
| Add AON to Watchlist: View: Get Complete AON Trend Analysis ➞ | |
 | EPRT Essential Properties Realty Trust, Inc. |
| Sector: Financials | |
| SubSector: REIT - Diversified | |
| MarketCap: 1424.43 Millions | |
| Recent Price: 30.75 Smart Investing & Trading Score: 64 | |
| Day Percent Change: -0.29% Day Change: -0.09 | |
| Week Change: 0.69% Year-to-date Change: -0.8% | |
| EPRT Links: Profile News Message Board | |
| Charts:- Daily , Weekly | |
| Add EPRT to Watchlist: View: Get Complete EPRT Trend Analysis ➞ | |
 | WRB W. R. Berkley Corporation |
| Sector: Financials | |
| SubSector: Property & Casualty Insurance | |
| MarketCap: 9863.82 Millions | |
| Recent Price: 70.06 Smart Investing & Trading Score: 64 | |
| Day Percent Change: -0.6% Day Change: -0.42 | |
| Week Change: 1.17% Year-to-date Change: 19.9% | |
| WRB Links: Profile News Message Board | |
| Charts:- Daily , Weekly | |
| Add WRB to Watchlist: View: Get Complete WRB Trend Analysis ➞ | |
 | CME CME Group Inc. |
| Sector: Financials | |
| SubSector: Investment Brokerage - National | |
| MarketCap: 64145 Millions | |
| Recent Price: 284.61 Smart Investing & Trading Score: 64 | |
| Day Percent Change: -0.87% Day Change: -2.49 | |
| Week Change: 1.37% Year-to-date Change: 23.2% | |
| CME Links: Profile News Message Board | |
| Charts:- Daily , Weekly | |
| Add CME to Watchlist: View: Get Complete CME Trend Analysis ➞ | |
 | BBUC Brookfield Business Corporation |
| Sector: Financials | |
| SubSector: Asset Management | |
| MarketCap: 1810 Millions | |
| Recent Price: 30.83 Smart Investing & Trading Score: 63 | |
| Day Percent Change: 5.91% Day Change: 1.72 | |
| Week Change: 4.9% Year-to-date Change: 27.4% | |
| BBUC Links: Profile News Message Board | |
| Charts:- Daily , Weekly | |
| Add BBUC to Watchlist: View: Get Complete BBUC Trend Analysis ➞ | |
 | RMAX RE/MAX Holdings, Inc. |
| Sector: Financials | |
| SubSector: Property Management | |
| MarketCap: 334.742 Millions | |
| Recent Price: 7.80 Smart Investing & Trading Score: 63 | |
| Day Percent Change: 3.86% Day Change: 0.29 | |
| Week Change: 3.59% Year-to-date Change: -26.9% | |
| RMAX Links: Profile News Message Board | |
| Charts:- Daily , Weekly | |
| Add RMAX to Watchlist: View: Get Complete RMAX Trend Analysis ➞ | |
 | WRLD World Acceptance Corporation |
| Sector: Financials | |
| SubSector: Credit Services | |
| MarketCap: 486.408 Millions | |
| Recent Price: 159.42 Smart Investing & Trading Score: 63 | |
| Day Percent Change: 0.58% Day Change: 0.92 | |
| Week Change: 3.28% Year-to-date Change: 41.8% | |
| WRLD Links: Profile News Message Board | |
| Charts:- Daily , Weekly | |
| Add WRLD to Watchlist: View: Get Complete WRLD Trend Analysis ➞ | |
 | INDB Independent Bank Corp. |
| Sector: Financials | |
| SubSector: Regional - Northeast Banks | |
| MarketCap: 2347.09 Millions | |
| Recent Price: 64.12 Smart Investing & Trading Score: 63 | |
| Day Percent Change: 0.25% Day Change: 0.16 | |
| Week Change: 3.32% Year-to-date Change: 0.8% | |
| INDB Links: Profile News Message Board | |
| Charts:- Daily , Weekly | |
| Add INDB to Watchlist: View: Get Complete INDB Trend Analysis ➞ | |
 | NNI Nelnet, Inc. |
| Sector: Financials | |
| SubSector: Credit Services | |
| MarketCap: 1664.38 Millions | |
| Recent Price: 124.78 Smart Investing & Trading Score: 63 | |
| Day Percent Change: -0.04% Day Change: -0.05 | |
| Week Change: 1.37% Year-to-date Change: 17.1% | |
| NNI Links: Profile News Message Board | |
| Charts:- Daily , Weekly | |
| Add NNI to Watchlist: View: Get Complete NNI Trend Analysis ➞ | |
 | JBGS JBG SMITH Properties |
| Sector: Financials | |
| SubSector: Property Management | |
| MarketCap: 4335.32 Millions | |
| Recent Price: 20.43 Smart Investing & Trading Score: 63 | |
| Day Percent Change: -0.63% Day Change: -0.13 | |
| Week Change: -2.3% Year-to-date Change: 32.9% | |
| JBGS Links: Profile News Message Board | |
| Charts:- Daily , Weekly | |
| Add JBGS to Watchlist: View: Get Complete JBGS Trend Analysis ➞ | |
 | BWFG Bankwell Financial Group, Inc. |
| Sector: Financials | |
| SubSector: Regional - Northeast Banks | |
| MarketCap: 142.899 Millions | |
| Recent Price: 39.60 Smart Investing & Trading Score: 63 | |
| Day Percent Change: -0.83% Day Change: -0.33 | |
| Week Change: 1.3% Year-to-date Change: 27.9% | |
| BWFG Links: Profile News Message Board | |
| Charts:- Daily , Weekly | |
| Add BWFG to Watchlist: View: Get Complete BWFG Trend Analysis ➞ | |
 | ABCB Ameris Bancorp |
| Sector: Financials | |
| SubSector: Regional - Mid-Atlantic Banks | |
| MarketCap: 1537.79 Millions | |
| Recent Price: 67.21 Smart Investing & Trading Score: 63 | |
| Day Percent Change: 0.92% Day Change: 0.61 | |
| Week Change: 1.97% Year-to-date Change: 7.8% | |
| ABCB Links: Profile News Message Board | |
| Charts:- Daily , Weekly | |
| Add ABCB to Watchlist: View: Get Complete ABCB Trend Analysis ➞ | |
 | CINF Cincinnati Financial Corporation |
| Sector: Financials | |
| SubSector: Property & Casualty Insurance | |
| MarketCap: 13637 Millions | |
| Recent Price: 150.43 Smart Investing & Trading Score: 63 | |
| Day Percent Change: 0.46% Day Change: 0.69 | |
| Week Change: 2.9% Year-to-date Change: 5.3% | |
| CINF Links: Profile News Message Board | |
| Charts:- Daily , Weekly | |
| Add CINF to Watchlist: View: Get Complete CINF Trend Analysis ➞ | |
 | DX Dynex Capital, Inc. |
| Sector: Financials | |
| SubSector: Mortgage Investment | |
| MarketCap: 327.839 Millions | |
| Recent Price: 12.53 Smart Investing & Trading Score: 63 | |
| Day Percent Change: -0.32% Day Change: -0.04 | |
| Week Change: 0.64% Year-to-date Change: 5.3% | |
| DX Links: Profile News Message Board | |
| Charts:- Daily , Weekly | |
| Add DX to Watchlist: View: Get Complete DX Trend Analysis ➞ | |
 | MTAL Metals Acquisition Limited |
| Sector: Financials | |
| SubSector: SPAC | |
| MarketCap: 497 Millions | |
| Recent Price: 12.07 Smart Investing & Trading Score: 62 | |
| Day Percent Change: 0% Day Change: 0 | |
| Week Change: 0.08% Year-to-date Change: 13.7% | |
| MTAL Links: Profile News Message Board | |
| Charts:- Daily , Weekly | |
| Add MTAL to Watchlist: View: Get Complete MTAL Trend Analysis ➞ | |
 | GLPI Gaming and Leisure Properties, Inc. |
| Sector: Financials | |
| SubSector: REIT - Diversified | |
| MarketCap: 4922.33 Millions | |
| Recent Price: 46.53 Smart Investing & Trading Score: 62 | |
| Day Percent Change: -1.17% Day Change: -0.55 | |
| Week Change: 0.82% Year-to-date Change: -1.9% | |
| GLPI Links: Profile News Message Board | |
| Charts:- Daily , Weekly | |
| Add GLPI to Watchlist: View: Get Complete GLPI Trend Analysis ➞ | |
 | GOCO GoHealth, Inc. |
| Sector: Financials | |
| SubSector: Insurance Brokers | |
| MarketCap: 44157 Millions | |
| Recent Price: 5.91 Smart Investing & Trading Score: 61 | |
| Day Percent Change: 5.16% Day Change: 0.29 | |
| Week Change: 6.29% Year-to-date Change: -55.9% | |
| GOCO Links: Profile News Message Board | |
| Charts:- Daily , Weekly | |
| Add GOCO to Watchlist: View: Get Complete GOCO Trend Analysis ➞ | |
 | STHO Star Holdings |
| Sector: Financials | |
| SubSector: Financials Services | |
| MarketCap: 195 Millions | |
| Recent Price: 7.27 Smart Investing & Trading Score: 61 | |
| Day Percent Change: 0.69% Day Change: 0.05 | |
| Week Change: -0.27% Year-to-date Change: -25.3% | |
| STHO Links: Profile News Message Board | |
| Charts:- Daily , Weekly | |
| Add STHO to Watchlist: View: Get Complete STHO Trend Analysis ➞ | |
 | HLI Houlihan Lokey, Inc. |
| Sector: Financials | |
| SubSector: Investment Brokerage - National | |
| MarketCap: 3352.65 Millions | |
| Recent Price: 192.39 Smart Investing & Trading Score: 61 | |
| Day Percent Change: -0.39% Day Change: -0.76 | |
| Week Change: 1.37% Year-to-date Change: 11.2% | |
| HLI Links: Profile News Message Board | |
| Charts:- Daily , Weekly | |
| Add HLI to Watchlist: View: Get Complete HLI Trend Analysis ➞ | |
 | NYMT New York Mortgage Trust, Inc. |
| Sector: Financials | |
| SubSector: Mortgage Investment | |
| MarketCap: 1038.39 Millions | |
| Recent Price: 6.68 Smart Investing & Trading Score: 61 | |
| Day Percent Change: -0.6% Day Change: -0.04 | |
| Week Change: 1.52% Year-to-date Change: 13.7% | |
| NYMT Links: Profile News Message Board | |
| Charts:- Daily , Weekly | |
| Add NYMT to Watchlist: View: Get Complete NYMT Trend Analysis ➞ | |
 | PKBK Parke Bancorp, Inc. |
| Sector: Financials | |
| SubSector: Regional - Northeast Banks | |
| MarketCap: 165.799 Millions | |
| Recent Price: 20.68 Smart Investing & Trading Score: 61 | |
| Day Percent Change: 1.55% Day Change: 0.31 | |
| Week Change: 1.82% Year-to-date Change: 2.8% | |
| PKBK Links: Profile News Message Board | |
| Charts:- Daily , Weekly | |
| Add PKBK to Watchlist: View: Get Complete PKBK Trend Analysis ➞ | |
| For tabular summary view of above stock list: Summary View ➞ 0 - 25 , 25 - 50 , 50 - 75 , 75 - 100 , 100 - 125 , 125 - 150 , 150 - 175 , 175 - 200 , 200 - 225 , 225 - 250 , 250 - 275 , 275 - 300 , 300 - 325 , 325 - 350 , 350 - 375 , 375 - 400 , 400 - 425 , 425 - 450 , 450 - 475 , 475 - 500 , 500 - 525 , 525 - 550 , 550 - 575 | ||
| Click To Change The Sort Order: By Market Cap or Company Size Performance: Year-to-date, Week and Day | |
| Select Chart Type: | ||
|
Best Stocks Today 12Stocks.com |
© 2025 12Stocks.com Terms & Conditions Privacy Contact Us
All Information Provided Only For Education And Not To Be Used For Investing or Trading. See Terms & Conditions


One More Thing ... Get Best Stocks Delivered Daily!
Never Ever Miss A Move With Our Top Ten Stocks Lists
Find Best Stocks In Any Market - Bull or Bear Market
Take A Peek At Our Top Ten Stocks Lists: Daily, Weekly, Year-to-Date & Top Trends
Find Best Stocks In Any Market - Bull or Bear Market
Take A Peek At Our Top Ten Stocks Lists: Daily, Weekly, Year-to-Date & Top Trends
Financial Stocks With Best Up Trends [0-bearish to 100-bullish]: Lemonade [100], MBIA [100], AlTi Global[100], Cushman & Wakefield[100], LGI Homes[100], Rocket [100], Tanger Factory[100], Mr. Cooper[100], CBL & Associates Properties[100], Hamilton Lane[100], Simon Property[100]
Best Financial Stocks Year-to-Date:
ESSA Bancorp[3207.77%], Easterly Government[107.23%], Mr. Cooper[97.21%], Heritage Insurance[79.01%], Root [72.94%], Industrial Logistics[70.13%], Rocket [69.21%], Diversified Healthcare[50.49%], ProAssurance [49.72%], World Acceptance[41.78%], XP [41.43%] Best Financial Stocks This Week:
Uniti [47.66%], Lemonade [31.68%], AlTi Global[24.1%], MBIA [20.54%], Industrial Logistics[14.9%], Cushman & Wakefield[12.24%], Tanger Factory[9.38%], Hippo [9.07%], Rocket [9.01%], LGI Homes[8.92%], eXp World[8.81%] Best Financial Stocks Daily:
Lemonade [29.54%], MBIA [22.5%], AlTi Global[18.05%], Cushman & Wakefield[8.69%], LGI Homes[8.6%], Rocket [6.81%], Alexander s[6.14%], Tanger Factory[5.97%], Brookfield Business[5.91%], Mr. Cooper[5.69%], B. Riley[5.38%]