
 Login Sign Up


| |||||
 |  | ||||

| 12Stocks.com Market Intelligence |
Best Financial Stocks
| In a hurry? Financial Stocks Lists: Performance Trends Table, Stock Charts
Sort Financial stocks: Daily, Weekly, Year-to-Date, Market Cap & Trends. Filter Financial stocks list by size:All Financial Large Mid-Range Small & MicroCap |
| 12Stocks.com Financial Stocks Performances & Trends Daily | |||||||||
|
|  The overall Smart Investing & Trading Score is 30 (0-bearish to 100-bullish) which puts Financial sector in short term bearish to neutral trend. The Smart Investing & Trading Score from previous trading session is 50 and hence a deterioration of trend.
| ||||||||
Here are the Smart Investing & Trading Scores of the most requested Financial stocks at 12Stocks.com (click stock name for detailed review):
|


| 12Stocks.com: Investing in Financial sector with Stocks | |
|
The following table helps investors and traders sort through current performance and trends (as measured by Smart Investing & Trading Score) of various
stocks in the Financial sector. Quick View: Move mouse or cursor over stock symbol (ticker) to view short-term Technical chart and over stock name to view long term chart. Click on  to add stock symbol to your watchlist and to add stock symbol to your watchlist and  to view watchlist. Click on any ticker or stock name for detailed market intelligence report for that stock. to view watchlist. Click on any ticker or stock name for detailed market intelligence report for that stock. |
12Stocks.com Performance of Stocks in Financial Sector
| Ticker | Stock Name | Watchlist | Category | Recent Price | Smart Investing & Trading Score | Change % | YTD Change% |
| DIAX | Nuveen Dow |   | Closed-End Fund - Equity | 14.48 | 20 | -2.03 | 1.02% |
| HPP | Hudson Pacific | | REIT - Office | 2.88 | 50 | -2.04 | 0.70% |
| PNFP | Pinnacle | | Banks - Regional | 95.36 | 20 | -2.05 | -15.41% |
| BOH | Bank of Hawaii Corp | | Banks - Regional | 66.62 | 0 | -2.06 | -2.95% |
| HAWK | Blackhawk Network | | Credit Services | 36.56 | 70 | -2.06 | 0.00% |
| BXMX | Nuveen S&P | | Closed-End Fund - Equity | 14.16 | 20 | -2.07 | 7.31% |
| VNO | Vornado Realty | | REIT - Office | 42.07 | 70 | -2.09 | -1.29% |
| SNH | Senior Housing | | REIT | 85.14 | 70 | -2.10 | 0.00% |
| SNV | Synovus | | Banks - Regional | 50.64 | 10 | -2.11 | 1.26% |
| AIZ | Assurant | | Insurance - Property & Casualty | 208.49 | 30 | -2.12 | -0.62% |
| APSG | Apollo Strategic | | SPAC | 7.39 | 0 | -2.12 | 0.00% |
| THG | Hanover Insurance | | Insurance - Property & Casualty | 176.53 | 40 | -2.13 | 17.05% |
| LNC | Loln National | | Insurance - Life | 41.25 | 40 | -2.14 | 35.11% |
| HTLF | Heartland | | Regional - Southwest Banks | 64.67 | 20 | -2.16 | 6.76% |
| AON | Aon | | Insurance | 363.80 | 20 | -2.19 | 3.10% |
| WASH | Washington Trust | | Banks - Regional | 29.22 | 30 | -2.27 | 1.00% |
| PSTB | Park Sterling | | Regional Banks | 31.03 | 50 | -2.27 | 0.00% |
| IBKR | Interactive Brokers | | Capital Markets | 62.25 | 20 | -2.28 | 36.82% |
| ZION | Zions Ban | | Banks - Regional | 57.07 | 30 | -2.31 | 7.30% |
| EXR | Extra Space | | REIT - Industrial | 143.73 | 30 | -2.32 | -0.57% |
| BTO | John Hancock | | Closed-End Fund - Equity | 35.99 | 20 | -2.33 | 1.90% |
| PBIP | Prudential Bancorp | | S&L | 57.10 | 70 | -2.34 | 0.00% |
| CADE | Cadence Bank | | Banks - Regional | 36.81 | 30 | -2.36 | 11.24% |
| MMC | Marsh & McLennan Cos | | Insurance | 198.11 | 0 | -2.38 | -5.19% |
| SIGI | Selective Insurance | | Insurance - Property & Casualty | 77.11 | 30 | -2.40 | -15.57% |
| For chart view version of above stock list: Chart View ➞ 0 - 25 , 25 - 50 , 50 - 75 , 75 - 100 , 100 - 125 , 125 - 150 , 150 - 175 , 175 - 200 , 200 - 225 , 225 - 250 , 250 - 275 , 275 - 300 , 300 - 325 , 325 - 350 , 350 - 375 , 375 - 400 , 400 - 425 , 425 - 450 , 450 - 475 , 475 - 500 , 500 - 525 , 525 - 550 , 550 - 575 , 575 - 600 , 600 - 625 , 625 - 650 , 650 - 675 , 675 - 700 , 700 - 725 , 725 - 750 , 750 - 775 , 775 - 800 , 800 - 825 , 825 - 850 , 850 - 875 , 875 - 900 , 900 - 925 , 925 - 950 , 950 - 975 , 975 - 1000 , 1000 - 1025 , 1025 - 1050 , 1050 - 1075 , 1075 - 1100 , 1100 - 1125 , 1125 - 1150 , 1150 - 1175 , 1175 - 1200 , 1200 - 1225 , 1225 - 1250 , 1250 - 1275 , 1275 - 1300 , 1300 - 1325 , 1325 - 1350 , 1350 - 1375 , 1375 - 1400 , 1400 - 1425 , 1425 - 1450 , 1450 - 1475 , 1475 - 1500 , 1500 - 1525 , 1525 - 1550 | ||
 | Click To Change The Sort Order: By Market Cap or Company Size Performance: Year-to-date, Week and Day |  |
|
Get the most comprehensive stock market coverage daily at 12Stocks.com ➞ Best Stocks Today ➞ Best Stocks Weekly ➞ Best Stocks Year-to-Date ➞ Best Stocks Trends ➞  Best Stocks Today 12Stocks.com Best Nasdaq Stocks ➞ Best S&P 500 Stocks ➞ Best Tech Stocks ➞ Best Biotech Stocks ➞ |
| Detailed Overview of Financial Stocks |
| Financial Technical Overview, Leaders & Laggards, Top Financial ETF Funds & Detailed Financial Stocks List, Charts, Trends & More |
| Financial Sector: Technical Analysis, Trends & YTD Performance | |
| Financial sector is composed of stocks
from banks, brokers, insurance, REITs
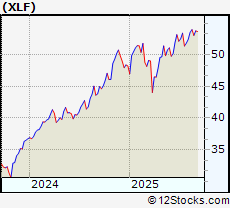
and services subsectors. Financial sector, as represented by XLF, an exchange-traded fund [ETF] that holds basket of Financial stocks (e.g, Bank of America, Goldman Sachs) is up by 12.1335% and is currently underperforming the overall market by -1.2673% year-to-date. Below is a quick view of Technical charts and trends: |
|
 XLF Weekly Chart |
|
| Long Term Trend: Good | |
| Medium Term Trend: Not Good | |
 XLF Daily Chart |
|
| Short Term Trend: Good | |
| Overall Trend Score: 30 | |
| YTD Performance: 12.1335% | |
| **Trend Scores & Views Are Only For Educational Purposes And Not For Investing | |
| 12Stocks.com: Top Performing Financial Sector Stocks | |||||||||||||||||||||||||||||||||||||||||||||||
 The top performing Financial sector stocks year to date are
Now, more recently, over last week, the top performing Financial sector stocks on the move are


|
|||||||||||||||||||||||||||||||||||||||||||||||
| 12Stocks.com: Investing in Financial Sector using Exchange Traded Funds | |
|
The following table shows list of key exchange traded funds (ETF) that
help investors track Financial Index. For detailed view, check out our ETF Funds section of our website. Quick View: Move mouse or cursor over ETF symbol (ticker) to view short-term Technical chart and over ETF name to view long term chart. Click on ticker or stock name for detailed view. Click on to add stock symbol to your watchlist and to view watchlist. |
12Stocks.com List of ETFs that track Financial Index
| Ticker | ETF Name | Watchlist | Recent Price | Smart Investing & Trading Score | Change % | Week % | Year-to-date % |
| CHIX | China Financials | | 10.57 | 20 | 0 | 0 | 0% |
| 12Stocks.com: Charts, Trends, Fundamental Data and Performances of Financial Stocks | |
|
We now take in-depth look at all Financial stocks including charts, multi-period performances and overall trends (as measured by Smart Investing & Trading Score). One can sort Financial stocks (click link to choose) by Daily, Weekly and by Year-to-Date performances. Also, one can sort by size of the company or by market capitalization. |
| Select Your Default Chart Type: | |||||
| |||||
| Click on stock symbol or name for detailed view. Click on to add stock symbol to your watchlist and to view watchlist. Quick View: Move mouse or cursor over "Daily" to quickly view daily Technical stock chart and over "Weekly" to view weekly Technical stock chart. | |||||

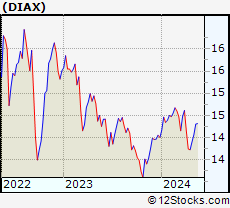 | DIAX Nuveen Dow 30SM Dynamic Overwrite Fund |
| Sector: Financials | |
| SubSector: Closed-End Fund - Equity | |
| MarketCap: 535.32 Millions | |
| Recent Price: 14.48 Smart Investing & Trading Score: 20 | |
| Day Percent Change: -2.02977% Day Change: -0.07 | |
| Week Change: -1.63043% Year-to-date Change: 1.0% | |
| DIAX Links: Profile News Message Board | |
| Charts:- Daily , Weekly | |
| Add DIAX to Watchlist: View: Get Complete DIAX Trend Analysis ➞ | |
 | HPP Hudson Pacific Properties Inc |
| Sector: Financials | |
| SubSector: REIT - Office | |
| MarketCap: 1179.17 Millions | |
| Recent Price: 2.88 Smart Investing & Trading Score: 50 | |
| Day Percent Change: -2.04082% Day Change: 0.01 | |
| Week Change: -6.18893% Year-to-date Change: 0.7% | |
| HPP Links: Profile News Message Board | |
| Charts:- Daily , Weekly | |
| Add HPP to Watchlist: View: Get Complete HPP Trend Analysis ➞ | |
 | PNFP Pinnacle Financial Partners Inc |
| Sector: Financials | |
| SubSector: Banks - Regional | |
| MarketCap: 7552.4 Millions | |
| Recent Price: 95.36 Smart Investing & Trading Score: 20 | |
| Day Percent Change: -2.05423% Day Change: -1.87 | |
| Week Change: -2.06429% Year-to-date Change: -15.4% | |
| PNFP Links: Profile News Message Board | |
| Charts:- Daily , Weekly | |
| Add PNFP to Watchlist: View: Get Complete PNFP Trend Analysis ➞ | |
 | BOH Bank of Hawaii Corp |
| Sector: Financials | |
| SubSector: Banks - Regional | |
| MarketCap: 2716.52 Millions | |
| Recent Price: 66.62 Smart Investing & Trading Score: 0 | |
| Day Percent Change: -2.05822% Day Change: -0.08 | |
| Week Change: -2.47402% Year-to-date Change: -2.9% | |
| BOH Links: Profile News Message Board | |
| Charts:- Daily , Weekly | |
| Add BOH to Watchlist: View: Get Complete BOH Trend Analysis ➞ | |
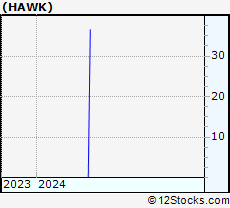 | HAWK Blackhawk Network Holdings, Inc. |
| Sector: Financials | |
| SubSector: Credit Services | |
| MarketCap: 1957.47 Millions | |
| Recent Price: 36.56 Smart Investing & Trading Score: 70 | |
| Day Percent Change: -2.06268% Day Change: -9999 | |
| Week Change: 91300% Year-to-date Change: 0.0% | |
| HAWK Links: Profile News Message Board | |
| Charts:- Daily , Weekly | |
| Add HAWK to Watchlist: View: Get Complete HAWK Trend Analysis ➞ | |
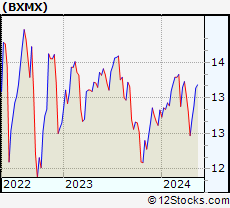 | BXMX Nuveen S&P 500 Buy-Write Income Fund |
| Sector: Financials | |
| SubSector: Closed-End Fund - Equity | |
| MarketCap: 1486.44 Millions | |
| Recent Price: 14.16 Smart Investing & Trading Score: 20 | |
| Day Percent Change: -2.07469% Day Change: -0.01 | |
| Week Change: -0.770848% Year-to-date Change: 7.3% | |
| BXMX Links: Profile News Message Board | |
| Charts:- Daily , Weekly | |
| Add BXMX to Watchlist: View: Get Complete BXMX Trend Analysis ➞ | |
 | VNO Vornado Realty Trust |
| Sector: Financials | |
| SubSector: REIT - Office | |
| MarketCap: 8619.24 Millions | |
| Recent Price: 42.07 Smart Investing & Trading Score: 70 | |
| Day Percent Change: -2.09448% Day Change: -1.21 | |
| Week Change: 1.88908% Year-to-date Change: -1.3% | |
| VNO Links: Profile News Message Board | |
| Charts:- Daily , Weekly | |
| Add VNO to Watchlist: View: Get Complete VNO Trend Analysis ➞ | |
 | SNH Senior Housing Properties Trust |
| Sector: Financials | |
| SubSector: REIT - Healthcare Facilities | |
| MarketCap: 4715.37 Millions | |
| Recent Price: 85.14 Smart Investing & Trading Score: 70 | |
| Day Percent Change: -2.10417% Day Change: -9999 | |
| Week Change: 981.83% Year-to-date Change: 0.0% | |
| SNH Links: Profile News Message Board | |
| Charts:- Daily , Weekly | |
| Add SNH to Watchlist: View: Get Complete SNH Trend Analysis ➞ | |
 | SNV Synovus Financial Corp |
| Sector: Financials | |
| SubSector: Banks - Regional | |
| MarketCap: 7145.64 Millions | |
| Recent Price: 50.64 Smart Investing & Trading Score: 10 | |
| Day Percent Change: -2.10709% Day Change: -0.98 | |
| Week Change: -1.6317% Year-to-date Change: 1.3% | |
| SNV Links: Profile News Message Board | |
| Charts:- Daily , Weekly | |
| Add SNV to Watchlist: View: Get Complete SNV Trend Analysis ➞ | |
 | AIZ Assurant Inc |
| Sector: Financials | |
| SubSector: Insurance - Property & Casualty | |
| MarketCap: 10655.5 Millions | |
| Recent Price: 208.49 Smart Investing & Trading Score: 30 | |
| Day Percent Change: -2.12197% Day Change: -3.71 | |
| Week Change: -1.26912% Year-to-date Change: -0.6% | |
| AIZ Links: Profile News Message Board | |
| Charts:- Daily , Weekly | |
| Add AIZ to Watchlist: View: Get Complete AIZ Trend Analysis ➞ | |
 | APSG Apollo Strategic Growth Capital |
| Sector: Financials | |
| SubSector: SPAC | |
| MarketCap: 10357 Millions | |
| Recent Price: 7.39 Smart Investing & Trading Score: 0 | |
| Day Percent Change: -2.11921% Day Change: -9999 | |
| Week Change: -25.8776% Year-to-date Change: 0.0% | |
| APSG Links: Profile News Message Board | |
| Charts:- Daily , Weekly | |
| Add APSG to Watchlist: View: Get Complete APSG Trend Analysis ➞ | |
 | THG Hanover Insurance Group Inc |
| Sector: Financials | |
| SubSector: Insurance - Property & Casualty | |
| MarketCap: 6353.55 Millions | |
| Recent Price: 176.53 Smart Investing & Trading Score: 40 | |
| Day Percent Change: -2.12896% Day Change: -2.97 | |
| Week Change: -0.61367% Year-to-date Change: 17.0% | |
| THG Links: Profile News Message Board | |
| Charts:- Daily , Weekly | |
| Add THG to Watchlist: View: Get Complete THG Trend Analysis ➞ | |
 | LNC Lincoln National Corp |
| Sector: Financials | |
| SubSector: Insurance - Life | |
| MarketCap: 7983.23 Millions | |
| Recent Price: 41.25 Smart Investing & Trading Score: 40 | |
| Day Percent Change: -2.13523% Day Change: -0.77 | |
| Week Change: -2.04227% Year-to-date Change: 35.1% | |
| LNC Links: Profile News Message Board | |
| Charts:- Daily , Weekly | |
| Add LNC to Watchlist: View: Get Complete LNC Trend Analysis ➞ | |
 | HTLF Heartland Financial USA, Inc. |
| Sector: Financials | |
| SubSector: Regional - Southwest Banks | |
| MarketCap: 1143.85 Millions | |
| Recent Price: 64.67 Smart Investing & Trading Score: 20 | |
| Day Percent Change: -2.16339% Day Change: -9999 | |
| Week Change: -2.45852% Year-to-date Change: 6.8% | |
| HTLF Links: Profile News Message Board | |
| Charts:- Daily , Weekly | |
| Add HTLF to Watchlist: View: Get Complete HTLF Trend Analysis ➞ | |
 | AON Aon plc |
| Sector: Financials | |
| SubSector: Insurance Brokers | |
| MarketCap: 79898.3 Millions | |
| Recent Price: 363.80 Smart Investing & Trading Score: 20 | |
| Day Percent Change: -2.19115% Day Change: -5.89 | |
| Week Change: -1.81897% Year-to-date Change: 3.1% | |
| AON Links: Profile News Message Board | |
| Charts:- Daily , Weekly | |
| Add AON to Watchlist: View: Get Complete AON Trend Analysis ➞ | |
 | WASH Washington Trust Bancorp, Inc |
| Sector: Financials | |
| SubSector: Banks - Regional | |
| MarketCap: 574.46 Millions | |
| Recent Price: 29.22 Smart Investing & Trading Score: 30 | |
| Day Percent Change: -2.27425% Day Change: -0.24 | |
| Week Change: -2.56752% Year-to-date Change: 1.0% | |
| WASH Links: Profile News Message Board | |
| Charts:- Daily , Weekly | |
| Add WASH to Watchlist: View: Get Complete WASH Trend Analysis ➞ | |
 | PSTB Park Sterling Corporation |
| Sector: Financials | |
| SubSector: Regional - Southeast Banks | |
| MarketCap: 632.77 Millions | |
| Recent Price: 31.03 Smart Investing & Trading Score: 50 | |
| Day Percent Change: -2.26772% Day Change: -9999 | |
| Week Change: 7.89291% Year-to-date Change: 0.0% | |
| PSTB Links: Profile News Message Board | |
| Charts:- Daily , Weekly | |
| Add PSTB to Watchlist: View: Get Complete PSTB Trend Analysis ➞ | |
 | IBKR Interactive Brokers Group Inc |
| Sector: Financials | |
| SubSector: Capital Markets | |
| MarketCap: 26786.1 Millions | |
| Recent Price: 62.25 Smart Investing & Trading Score: 20 | |
| Day Percent Change: -2.2763% Day Change: -1.17 | |
| Week Change: 3.47407% Year-to-date Change: 36.8% | |
| IBKR Links: Profile News Message Board | |
| Charts:- Daily , Weekly | |
| Add IBKR to Watchlist: View: Get Complete IBKR Trend Analysis ➞ | |
 | ZION Zions Bancorporation N.A |
| Sector: Financials | |
| SubSector: Banks - Regional | |
| MarketCap: 8343.7 Millions | |
| Recent Price: 57.07 Smart Investing & Trading Score: 30 | |
| Day Percent Change: -2.31085% Day Change: -1.03 | |
| Week Change: 0.973107% Year-to-date Change: 7.3% | |
| ZION Links: Profile News Message Board | |
| Charts:- Daily , Weekly | |
| Add ZION to Watchlist: View: Get Complete ZION Trend Analysis ➞ | |
 | EXR Extra Space Storage Inc |
| Sector: Financials | |
| SubSector: REIT - Industrial | |
| MarketCap: 32637.5 Millions | |
| Recent Price: 143.73 Smart Investing & Trading Score: 30 | |
| Day Percent Change: -2.32416% Day Change: -3.25 | |
| Week Change: -2.41037% Year-to-date Change: -0.6% | |
| EXR Links: Profile News Message Board | |
| Charts:- Daily , Weekly | |
| Add EXR to Watchlist: View: Get Complete EXR Trend Analysis ➞ | |
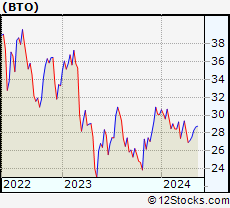 | BTO John Hancock Financial Opportunities Fund |
| Sector: Financials | |
| SubSector: Closed-End Fund - Equity | |
| MarketCap: 744.29 Millions | |
| Recent Price: 35.99 Smart Investing & Trading Score: 20 | |
| Day Percent Change: -2.33379% Day Change: 0.45 | |
| Week Change: -4.25645% Year-to-date Change: 1.9% | |
| BTO Links: Profile News Message Board | |
| Charts:- Daily , Weekly | |
| Add BTO to Watchlist: View: Get Complete BTO Trend Analysis ➞ | |
 | PBIP Prudential Bancorp, Inc. |
| Sector: Financials | |
| SubSector: Savings & Loans | |
| MarketCap: 133.03 Millions | |
| Recent Price: 57.10 Smart Investing & Trading Score: 70 | |
| Day Percent Change: -2.34308% Day Change: -9999 | |
| Week Change: 277.396% Year-to-date Change: 0.0% | |
| PBIP Links: Profile News Message Board | |
| Charts:- Daily , Weekly | |
| Add PBIP to Watchlist: View: Get Complete PBIP Trend Analysis ➞ | |
 | CADE Cadence Bank |
| Sector: Financials | |
| SubSector: Banks - Regional | |
| MarketCap: 6901.82 Millions | |
| Recent Price: 36.81 Smart Investing & Trading Score: 30 | |
| Day Percent Change: -2.36074% Day Change: -0.09 | |
| Week Change: -2.5417% Year-to-date Change: 11.2% | |
| CADE Links: Profile News Message Board | |
| Charts:- Daily , Weekly | |
| Add CADE to Watchlist: View: Get Complete CADE Trend Analysis ➞ | |
 | MMC Marsh & McLennan Cos., Inc |
| Sector: Financials | |
| SubSector: Insurance Brokers | |
| MarketCap: 100163 Millions | |
| Recent Price: 198.11 Smart Investing & Trading Score: 0 | |
| Day Percent Change: -2.3752% Day Change: -4.86 | |
| Week Change: -2.76333% Year-to-date Change: -5.2% | |
| MMC Links: Profile News Message Board | |
| Charts:- Daily , Weekly | |
| Add MMC to Watchlist: View: Get Complete MMC Trend Analysis ➞ | |
 | SIGI Selective Insurance Group Inc |
| Sector: Financials | |
| SubSector: Insurance - Property & Casualty | |
| MarketCap: 4856.46 Millions | |
| Recent Price: 77.11 Smart Investing & Trading Score: 30 | |
| Day Percent Change: -2.40476% Day Change: 0.22 | |
| Week Change: -3.38303% Year-to-date Change: -15.6% | |
| SIGI Links: Profile News Message Board | |
| Charts:- Daily , Weekly | |
| Add SIGI to Watchlist: View: Get Complete SIGI Trend Analysis ➞ | |
| For tabular summary view of above stock list: Summary View ➞ 0 - 25 , 25 - 50 , 50 - 75 , 75 - 100 , 100 - 125 , 125 - 150 , 150 - 175 , 175 - 200 , 200 - 225 , 225 - 250 , 250 - 275 , 275 - 300 , 300 - 325 , 325 - 350 , 350 - 375 , 375 - 400 , 400 - 425 , 425 - 450 , 450 - 475 , 475 - 500 , 500 - 525 , 525 - 550 , 550 - 575 , 575 - 600 , 600 - 625 , 625 - 650 , 650 - 675 , 675 - 700 , 700 - 725 , 725 - 750 , 750 - 775 , 775 - 800 , 800 - 825 , 825 - 850 , 850 - 875 , 875 - 900 , 900 - 925 , 925 - 950 , 950 - 975 , 975 - 1000 , 1000 - 1025 , 1025 - 1050 , 1050 - 1075 , 1075 - 1100 , 1100 - 1125 , 1125 - 1150 , 1150 - 1175 , 1175 - 1200 , 1200 - 1225 , 1225 - 1250 , 1250 - 1275 , 1275 - 1300 , 1300 - 1325 , 1325 - 1350 , 1350 - 1375 , 1375 - 1400 , 1400 - 1425 , 1425 - 1450 , 1450 - 1475 , 1475 - 1500 , 1500 - 1525 , 1525 - 1550 | ||
| Click To Change The Sort Order: By Market Cap or Company Size Performance: Year-to-date, Week and Day | |
| Select Chart Type: | ||
|
Best Stocks Today 12Stocks.com |
© 2025 12Stocks.com Terms & Conditions Privacy Contact Us
All Information Provided Only For Education And Not To Be Used For Investing or Trading. See Terms & Conditions


One More Thing ... Get Best Stocks Delivered Daily!
Never Ever Miss A Move With Our Top Ten Stocks Lists
Find Best Stocks In Any Market - Bull or Bear Market
Take A Peek At Our Top Ten Stocks Lists: Daily, Weekly, Year-to-Date & Top Trends
Find Best Stocks In Any Market - Bull or Bear Market
Take A Peek At Our Top Ten Stocks Lists: Daily, Weekly, Year-to-Date & Top Trends
Financial Stocks With Best Up Trends [0-bearish to 100-bullish]: PIMCO California[100], Torchmark [100], PIMCO California[100], Triumph Bancorp[100], Lemonade [100], PIMCO Municipal[100], Better Home[100], PIMCO Municipal[100], SuRo Capital[100], Front Yard[100], Atlanticus [100]
Best Financial Stocks Year-to-Date:
Insight Select[12384.6%], Oxford Lane[298.776%], Metalpha Technology[206.195%], Robinhood Markets[191.151%], Better Home[187.309%], Mr. Cooper[133.83%], LoanDepot [131.282%], Banco Santander[130.948%], IHS Holding[125.472%], Cipher Mining[124.638%], Deutsche Bank[123.86%] Best Financial Stocks This Week:
Colony Starwood[15929900%], Blackhawk Network[91300%], Macquarie Global[81662.9%], Credit Suisse[63241.6%], Pennsylvania Real[23823%], First Republic[22570.9%], Select ome[14000%], CorEnergy Infrastructure[6797.78%], FedNat Holding[5525%], BlackRock Municipal[5340%], BlackRock MuniYield[3379.04%] Best Financial Stocks Daily:
PIMCO California[11.9545%], Torchmark [11.8363%], PIMCO California[11.4754%], BlackRock Muni[10.8108%], Blackrock MuniYield[10.72%], Triumph Bancorp[10.2661%], BlackRock MuniYield[8.15348%], Lemonade [7.81815%], Summit [7.79817%], Concord Acquisition[7.63431%], PIMCO Municipal[6.8299%]