
 Login Sign Up


| |||||
 |  | ||||

| 12Stocks.com Market Intelligence |
Best Consumer Services Stocks
| In a hurry? Services & Goods Stocks: Performance Trends Table, Stock Charts
Sort Consumer Services: Daily, Weekly, Year-to-Date, Market Cap & Trends. Filter Services & Goods stocks list by size: All Large Mid-Range Small |
| 12Stocks.com Consumer Services Stocks Performances & Trends Daily | |||||||||
|
|  The overall Smart Investing & Trading Score is 100 (0-bearish to 100-bullish) which puts Consumer Services sector in short term bullish trend. The Smart Investing & Trading Score from previous trading session is 100 and an improvement of trend continues.
| ||||||||
Here are the Smart Investing & Trading Scores of the most requested Consumer Services stocks at 12Stocks.com (click stock name for detailed review):
|


| Consider signing up for our daily 12Stocks.com "Best Stocks Newsletter". You will never ever miss a big stock move again! |
| 12Stocks.com: Investing in Consumer Services sector with Stocks | |
|
The following table helps investors and traders sort through current performance and trends (as measured by Smart Investing & Trading Score) of various
stocks in the Consumer Services sector. Quick View: Move mouse or cursor over stock symbol (ticker) to view short-term Technical chart and over stock name to view long term chart. Click on  to add stock symbol to your watchlist and to add stock symbol to your watchlist and  to view watchlist. Click on any ticker or stock name for detailed market intelligence report for that stock. to view watchlist. Click on any ticker or stock name for detailed market intelligence report for that stock. |
12Stocks.com Performance of Stocks in Consumer Services Sector
| Ticker | Stock Name | Watchlist | Category | Recent Price | Smart Investing & Trading Score | Change % | YTD Change% |
| IAS | Integral Ad |   | Advertising | 9.05 | 100 | 2.73% | -13.60% |
| FND | Floor & Decor | | Retail | 83.43 | 60 | 4.88% | -13.82% |
| RSVR | Reservoir Media | | Entertainment | 7.67 | 10 | 2.00% | -14.03% |
| PTLO | Portillos | | Restaurants | 7.63 | 10 | 1.45% | -14.20% |
| GCI | Gannett Co | | Publishing | 4.23 | 100 | 2.09% | -14.23% |
| STRA | Strategic Education | | Education | 78.34 | 20 | 29.85% | -14.50% |
| CCO | Clear Channel | | Marketing | 1.18 | 80 | -5.13% | -14.60% |
| GHG | GreenTree Hospitality | | Lodging | 2.14 | 20 | -58.58% | -14.65% |
| MMYT | MakeMyTrip | | Entertainment | 98.61 | 60 | 2.41% | -14.86% |
| MTN | Vail Resorts | | Casinos | 153.41 | 70 | 1.45% | -15.07% |
| GETY | Getty Images | | Internet Content & Information | 1.81 | 70 | 8.79% | -15.28% |
| CMPR | Cimpress | | Services | 59.06 | 80 | 1.97% | -15.50% |
| OLPX | Olaplex | | Specialty Retail | 1.41 | 56 | -1.65% | -15.61% |
| CNK | Cinemark | | Entertainment | 25.62 | 40 | 1.22% | -15.66% |
| ICFI | ICF | | Services | 98.40 | 100 | 2.37% | -16.12% |
| AEO | American Eagle | | Apparel | 12.99 | 100 | 4.23% | -16.26% |
| ZUMZ | Zumiez | | Retail | 15.49 | 100 | 4.90% | -16.64% |
| PK | Park Hotels | | Lodging | 10.91 | 70 | 1.78% | -16.70% |
| SHAK | Shake Shack | | Restaurants | 106.95 | 0 | 1.72% | -16.71% |
| MCW | Mister Car | | Services | 5.93 | 50 | 2.72% | -16.74% |
| CPRT | Copart | | Automobile | 47.08 | 40 | 1.11% | -16.97% |
| GDEN | Golden Entertainment | | Casinos | 24.88 | 0 | -23.65% | -17.09% |
| TSQ | Townsquare Media | | Broadcasting | 7.02 | 40 | 4.89% | -17.52% |
| MSC | Studio City | | Casinos | 4.61 | 40 | -6.16% | -17.70% |
| EXPO | Exponent | | Services | 69.25 | 10 | 2.62% | -17.85% |
| For chart view version of above stock list: Chart View ➞ 0 - 25 , 25 - 50 , 50 - 75 , 75 - 100 , 100 - 125 , 125 - 150 , 150 - 175 , 175 - 200 , 200 - 225 , 225 - 250 , 250 - 275 , 275 - 300 , 300 - 325 , 325 - 350 , 350 - 375 , 375 - 400 , 400 - 425 | ||
 | Click To Change The Sort Order: By Market Cap or Company Size Performance: Year-to-date, Week and Day |  |
|
Get the most comprehensive stock market coverage daily at 12Stocks.com ➞ Best Stocks Today ➞ Best Stocks Weekly ➞ Best Stocks Year-to-Date ➞ Best Stocks Trends ➞  Best Stocks Today 12Stocks.com Best Nasdaq Stocks ➞ Best S&P 500 Stocks ➞ Best Tech Stocks ➞ Best Biotech Stocks ➞ |
| Detailed Overview of Consumer Services Stocks |
| Consumer Services Technical Overview, Leaders & Laggards, Top Consumer Services ETF Funds & Detailed Consumer Services Stocks List, Charts, Trends & More |
| Consumer Services Sector: Technical Analysis, Trends & YTD Performance | |
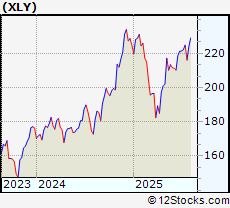
| Consumer Services sector is composed of stocks
from retail, entertainment, media/publishing, consumer goods
and services subsectors. Consumer Services sector, as represented by XLY, an exchange-traded fund [ETF] that holds basket of Consumer Services stocks (e.g, Walmart, Alibaba) is up by 2.95% and is currently underperforming the overall market by -7.38% year-to-date. Below is a quick view of Technical charts and trends: |
|
 XLY Weekly Chart |
|
| Long Term Trend: Very Good | |
| Medium Term Trend: Very Good | |
 XLY Daily Chart |
|
| Short Term Trend: Very Good | |
| Overall Trend Score: 100 | |
| YTD Performance: 2.95% | |
| **Trend Scores & Views Are Only For Educational Purposes And Not For Investing | |
| 12Stocks.com: Top Performing Consumer Services Sector Stocks | ||||||||||||||||||||||||||||||||||||||||||||||
 The top performing Consumer Services sector stocks year to date are
Now, more recently, over last week, the top performing Consumer Services sector stocks on the move are


|
||||||||||||||||||||||||||||||||||||||||||||||
| 12Stocks.com: Investing in Consumer Services Sector using Exchange Traded Funds | |
|
The following table shows list of key exchange traded funds (ETF) that
help investors track Consumer Services Index. For detailed view, check out our ETF Funds section of our website. Quick View: Move mouse or cursor over ETF symbol (ticker) to view short-term Technical chart and over ETF name to view long term chart. Click on ticker or stock name for detailed view. Click on to add stock symbol to your watchlist and to view watchlist. |
12Stocks.com List of ETFs that track Consumer Services Index
| Ticker | ETF Name | Watchlist | Recent Price | Smart Investing & Trading Score | Change % | Week % | Year-to-date % |
| XLY | Consumer Discret Sel | | 229.04 | 100 | 2.01 | 2.86 | 2.95% |
| RTH | Retail | | 247.72 | 100 | 0.63 | 0.8 | 10.46% |
| IYC | Consumer Services | | 102.72 | 100 | 1.68 | 2.04 | 7.35% |
| XRT | Retail | | 83.59 | 100 | 2.54 | 4.47 | 7.4% |
| IYK | Consumer Goods | | 70.21 | 40 | 0.37 | 1.49 | 8.38% |
| UCC | Consumer Services | | 49.53 | 100 | 2.96 | 5.78 | -2.73% |
| RETL | Retail Bull 3X | | 9.42 | 100 | 26.94 | 13.16 | 0.86% |
| RXI | Globl Consumer Discretionary | | 196.05 | 100 | 0.53 | 3.13 | 7.68% |
| SCC | Short Consumer Services | | 16.04 | 0 | -19.86 | -5.49 | -12.44% |
| UGE | Consumer Goods | | 18.79 | 20 | 1.05 | 2.4 | 7.27% |
| 12Stocks.com: Charts, Trends, Fundamental Data and Performances of Consumer Services Stocks | |
|
We now take in-depth look at all Consumer Services stocks including charts, multi-period performances and overall trends (as measured by Smart Investing & Trading Score). One can sort Consumer Services stocks (click link to choose) by Daily, Weekly and by Year-to-Date performances. Also, one can sort by size of the company or by market capitalization. |
| Select Your Default Chart Type: | |||||
| |||||
| Click on stock symbol or name for detailed view. Click on to add stock symbol to your watchlist and to view watchlist. Quick View: Move mouse or cursor over "Daily" to quickly view daily Technical stock chart and over "Weekly" to view weekly Technical stock chart. | |||||

 | IAS Integral Ad Science Holding Corp. |
| Sector: Services & Goods | |
| SubSector: Advertising Agencies | |
| MarketCap: 2760 Millions | |
| Recent Price: 9.05 Smart Investing & Trading Score: 100 | |
| Day Percent Change: 2.73% Day Change: 0.31 | |
| Week Change: 11.77% Year-to-date Change: -13.6% | |
| IAS Links: Profile News Message Board | |
| Charts:- Daily , Weekly | |
| Add IAS to Watchlist: View: Get Complete IAS Trend Analysis ➞ | |
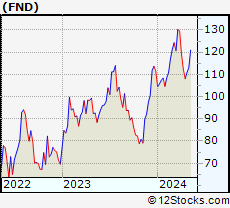 | FND Floor & Decor Holdings, Inc. |
| Sector: Services & Goods | |
| SubSector: Home Improvement Stores | |
| MarketCap: 3327.52 Millions | |
| Recent Price: 83.43 Smart Investing & Trading Score: 60 | |
| Day Percent Change: 4.88% Day Change: 5.2 | |
| Week Change: 7.76% Year-to-date Change: -13.8% | |
| FND Links: Profile News Message Board | |
| Charts:- Daily , Weekly | |
| Add FND to Watchlist: View: Get Complete FND Trend Analysis ➞ | |
 | RSVR Reservoir Media, Inc. |
| Sector: Services & Goods | |
| SubSector: Entertainment | |
| MarketCap: 389 Millions | |
| Recent Price: 7.67 Smart Investing & Trading Score: 10 | |
| Day Percent Change: 2% Day Change: 0.15 | |
| Week Change: -0.13% Year-to-date Change: -14.0% | |
| RSVR Links: Profile News Message Board | |
| Charts:- Daily , Weekly | |
| Add RSVR to Watchlist: View: Get Complete RSVR Trend Analysis ➞ | |
 | PTLO Portillos Inc. |
| Sector: Services & Goods | |
| SubSector: Restaurants | |
| MarketCap: 1590 Millions | |
| Recent Price: 7.63 Smart Investing & Trading Score: 10 | |
| Day Percent Change: 1.45% Day Change: 0.17 | |
| Week Change: 6.68% Year-to-date Change: -14.2% | |
| PTLO Links: Profile News Message Board | |
| Charts:- Daily , Weekly | |
| Add PTLO to Watchlist: View: Get Complete PTLO Trend Analysis ➞ | |
 | GCI Gannett Co., Inc. |
| Sector: Services & Goods | |
| SubSector: Publishing - Newspapers | |
| MarketCap: 222.322 Millions | |
| Recent Price: 4.23 Smart Investing & Trading Score: 100 | |
| Day Percent Change: 2.09% Day Change: 0.1 | |
| Week Change: 5.34% Year-to-date Change: -14.2% | |
| GCI Links: Profile News Message Board | |
| Charts:- Daily , Weekly | |
| Add GCI to Watchlist: View: Get Complete GCI Trend Analysis ➞ | |
 | STRA Strategic Education, Inc. |
| Sector: Services & Goods | |
| SubSector: Education & Training Services | |
| MarketCap: 2621.56 Millions | |
| Recent Price: 78.34 Smart Investing & Trading Score: 20 | |
| Day Percent Change: 29.85% Day Change: 22.39 | |
| Week Change: 0.85% Year-to-date Change: -14.5% | |
| STRA Links: Profile News Message Board | |
| Charts:- Daily , Weekly | |
| Add STRA to Watchlist: View: Get Complete STRA Trend Analysis ➞ | |
 | CCO Clear Channel Outdoor Holdings, Inc. |
| Sector: Services & Goods | |
| SubSector: Marketing Services | |
| MarketCap: 312.715 Millions | |
| Recent Price: 1.18 Smart Investing & Trading Score: 80 | |
| Day Percent Change: -5.13% Day Change: -0.08 | |
| Week Change: 6.36% Year-to-date Change: -14.6% | |
| CCO Links: Profile News Message Board | |
| Charts:- Daily , Weekly | |
| Add CCO to Watchlist: View: Get Complete CCO Trend Analysis ➞ | |
 | GHG GreenTree Hospitality Group Ltd. |
| Sector: Services & Goods | |
| SubSector: Lodging | |
| MarketCap: 1195.36 Millions | |
| Recent Price: 2.14 Smart Investing & Trading Score: 20 | |
| Day Percent Change: -58.58% Day Change: -3.62 | |
| Week Change: -0.68% Year-to-date Change: -14.7% | |
| GHG Links: Profile News Message Board | |
| Charts:- Daily , Weekly | |
| Add GHG to Watchlist: View: Get Complete GHG Trend Analysis ➞ | |
 | MMYT MakeMyTrip Limited |
| Sector: Services & Goods | |
| SubSector: General Entertainment | |
| MarketCap: 1429.59 Millions | |
| Recent Price: 98.61 Smart Investing & Trading Score: 60 | |
| Day Percent Change: 2.41% Day Change: 2.35 | |
| Week Change: 2.82% Year-to-date Change: -14.9% | |
| MMYT Links: Profile News Message Board | |
| Charts:- Daily , Weekly | |
| Add MMYT to Watchlist: View: Get Complete MMYT Trend Analysis ➞ | |
 | MTN Vail Resorts, Inc. |
| Sector: Services & Goods | |
| SubSector: Resorts & Casinos | |
| MarketCap: 6259.64 Millions | |
| Recent Price: 153.41 Smart Investing & Trading Score: 70 | |
| Day Percent Change: 1.45% Day Change: 2.54 | |
| Week Change: 3.89% Year-to-date Change: -15.1% | |
| MTN Links: Profile News Message Board | |
| Charts:- Daily , Weekly | |
| Add MTN to Watchlist: View: Get Complete MTN Trend Analysis ➞ | |
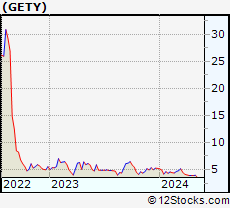 | GETY Getty Images Holdings, Inc. |
| Sector: Services & Goods | |
| SubSector: Internet Content & Information | |
| MarketCap: 1940 Millions | |
| Recent Price: 1.81 Smart Investing & Trading Score: 70 | |
| Day Percent Change: 8.79% Day Change: 0.29 | |
| Week Change: -1.08% Year-to-date Change: -15.3% | |
| GETY Links: Profile News Message Board | |
| Charts:- Daily , Weekly | |
| Add GETY to Watchlist: View: Get Complete GETY Trend Analysis ➞ | |
 | CMPR Cimpress plc |
| Sector: Services & Goods | |
| SubSector: Business Services | |
| MarketCap: 1675.02 Millions | |
| Recent Price: 59.06 Smart Investing & Trading Score: 80 | |
| Day Percent Change: 1.97% Day Change: 1.78 | |
| Week Change: 11.32% Year-to-date Change: -15.5% | |
| CMPR Links: Profile News Message Board | |
| Charts:- Daily , Weekly | |
| Add CMPR to Watchlist: View: Get Complete CMPR Trend Analysis ➞ | |
 | OLPX Olaplex Holdings, Inc. |
| Sector: Services & Goods | |
| SubSector: Specialty Retail | |
| MarketCap: 2340 Millions | |
| Recent Price: 1.41 Smart Investing & Trading Score: 56 | |
| Day Percent Change: -1.65% Day Change: -0.04 | |
| Week Change: 3.55% Year-to-date Change: -15.6% | |
| OLPX Links: Profile News Message Board | |
| Charts:- Daily , Weekly | |
| Add OLPX to Watchlist: View: Get Complete OLPX Trend Analysis ➞ | |
 | CNK Cinemark Holdings, Inc. |
| Sector: Services & Goods | |
| SubSector: Movie Production, Theaters | |
| MarketCap: 1776.29 Millions | |
| Recent Price: 25.62 Smart Investing & Trading Score: 40 | |
| Day Percent Change: 1.22% Day Change: 0.34 | |
| Week Change: 4.25% Year-to-date Change: -15.7% | |
| CNK Links: Profile News Message Board | |
| Charts:- Daily , Weekly | |
| Add CNK to Watchlist: View: Get Complete CNK Trend Analysis ➞ | |
 | ICFI ICF International, Inc. |
| Sector: Services & Goods | |
| SubSector: Management Services | |
| MarketCap: 1218.75 Millions | |
| Recent Price: 98.40 Smart Investing & Trading Score: 100 | |
| Day Percent Change: 2.37% Day Change: 3.77 | |
| Week Change: 9.94% Year-to-date Change: -16.1% | |
| ICFI Links: Profile News Message Board | |
| Charts:- Daily , Weekly | |
| Add ICFI to Watchlist: View: Get Complete ICFI Trend Analysis ➞ | |
 | AEO American Eagle Outfitters, Inc. |
| Sector: Services & Goods | |
| SubSector: Apparel Stores | |
| MarketCap: 1577.08 Millions | |
| Recent Price: 12.99 Smart Investing & Trading Score: 100 | |
| Day Percent Change: 4.23% Day Change: 0.9 | |
| Week Change: 5.46% Year-to-date Change: -16.3% | |
| AEO Links: Profile News Message Board | |
| Charts:- Daily , Weekly | |
| Add AEO to Watchlist: View: Get Complete AEO Trend Analysis ➞ | |
 | ZUMZ Zumiez Inc. |
| Sector: Services & Goods | |
| SubSector: Specialty Retail, Other | |
| MarketCap: 526.244 Millions | |
| Recent Price: 15.49 Smart Investing & Trading Score: 100 | |
| Day Percent Change: 4.9% Day Change: 1.36 | |
| Week Change: 8.93% Year-to-date Change: -16.6% | |
| ZUMZ Links: Profile News Message Board | |
| Charts:- Daily , Weekly | |
| Add ZUMZ to Watchlist: View: Get Complete ZUMZ Trend Analysis ➞ | |
 | PK Park Hotels & Resorts Inc. |
| Sector: Services & Goods | |
| SubSector: Lodging | |
| MarketCap: 2221.06 Millions | |
| Recent Price: 10.91 Smart Investing & Trading Score: 70 | |
| Day Percent Change: 1.78% Day Change: 0.27 | |
| Week Change: 7.92% Year-to-date Change: -16.7% | |
| PK Links: Profile News Message Board | |
| Charts:- Daily , Weekly | |
| Add PK to Watchlist: View: Get Complete PK Trend Analysis ➞ | |
 | SHAK Shake Shack Inc. |
| Sector: Services & Goods | |
| SubSector: Specialty Eateries | |
| MarketCap: 1497.67 Millions | |
| Recent Price: 106.95 Smart Investing & Trading Score: 0 | |
| Day Percent Change: 1.72% Day Change: 1.84 | |
| Week Change: -4.3% Year-to-date Change: -16.7% | |
| SHAK Links: Profile News Message Board | |
| Charts:- Daily , Weekly | |
| Add SHAK to Watchlist: View: Get Complete SHAK Trend Analysis ➞ | |
 | MCW Mister Car Wash, Inc. |
| Sector: Services & Goods | |
| SubSector: Personal Services | |
| MarketCap: 2790 Millions | |
| Recent Price: 5.93 Smart Investing & Trading Score: 50 | |
| Day Percent Change: 2.72% Day Change: 0.18 | |
| Week Change: 5.57% Year-to-date Change: -16.7% | |
| MCW Links: Profile News Message Board | |
| Charts:- Daily , Weekly | |
| Add MCW to Watchlist: View: Get Complete MCW Trend Analysis ➞ | |
 | CPRT Copart, Inc. |
| Sector: Services & Goods | |
| SubSector: Auto Dealerships | |
| MarketCap: 15462.1 Millions | |
| Recent Price: 47.08 Smart Investing & Trading Score: 40 | |
| Day Percent Change: 1.11% Day Change: 0.58 | |
| Week Change: 1.15% Year-to-date Change: -17.0% | |
| CPRT Links: Profile News Message Board | |
| Charts:- Daily , Weekly | |
| Add CPRT to Watchlist: View: Get Complete CPRT Trend Analysis ➞ | |
 | GDEN Golden Entertainment, Inc. |
| Sector: Services & Goods | |
| SubSector: Resorts & Casinos | |
| MarketCap: 130.794 Millions | |
| Recent Price: 24.88 Smart Investing & Trading Score: 0 | |
| Day Percent Change: -23.65% Day Change: -9.8 | |
| Week Change: -4.28% Year-to-date Change: -17.1% | |
| GDEN Links: Profile News Message Board | |
| Charts:- Daily , Weekly | |
| Add GDEN to Watchlist: View: Get Complete GDEN Trend Analysis ➞ | |
 | TSQ Townsquare Media, Inc. |
| Sector: Services & Goods | |
| SubSector: Broadcasting - Radio | |
| MarketCap: 101.795 Millions | |
| Recent Price: 7.02 Smart Investing & Trading Score: 40 | |
| Day Percent Change: 4.89% Day Change: 0.51 | |
| Week Change: 2.95% Year-to-date Change: -17.5% | |
| TSQ Links: Profile News Message Board | |
| Charts:- Daily , Weekly | |
| Add TSQ to Watchlist: View: Get Complete TSQ Trend Analysis ➞ | |
 | MSC Studio City International Holdings Limited |
| Sector: Services & Goods | |
| SubSector: Resorts & Casinos | |
| MarketCap: 1420.54 Millions | |
| Recent Price: 4.61 Smart Investing & Trading Score: 40 | |
| Day Percent Change: -6.16% Day Change: -0.4 | |
| Week Change: 7.14% Year-to-date Change: -17.7% | |
| MSC Links: Profile News Message Board | |
| Charts:- Daily , Weekly | |
| Add MSC to Watchlist: View: Get Complete MSC Trend Analysis ➞ | |
 | EXPO Exponent, Inc. |
| Sector: Services & Goods | |
| SubSector: Management Services | |
| MarketCap: 3605.95 Millions | |
| Recent Price: 69.25 Smart Investing & Trading Score: 10 | |
| Day Percent Change: 2.62% Day Change: 2.71 | |
| Week Change: 1.62% Year-to-date Change: -17.9% | |
| EXPO Links: Profile News Message Board | |
| Charts:- Daily , Weekly | |
| Add EXPO to Watchlist: View: Get Complete EXPO Trend Analysis ➞ | |
| For tabular summary view of above stock list: Summary View ➞ 0 - 25 , 25 - 50 , 50 - 75 , 75 - 100 , 100 - 125 , 125 - 150 , 150 - 175 , 175 - 200 , 200 - 225 , 225 - 250 , 250 - 275 , 275 - 300 , 300 - 325 , 325 - 350 , 350 - 375 , 375 - 400 , 400 - 425 | ||
| Click To Change The Sort Order: By Market Cap or Company Size Performance: Year-to-date, Week and Day | |
| Select Chart Type: | ||
|
Best Stocks Today 12Stocks.com |
© 2025 12Stocks.com Terms & Conditions Privacy Contact Us
All Information Provided Only For Education And Not To Be Used For Investing or Trading. See Terms & Conditions


One More Thing ... Get Best Stocks Delivered Daily!
Never Ever Miss A Move With Our Top Ten Stocks Lists
Find Best Stocks In Any Market - Bull or Bear Market
Take A Peek At Our Top Ten Stocks Lists: Daily, Weekly, Year-to-Date & Top Trends
Find Best Stocks In Any Market - Bull or Bear Market
Take A Peek At Our Top Ten Stocks Lists: Daily, Weekly, Year-to-Date & Top Trends
Consumer Services Stocks With Best Up Trends [0-bearish to 100-bullish]: Louisiana-Pacific [100], eBay [100], Graham [100], Fastenal [100], Wayfair [100], Gaia [100], Gray Television[100], Haverty Furniture[100], RealReal [100], Resideo Technologies[100], Holley [100]
Best Consumer Services Stocks Year-to-Date:
MedEquities Realty[294856%], WW [2516.54%], ThredUp [656.12%], Willdan [210.66%], Kratos Defense[160.61%], IHS Holding[134.93%], Yatsen Holding[133.67%], National Vision[122.84%], Roblox [119.12%], Altisource Portfolio[97.94%], Jumia Technologies[95.29%] Best Consumer Services Stocks This Week:
MedEquities Realty[411381%], Jumia Technologies[62.88%], Money[56.67%], Brilliant Earth[44.93%], Holley [35.82%], RealReal [35.65%], Willdan [34.44%], ATRenew [33.14%], Gray Television[33.03%], Arhaus [28.98%], Park-Ohio [27.27%] Best Consumer Services Stocks Daily:
CareDx [185.69%], Wingstop [150.46%], Spotify Technology[147.52%], National CineMedia[112.46%], VSE [69.41%], Burlington Stores[66.03%], Myriad Genetics[64.88%], Costco Wholesale[58.1%], Daily Journal[57.5%], Texas Roadhouse[55.27%], Royal Caribbean[53.63%]