
 Login Sign Up


| |||||
 |  | ||||

| 12Stocks.com Market Intelligence |
Best Consumer Services Stocks
| In a hurry? Services & Goods Stocks: Performance Trends Table, Stock Charts
Sort Consumer Services: Daily, Weekly, Year-to-Date, Market Cap & Trends. Filter Services & Goods stocks list by size: All Large Mid-Range Small |
| 12Stocks.com Consumer Services Stocks Performances & Trends Daily | |||||||||
|
|  The overall Smart Investing & Trading Score is 100 (0-bearish to 100-bullish) which puts Consumer Services sector in short term bullish trend. The Smart Investing & Trading Score from previous trading session is 100 and an improvement of trend continues.
| ||||||||
Here are the Smart Investing & Trading Scores of the most requested Consumer Services stocks at 12Stocks.com (click stock name for detailed review):
|


| Consider signing up for our daily 12Stocks.com "Best Stocks Newsletter". You will never ever miss a big stock move again! |
| 12Stocks.com: Investing in Consumer Services sector with Stocks | |
|
The following table helps investors and traders sort through current performance and trends (as measured by Smart Investing & Trading Score) of various
stocks in the Consumer Services sector. Quick View: Move mouse or cursor over stock symbol (ticker) to view short-term Technical chart and over stock name to view long term chart. Click on  to add stock symbol to your watchlist and to add stock symbol to your watchlist and  to view watchlist. Click on any ticker or stock name for detailed market intelligence report for that stock. to view watchlist. Click on any ticker or stock name for detailed market intelligence report for that stock. |
12Stocks.com Performance of Stocks in Consumer Services Sector
| Ticker | Stock Name | Watchlist | Category | Recent Price | Smart Investing & Trading Score | Change % | YTD Change% |
| DIS | Walt Disney |   | Entertainment | 115.39 | 60 | 2.76% | 5.20% |
| MGM | MGM Resorts | | Casinos | 35.92 | 80 | 0.44% | 5.19% |
| TIME | Time | | Publishing | 26.09 | 100 | 0.00% | 4.66% |
| SIG | Signet Jewelers | | Retail | 81.98 | 80 | 3.32% | 4.64% |
| SBUX | Starbucks | | Restaurants | 90.60 | 20 | 1.70% | 4.50% |
| EEX | Emerald Holding | | Services | 4.94 | 30 | 4.69% | 4.26% |
| CRAI | CRA | | Services | 183.75 | 20 | 53.26% | 3.98% |
| LI | Li Auto | | Auto Manufacturers | 24.19 | 20 | -0.45% | 3.79% |
| SCI | Service | | Services | 80.66 | 70 | 1.54% | 3.63% |
| INCR | Research | | Research | 1.63 | 70 | 3.43% | 3.14% |
| SHCO | Soho House | | Lodging | 7.64 | 90 | 0.50% | 2.82% |
| HTHT | Huazhu | | Lodging | 33.07 | 70 | -37.77% | 2.72% |
| BJRI | BJ s | | Restaurants | 35.11 | 50 | 3.08% | 2.63% |
| BZUN | Baozun | | Retail | 2.77 | 50 | -49.22% | 2.57% |
| KSS | Kohl s | | Department | 13.77 | 90 | 4.22% | 2.56% |
| GES | Guess | | Apparel | 13.20 | 30 | 2.82% | 2.49% |
| QSR | Restaurant Brands | | Restaurants | 65.29 | 30 | -1.05% | 2.41% |
| AMZN | Amazon.com | | Retail | 231.03 | 80 | 0.48% | 2.36% |
| SIRI | Sirius XM | | Broadcasting | 23.03 | 80 | 1.75% | 1.87% |
| VRRM | Verra Mobility | | Security | 24.29 | 30 | 1.79% | 1.74% |
| BIRD | Allbirds | | Apparel Retail | 7.03 | 63 | 4.92% | 1.51% |
| IMKTA | Ingles Markets | | Grocery | 64.17 | 70 | 1.98% | 1.32% |
| YI | 111 | | Drug Stores | 6.75 | 50 | 0.32% | 1.12% |
| MG | Mistras | | Security | 9.06 | 70 | 1.20% | 1.10% |
| PAYX | Paychex | | Staffing | 138.25 | 20 | 4.92% | 0.98% |
| For chart view version of above stock list: Chart View ➞ 0 - 25 , 25 - 50 , 50 - 75 , 75 - 100 , 100 - 125 , 125 - 150 , 150 - 175 , 175 - 200 , 200 - 225 , 225 - 250 , 250 - 275 , 275 - 300 , 300 - 325 , 325 - 350 , 350 - 375 , 375 - 400 , 400 - 425 | ||
 | Click To Change The Sort Order: By Market Cap or Company Size Performance: Year-to-date, Week and Day |  |
|
Get the most comprehensive stock market coverage daily at 12Stocks.com ➞ Best Stocks Today ➞ Best Stocks Weekly ➞ Best Stocks Year-to-Date ➞ Best Stocks Trends ➞  Best Stocks Today 12Stocks.com Best Nasdaq Stocks ➞ Best S&P 500 Stocks ➞ Best Tech Stocks ➞ Best Biotech Stocks ➞ |
| Detailed Overview of Consumer Services Stocks |
| Consumer Services Technical Overview, Leaders & Laggards, Top Consumer Services ETF Funds & Detailed Consumer Services Stocks List, Charts, Trends & More |
| Consumer Services Sector: Technical Analysis, Trends & YTD Performance | |
| Consumer Services sector is composed of stocks
from retail, entertainment, media/publishing, consumer goods
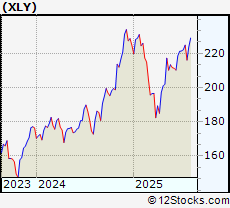
and services subsectors. Consumer Services sector, as represented by XLY, an exchange-traded fund [ETF] that holds basket of Consumer Services stocks (e.g, Walmart, Alibaba) is up by 2.95% and is currently underperforming the overall market by -7.38% year-to-date. Below is a quick view of Technical charts and trends: |
|
 XLY Weekly Chart |
|
| Long Term Trend: Very Good | |
| Medium Term Trend: Very Good | |
 XLY Daily Chart |
|
| Short Term Trend: Very Good | |
| Overall Trend Score: 100 | |
| YTD Performance: 2.95% | |
| **Trend Scores & Views Are Only For Educational Purposes And Not For Investing | |
| 12Stocks.com: Top Performing Consumer Services Sector Stocks | ||||||||||||||||||||||||||||||||||||||||||||||
 The top performing Consumer Services sector stocks year to date are
Now, more recently, over last week, the top performing Consumer Services sector stocks on the move are


|
||||||||||||||||||||||||||||||||||||||||||||||
| 12Stocks.com: Investing in Consumer Services Sector using Exchange Traded Funds | |
|
The following table shows list of key exchange traded funds (ETF) that
help investors track Consumer Services Index. For detailed view, check out our ETF Funds section of our website. Quick View: Move mouse or cursor over ETF symbol (ticker) to view short-term Technical chart and over ETF name to view long term chart. Click on ticker or stock name for detailed view. Click on to add stock symbol to your watchlist and to view watchlist. |
12Stocks.com List of ETFs that track Consumer Services Index
| Ticker | ETF Name | Watchlist | Recent Price | Smart Investing & Trading Score | Change % | Week % | Year-to-date % |
| XLY | Consumer Discret Sel | | 229.04 | 100 | 2.01 | 2.86 | 2.95% |
| RTH | Retail | | 247.72 | 100 | 0.63 | 0.8 | 10.46% |
| IYC | Consumer Services | | 102.72 | 100 | 1.68 | 2.04 | 7.35% |
| XRT | Retail | | 83.59 | 100 | 2.54 | 4.47 | 7.4% |
| IYK | Consumer Goods | | 70.21 | 40 | 0.37 | 1.49 | 8.38% |
| UCC | Consumer Services | | 49.53 | 100 | 2.96 | 5.78 | -2.73% |
| RETL | Retail Bull 3X | | 9.42 | 100 | 26.94 | 13.16 | 0.86% |
| RXI | Globl Consumer Discretionary | | 196.05 | 100 | 0.53 | 3.13 | 7.68% |
| SCC | Short Consumer Services | | 16.04 | 0 | -19.86 | -5.49 | -12.44% |
| UGE | Consumer Goods | | 18.79 | 20 | 1.05 | 2.4 | 7.27% |
| 12Stocks.com: Charts, Trends, Fundamental Data and Performances of Consumer Services Stocks | |
|
We now take in-depth look at all Consumer Services stocks including charts, multi-period performances and overall trends (as measured by Smart Investing & Trading Score). One can sort Consumer Services stocks (click link to choose) by Daily, Weekly and by Year-to-Date performances. Also, one can sort by size of the company or by market capitalization. |
| Select Your Default Chart Type: | |||||
| |||||
| Click on stock symbol or name for detailed view. Click on to add stock symbol to your watchlist and to view watchlist. Quick View: Move mouse or cursor over "Daily" to quickly view daily Technical stock chart and over "Weekly" to view weekly Technical stock chart. | |||||

 | DIS The Walt Disney Company |
| Sector: Services & Goods | |
| SubSector: Entertainment - Diversified | |
| MarketCap: 178396 Millions | |
| Recent Price: 115.39 Smart Investing & Trading Score: 60 | |
| Day Percent Change: 2.76% Day Change: 2.43 | |
| Week Change: 1.28% Year-to-date Change: 5.2% | |
| DIS Links: Profile News Message Board | |
| Charts:- Daily , Weekly | |
| Add DIS to Watchlist: View: Get Complete DIS Trend Analysis ➞ | |
 | MGM MGM Resorts International |
| Sector: Services & Goods | |
| SubSector: Resorts & Casinos | |
| MarketCap: 5315.04 Millions | |
| Recent Price: 35.92 Smart Investing & Trading Score: 80 | |
| Day Percent Change: 0.44% Day Change: 0.17 | |
| Week Change: 3.88% Year-to-date Change: 5.2% | |
| MGM Links: Profile News Message Board | |
| Charts:- Daily , Weekly | |
| Add MGM to Watchlist: View: Get Complete MGM Trend Analysis ➞ | |
 | TIME Time Inc. |
| Sector: Services & Goods | |
| SubSector: Publishing - Periodicals | |
| MarketCap: 1884.61 Millions | |
| Recent Price: 26.09 Smart Investing & Trading Score: 100 | |
| Day Percent Change: 0% Day Change: 0 | |
| Week Change: 1.08% Year-to-date Change: 4.7% | |
| TIME Links: Profile News Message Board | |
| Charts:- Daily , Weekly | |
| Add TIME to Watchlist: View: Get Complete TIME Trend Analysis ➞ | |
 | SIG Signet Jewelers Limited |
| Sector: Services & Goods | |
| SubSector: Jewelry Stores | |
| MarketCap: 518.1 Millions | |
| Recent Price: 81.98 Smart Investing & Trading Score: 80 | |
| Day Percent Change: 3.32% Day Change: 2.58 | |
| Week Change: 10.85% Year-to-date Change: 4.6% | |
| SIG Links: Profile News Message Board | |
| Charts:- Daily , Weekly | |
| Add SIG to Watchlist: View: Get Complete SIG Trend Analysis ➞ | |
 | SBUX Starbucks Corporation |
| Sector: Services & Goods | |
| SubSector: Specialty Eateries | |
| MarketCap: 74909.7 Millions | |
| Recent Price: 90.60 Smart Investing & Trading Score: 20 | |
| Day Percent Change: 1.7% Day Change: 1.57 | |
| Week Change: 5.83% Year-to-date Change: 4.5% | |
| SBUX Links: Profile News Message Board | |
| Charts:- Daily , Weekly | |
| Add SBUX to Watchlist: View: Get Complete SBUX Trend Analysis ➞ | |
 | EEX Emerald Holding, Inc. |
| Sector: Services & Goods | |
| SubSector: Business Services | |
| MarketCap: 252.682 Millions | |
| Recent Price: 4.94 Smart Investing & Trading Score: 30 | |
| Day Percent Change: 4.69% Day Change: 0.24 | |
| Week Change: -0.99% Year-to-date Change: 4.3% | |
| EEX Links: Profile News Message Board | |
| Charts:- Daily , Weekly | |
| Add EEX to Watchlist: View: Get Complete EEX Trend Analysis ➞ | |
 | CRAI CRA International, Inc. |
| Sector: Services & Goods | |
| SubSector: Management Services | |
| MarketCap: 209.645 Millions | |
| Recent Price: 183.75 Smart Investing & Trading Score: 20 | |
| Day Percent Change: 53.26% Day Change: 56.81 | |
| Week Change: 2.26% Year-to-date Change: 4.0% | |
| CRAI Links: Profile News Message Board | |
| Charts:- Daily , Weekly | |
| Add CRAI to Watchlist: View: Get Complete CRAI Trend Analysis ➞ | |
 | LI Li Auto Inc. |
| Sector: Services & Goods | |
| SubSector: Auto Manufacturers | |
| MarketCap: 29167 Millions | |
| Recent Price: 24.19 Smart Investing & Trading Score: 20 | |
| Day Percent Change: -0.45% Day Change: -0.1 | |
| Week Change: 2.89% Year-to-date Change: 3.8% | |
| LI Links: Profile News Message Board | |
| Charts:- Daily , Weekly | |
| Add LI to Watchlist: View: Get Complete LI Trend Analysis ➞ | |
 | SCI Service Corporation International |
| Sector: Services & Goods | |
| SubSector: Personal Services | |
| MarketCap: 7216.05 Millions | |
| Recent Price: 80.66 Smart Investing & Trading Score: 70 | |
| Day Percent Change: 1.54% Day Change: 1.17 | |
| Week Change: 3.68% Year-to-date Change: 3.6% | |
| SCI Links: Profile News Message Board | |
| Charts:- Daily , Weekly | |
| Add SCI to Watchlist: View: Get Complete SCI Trend Analysis ➞ | |
 | INCR INC Research Holdings, Inc. |
| Sector: Services & Goods | |
| SubSector: Research Services | |
| MarketCap: 2486.94 Millions | |
| Recent Price: 1.63 Smart Investing & Trading Score: 70 | |
| Day Percent Change: 3.43% Day Change: 0.07 | |
| Week Change: 12.71% Year-to-date Change: 3.1% | |
| INCR Links: Profile News Message Board | |
| Charts:- Daily , Weekly | |
| Add INCR to Watchlist: View: Get Complete INCR Trend Analysis ➞ | |
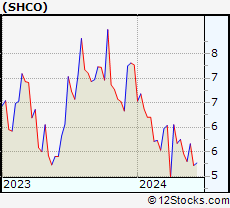 | SHCO Soho House & Co Inc. |
| Sector: Services & Goods | |
| SubSector: Lodging | |
| MarketCap: 1140 Millions | |
| Recent Price: 7.64 Smart Investing & Trading Score: 90 | |
| Day Percent Change: 0.5% Day Change: 0.03 | |
| Week Change: 18.03% Year-to-date Change: 2.8% | |
| SHCO Links: Profile News Message Board | |
| Charts:- Daily , Weekly | |
| Add SHCO to Watchlist: View: Get Complete SHCO Trend Analysis ➞ | |
 | HTHT Huazhu Group Limited |
| Sector: Services & Goods | |
| SubSector: Lodging | |
| MarketCap: 9164.46 Millions | |
| Recent Price: 33.07 Smart Investing & Trading Score: 70 | |
| Day Percent Change: -37.77% Day Change: -17.65 | |
| Week Change: 4.28% Year-to-date Change: 2.7% | |
| HTHT Links: Profile News Message Board | |
| Charts:- Daily , Weekly | |
| Add HTHT to Watchlist: View: Get Complete HTHT Trend Analysis ➞ | |
 | BJRI BJ s Restaurants, Inc. |
| Sector: Services & Goods | |
| SubSector: Restaurants | |
| MarketCap: 183.67 Millions | |
| Recent Price: 35.11 Smart Investing & Trading Score: 50 | |
| Day Percent Change: 3.08% Day Change: 0.98 | |
| Week Change: 5.53% Year-to-date Change: 2.6% | |
| BJRI Links: Profile News Message Board | |
| Charts:- Daily , Weekly | |
| Add BJRI to Watchlist: View: Get Complete BJRI Trend Analysis ➞ | |
 | BZUN Baozun Inc. |
| Sector: Services & Goods | |
| SubSector: Catalog & Mail Order Houses | |
| MarketCap: 1668.92 Millions | |
| Recent Price: 2.77 Smart Investing & Trading Score: 50 | |
| Day Percent Change: -49.22% Day Change: -2.22 | |
| Week Change: 3.33% Year-to-date Change: 2.6% | |
| BZUN Links: Profile News Message Board | |
| Charts:- Daily , Weekly | |
| Add BZUN to Watchlist: View: Get Complete BZUN Trend Analysis ➞ | |
 | KSS Kohl s Corporation |
| Sector: Services & Goods | |
| SubSector: Department Stores | |
| MarketCap: 3068 Millions | |
| Recent Price: 13.77 Smart Investing & Trading Score: 90 | |
| Day Percent Change: 4.22% Day Change: 0.8 | |
| Week Change: 19.15% Year-to-date Change: 2.6% | |
| KSS Links: Profile News Message Board | |
| Charts:- Daily , Weekly | |
| Add KSS to Watchlist: View: Get Complete KSS Trend Analysis ➞ | |
 | GES Guess , Inc. |
| Sector: Services & Goods | |
| SubSector: Apparel Stores | |
| MarketCap: 591.908 Millions | |
| Recent Price: 13.20 Smart Investing & Trading Score: 30 | |
| Day Percent Change: 2.82% Day Change: 0.59 | |
| Week Change: 0.44% Year-to-date Change: 2.5% | |
| GES Links: Profile News Message Board | |
| Charts:- Daily , Weekly | |
| Add GES to Watchlist: View: Get Complete GES Trend Analysis ➞ | |
 | QSR Restaurant Brands International Inc. |
| Sector: Services & Goods | |
| SubSector: Restaurants | |
| MarketCap: 9551 Millions | |
| Recent Price: 65.29 Smart Investing & Trading Score: 30 | |
| Day Percent Change: -1.05% Day Change: -0.75 | |
| Week Change: -4.49% Year-to-date Change: 2.4% | |
| QSR Links: Profile News Message Board | |
| Charts:- Daily , Weekly | |
| Add QSR to Watchlist: View: Get Complete QSR Trend Analysis ➞ | |
 | AMZN Amazon.com, Inc. |
| Sector: Services & Goods | |
| SubSector: Catalog & Mail Order Houses | |
| MarketCap: 998070 Millions | |
| Recent Price: 231.03 Smart Investing & Trading Score: 80 | |
| Day Percent Change: 0.48% Day Change: 0.85 | |
| Week Change: 1.01% Year-to-date Change: 2.4% | |
| AMZN Links: Profile News Message Board | |
| Charts:- Daily , Weekly | |
| Add AMZN to Watchlist: View: Get Complete AMZN Trend Analysis ➞ | |
 | SIRI Sirius XM Holdings Inc. |
| Sector: Services & Goods | |
| SubSector: Broadcasting - Radio | |
| MarketCap: 21325.5 Millions | |
| Recent Price: 23.03 Smart Investing & Trading Score: 80 | |
| Day Percent Change: 1.75% Day Change: 0.06 | |
| Week Change: 8.24% Year-to-date Change: 1.9% | |
| SIRI Links: Profile News Message Board | |
| Charts:- Daily , Weekly | |
| Add SIRI to Watchlist: View: Get Complete SIRI Trend Analysis ➞ | |
 | VRRM Verra Mobility Corporation |
| Sector: Services & Goods | |
| SubSector: Security & Protection Services | |
| MarketCap: 1265.03 Millions | |
| Recent Price: 24.29 Smart Investing & Trading Score: 30 | |
| Day Percent Change: 1.79% Day Change: 0.49 | |
| Week Change: -1.44% Year-to-date Change: 1.7% | |
| VRRM Links: Profile News Message Board | |
| Charts:- Daily , Weekly | |
| Add VRRM to Watchlist: View: Get Complete VRRM Trend Analysis ➞ | |
 | BIRD Allbirds, Inc. |
| Sector: Services & Goods | |
| SubSector: Apparel Retail | |
| MarketCap: 184 Millions | |
| Recent Price: 7.03 Smart Investing & Trading Score: 63 | |
| Day Percent Change: 4.92% Day Change: 0.04 | |
| Week Change: -30.77% Year-to-date Change: 1.5% | |
| BIRD Links: Profile News Message Board | |
| Charts:- Daily , Weekly | |
| Add BIRD to Watchlist: View: Get Complete BIRD Trend Analysis ➞ | |
 | IMKTA Ingles Markets, Incorporated |
| Sector: Services & Goods | |
| SubSector: Grocery Stores | |
| MarketCap: 827.075 Millions | |
| Recent Price: 64.17 Smart Investing & Trading Score: 70 | |
| Day Percent Change: 1.98% Day Change: 1.4 | |
| Week Change: 2.27% Year-to-date Change: 1.3% | |
| IMKTA Links: Profile News Message Board | |
| Charts:- Daily , Weekly | |
| Add IMKTA to Watchlist: View: Get Complete IMKTA Trend Analysis ➞ | |
 | YI 111, Inc. |
| Sector: Services & Goods | |
| SubSector: Drug Stores | |
| MarketCap: 520.351 Millions | |
| Recent Price: 6.75 Smart Investing & Trading Score: 50 | |
| Day Percent Change: 0.32% Day Change: 0 | |
| Week Change: -6.8% Year-to-date Change: 1.1% | |
| YI Links: Profile News Message Board | |
| Charts:- Daily , Weekly | |
| Add YI to Watchlist: View: Get Complete YI Trend Analysis ➞ | |
 | MG Mistras Group, Inc. |
| Sector: Services & Goods | |
| SubSector: Security & Protection Services | |
| MarketCap: 136.903 Millions | |
| Recent Price: 9.06 Smart Investing & Trading Score: 70 | |
| Day Percent Change: 1.2% Day Change: 0.14 | |
| Week Change: 14.93% Year-to-date Change: 1.1% | |
| MG Links: Profile News Message Board | |
| Charts:- Daily , Weekly | |
| Add MG to Watchlist: View: Get Complete MG Trend Analysis ➞ | |
 | PAYX Paychex, Inc. |
| Sector: Services & Goods | |
| SubSector: Staffing & Outsourcing Services | |
| MarketCap: 20928.8 Millions | |
| Recent Price: 138.25 Smart Investing & Trading Score: 20 | |
| Day Percent Change: 4.92% Day Change: 6.1 | |
| Week Change: -0.34% Year-to-date Change: 1.0% | |
| PAYX Links: Profile News Message Board | |
| Charts:- Daily , Weekly | |
| Add PAYX to Watchlist: View: Get Complete PAYX Trend Analysis ➞ | |
| For tabular summary view of above stock list: Summary View ➞ 0 - 25 , 25 - 50 , 50 - 75 , 75 - 100 , 100 - 125 , 125 - 150 , 150 - 175 , 175 - 200 , 200 - 225 , 225 - 250 , 250 - 275 , 275 - 300 , 300 - 325 , 325 - 350 , 350 - 375 , 375 - 400 , 400 - 425 | ||
| Click To Change The Sort Order: By Market Cap or Company Size Performance: Year-to-date, Week and Day | |
| Select Chart Type: | ||
|
Best Stocks Today 12Stocks.com |
© 2025 12Stocks.com Terms & Conditions Privacy Contact Us
All Information Provided Only For Education And Not To Be Used For Investing or Trading. See Terms & Conditions


One More Thing ... Get Best Stocks Delivered Daily!
Never Ever Miss A Move With Our Top Ten Stocks Lists
Find Best Stocks In Any Market - Bull or Bear Market
Take A Peek At Our Top Ten Stocks Lists: Daily, Weekly, Year-to-Date & Top Trends
Find Best Stocks In Any Market - Bull or Bear Market
Take A Peek At Our Top Ten Stocks Lists: Daily, Weekly, Year-to-Date & Top Trends
Consumer Services Stocks With Best Up Trends [0-bearish to 100-bullish]: Louisiana-Pacific [100], eBay [100], Graham [100], Fastenal [100], Wayfair [100], Gaia [100], Gray Television[100], Haverty Furniture[100], RealReal [100], Resideo Technologies[100], Holley [100]
Best Consumer Services Stocks Year-to-Date:
MedEquities Realty[294856%], WW [2516.54%], ThredUp [656.12%], Willdan [210.66%], Kratos Defense[160.61%], IHS Holding[134.93%], Yatsen Holding[133.67%], National Vision[122.84%], Roblox [119.12%], Altisource Portfolio[97.94%], Jumia Technologies[95.29%] Best Consumer Services Stocks This Week:
MedEquities Realty[411381%], Jumia Technologies[62.88%], Money[56.67%], Brilliant Earth[44.93%], Holley [35.82%], RealReal [35.65%], Willdan [34.44%], ATRenew [33.14%], Gray Television[33.03%], Arhaus [28.98%], Park-Ohio [27.27%] Best Consumer Services Stocks Daily:
CareDx [185.69%], Wingstop [150.46%], Spotify Technology[147.52%], National CineMedia[112.46%], VSE [69.41%], Burlington Stores[66.03%], Myriad Genetics[64.88%], Costco Wholesale[58.1%], Daily Journal[57.5%], Texas Roadhouse[55.27%], Royal Caribbean[53.63%]