
 Login Sign Up


| |||||
 |  | ||||

| 12Stocks.com Market Intelligence |
Best Biotech Stocks
|
|
| Quick Read: Best Biotech Stocks List By Performances & Trends: Daily, Weekly, Year-to-Date, Market Cap (Size) & Technical Trends | |||
| Best Biotech Stocks Views: Quick Browse View, Summary & Slide Show View | |||
| 12Stocks.com Biotech Stocks Performances & Trends Daily | |||||||||
|
|  The overall market intelligence score is 100 (0-bearish to 100-bullish) which puts Biotech sector in short term bullish trend. The market intelligence score from previous trading session is 90 and an improvement of trend continues.
| ||||||||
Here are the market intelligence trend scores of the most requested Biotech stocks at 12Stocks.com (click stock name for detailed review):
|


| 12Stocks.com: Investing in Biotech sector with Stocks | |
|
The following table helps investors and traders sort through current performance and trends (as measured by market intelligence score) of various
stocks in the Biotech sector. Quick View: Move mouse or cursor over stock symbol (ticker) to view short-term Technical chart and over stock name to view long term chart. Click on  to add stock symbol to your watchlist and to add stock symbol to your watchlist and  to view watchlist. Click on any ticker or stock name for detailed market intelligence report for that stock. to view watchlist. Click on any ticker or stock name for detailed market intelligence report for that stock. |
12Stocks.com Performance of Stocks in Biotech Sector
| Ticker | Stock Name | Watchlist | Category | Recent Price | Market Intelligence Score | Change % | YTD Change% |
| SANA | Sana nology |   | Biotechnology | 3.98 | 90 | 7.57% | 141.21% |
| ARCT | Arcturus | | Biotechnology | 21.92 | 90 | 7.03% | 28.41% |
| IVA | Inventiva ADR | | Biotechnology | 6.25 | 90 | 5.67% | 191.82% |
| NBTX | Nanobiotix ADR | | Biotechnology | 19.76 | 90 | 5.44% | 581.38% |
| ALEC | Alector | | Biotechnology | 3.16 | 90 | 5.33% | 67.20% |
| STOK | Stoke | | Biotechnology | 24.82 | 90 | 5.21% | 120.23% |
| PRQR | ProQR | | Biotechnology | 2.25 | 90 | 4.17% | -17.88% |
| ALLO | Allogene | | Biotechnology | 1.29 | 90 | 4.03% | -41.36% |
| PRAX | Praxis Precision | | Biotechnology | 55.15 | 90 | 4.02% | -30.65% |
| PRTK | Paratek | | Biotechnology | 58.01 | 90 | 3.83% | 0.00% |
| INSM | Insmed | | Biotechnology | 152.83 | 90 | 3.77% | 118.49% |
| XERS | Xeris Biopharma | | Biotechnology | 8.31 | 90 | 3.75% | 140.17% |
| PDLI | PDL BioPharma | | Biotechnology | 22.03 | 90 | 3.23% | 0.00% |
| NKTR | Nektar | | Biotechnology | 60.52 | 90 | 2.84% | 319.84% |
| NKTX | Nkarta | | Biotechnology | 2.19 | 90 | 2.82% | -12.40% |
| MRNA | Moderna | | Biotechnology | 28.37 | 90 | 2.79% | -32.45% |
| CDTX | Cidara | | Biotechnology | 98.50 | 90 | 2.24% | 260.81% |
| ONCE | Spark | | Biotechnology | 13.03 | 90 | 2.12% | 0.00% |
| CAPR | Capricor | | Biotechnology | 7.98 | 90 | 2.05% | -46.66% |
| DNLI | Denali | | Biotechnology | 15.21 | 90 | 2.01% | -27.02% |
| ALXN | Alexion | | Biotechnology | 834.36 | 90 | 1.91% | 0.00% |
| GLUE | Monte Rosa | | Biotechnology | 7.63 | 90 | 1.73% | 7.31% |
| CFRX | ContraFect | | Biotechnology | 10.75 | 90 | 1.42% | 0.00% |
| VERA | Vera | | Biotechnology | 29.19 | 90 | 1.39% | -30.83% |
| IMNM | Immunome | | Biotechnology | 11.48 | 90 | 1.23% | 9.02% |
| To view more stocks, click on Next / Previous arrows or select different range: 0 - 25 , 25 - 50 , 50 - 75 , 75 - 100 , 100 - 125 , 125 - 150 , 150 - 175 , 175 - 200 , 200 - 225 , 225 - 250 , 250 - 275 , 275 - 300 , 300 - 325 , 325 - 350 , 350 - 375 , 375 - 400 , 400 - 425 , 425 - 450 , 450 - 475 | ||
 | Click To Change The Sort Order: By Market Cap or Company Size Performance: Year-to-date, Week and Day |  |
|
Get the most comprehensive stock market coverage daily at 12Stocks.com ➞ Best Stocks Today ➞ Best Stocks Weekly ➞ Best Stocks Year-to-Date ➞ Best Stocks Trends ➞  Best Stocks Today 12Stocks.com Best Nasdaq Stocks ➞ Best S&P 500 Stocks ➞ Best Tech Stocks ➞ Best Biotech Stocks ➞ |
| Detailed Overview of Biotech Stocks |
| Biotech Technical Overview, Leaders & Laggards, Top Biotech ETF Funds & Detailed Biotech Stocks List, Charts, Trends & More |
| Biotech Sector: Technical Analysis, Trends & YTD Performance | |
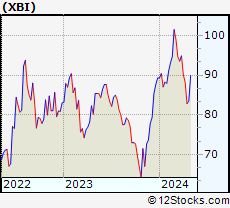
| Biotech sector, as represented by XBI, an exchange-traded fund [ETF] that holds basket of Biotech stocks (e.g, Amgen, Celgene) is up by 12.1001% and is currently underperforming the overall market by -2.6578% year-to-date. Below is a quick view of Technical charts and trends: | |
 XBI Weekly Chart |
|
| Long Term Trend: Very Good | |
| Medium Term Trend: Very Good | |
 XBI Daily Chart |
|
| Short Term Trend: Very Good | |
| Overall Trend Score: 100 | |
| YTD Performance: 12.1001% | |
| **Trend Scores & Views Are Only For Educational Purposes And Not For Investing | |
| 12Stocks.com: Top Performing Biotech Sector Stocks | ||||||||||||||||||||||||||||||||||||||||||||||
 The top performing Biotech sector stocks year to date are
Now, more recently, over last week, the top performing Biotech sector stocks on the move are


|
||||||||||||||||||||||||||||||||||||||||||||||
| 12Stocks.com: Investing in Biotech Sector using Exchange Traded Funds | |
|
The following table shows list of key exchange traded funds (ETF) that
help investors track Biotech Index. For detailed view, check out our ETF Funds section of our website. Quick View: Move mouse or cursor over ETF symbol (ticker) to view short-term Technical chart and over ETF name to view long term chart. Click on ticker or stock name for detailed view. Click on to add stock symbol to your watchlist and to view watchlist. |
12Stocks.com List of ETFs that track Biotech Index
| Ticker | ETF Name | Watchlist | Recent Price | Market Intelligence Score | Change % | Week % | Year-to-date % |
| UBIO | Biotechnology | | 73.34 | 80 | -0.0681292 | 260.748 | 0% |
| HCRF | Edge Multifactor | | 67.14 | 23 | 0 | 9999 | NA |
| SICK | Healthcare Bear 3X | | 37.90 | 36 | 0 | 9999 | NA |
| LABS | Biotech Bear 1X | | 24.18 | 56 | 0 | 9999 | NA |
| BTEC | Principal Healthcare Innovators | | 39.49 | 30 | 0 | 1.02328 | 0% |
| 12Stocks.com: Charts, Trends, Fundamental Data and Performances of Biotech Stocks | |
|
We now take in-depth look at all Biotech stocks including charts, multi-period performances and overall trends (as measured by market intelligence score). One can sort Biotech stocks (click link to choose) by Daily, Weekly and by Year-to-Date performances. Also, one can sort by size of the company or by market capitalization. |
| Select Your Default Chart Type: | |||||
| |||||
| Click on stock symbol or name for detailed view. Click on to add stock symbol to your watchlist and to view watchlist. Quick View: Move mouse or cursor over "Daily" to quickly view daily Technical stock chart and over "Weekly" to view weekly Technical stock chart. | |||||

 | SANA Sana Biotechnology Inc |
| Sector: Health Care | |
| SubSector: Biotechnology | |
| MarketCap: 765.76 Millions | |
| Recent Price: 3.98 Market Intelligence Score: 90 | |
| Day Percent Change: 7.56757% Day Change: 0.13 | |
| Week Change: 16.7155% Year-to-date Change: 141.2% | |
| SANA Links: Profile News Message Board | |
| Charts:- Daily , Weekly | |
| Add SANA to Watchlist: View: Get Complete SANA Trend Analysis ➞ | |
 | ARCT Arcturus Therapeutics Holdings Inc |
| Sector: Health Care | |
| SubSector: Biotechnology | |
| MarketCap: 484.71 Millions | |
| Recent Price: 21.92 Market Intelligence Score: 90 | |
| Day Percent Change: 7.03125% Day Change: 0.12 | |
| Week Change: 7.18826% Year-to-date Change: 28.4% | |
| ARCT Links: Profile News Message Board | |
| Charts:- Daily , Weekly | |
| Add ARCT to Watchlist: View: Get Complete ARCT Trend Analysis ➞ | |
 | IVA Inventiva ADR |
| Sector: Health Care | |
| SubSector: Biotechnology | |
| MarketCap: 774.84 Millions | |
| Recent Price: 6.25 Market Intelligence Score: 90 | |
| Day Percent Change: 5.66836% Day Change: -0.32 | |
| Week Change: 13.1341% Year-to-date Change: 191.8% | |
| IVA Links: Profile News Message Board | |
| Charts:- Daily , Weekly | |
| Add IVA to Watchlist: View: Get Complete IVA Trend Analysis ➞ | |
 | NBTX Nanobiotix ADR |
| Sector: Health Care | |
| SubSector: Biotechnology | |
| MarketCap: 416.9 Millions | |
| Recent Price: 19.76 Market Intelligence Score: 90 | |
| Day Percent Change: 5.4429% Day Change: 1.21 | |
| Week Change: 20.1946% Year-to-date Change: 581.4% | |
| NBTX Links: Profile News Message Board | |
| Charts:- Daily , Weekly | |
| Add NBTX to Watchlist: View: Get Complete NBTX Trend Analysis ➞ | |
 | ALEC Alector Inc |
| Sector: Health Care | |
| SubSector: Biotechnology | |
| MarketCap: 304.65 Millions | |
| Recent Price: 3.16 Market Intelligence Score: 90 | |
| Day Percent Change: 5.33333% Day Change: 0.07 | |
| Week Change: 0% Year-to-date Change: 67.2% | |
| ALEC Links: Profile News Message Board | |
| Charts:- Daily , Weekly | |
| Add ALEC to Watchlist: View: Get Complete ALEC Trend Analysis ➞ | |
 | STOK Stoke Therapeutics Inc |
| Sector: Health Care | |
| SubSector: Biotechnology | |
| MarketCap: 1133.21 Millions | |
| Recent Price: 24.82 Market Intelligence Score: 90 | |
| Day Percent Change: 5.21407% Day Change: 0.36 | |
| Week Change: 8.62144% Year-to-date Change: 120.2% | |
| STOK Links: Profile News Message Board | |
| Charts:- Daily , Weekly | |
| Add STOK to Watchlist: View: Get Complete STOK Trend Analysis ➞ | |
 | PRQR ProQR Therapeutics N.V |
| Sector: Health Care | |
| SubSector: Biotechnology | |
| MarketCap: 257.77 Millions | |
| Recent Price: 2.25 Market Intelligence Score: 90 | |
| Day Percent Change: 4.16667% Day Change: 0.07 | |
| Week Change: 4.16667% Year-to-date Change: -17.9% | |
| PRQR Links: Profile News Message Board | |
| Charts:- Daily , Weekly | |
| Add PRQR to Watchlist: View: Get Complete PRQR Trend Analysis ➞ | |
 | ALLO Allogene Therapeutics Inc |
| Sector: Health Care | |
| SubSector: Biotechnology | |
| MarketCap: 255.16 Millions | |
| Recent Price: 1.29 Market Intelligence Score: 90 | |
| Day Percent Change: 4.03226% Day Change: 0.06 | |
| Week Change: 4.87805% Year-to-date Change: -41.4% | |
| ALLO Links: Profile News Message Board | |
| Charts:- Daily , Weekly | |
| Add ALLO to Watchlist: View: Get Complete ALLO Trend Analysis ➞ | |
 | PRAX Praxis Precision Medicines Inc |
| Sector: Health Care | |
| SubSector: Biotechnology | |
| MarketCap: 985.99 Millions | |
| Recent Price: 55.15 Market Intelligence Score: 90 | |
| Day Percent Change: 4.01735% Day Change: 1.13 | |
| Week Change: 12.62% Year-to-date Change: -30.6% | |
| PRAX Links: Profile News Message Board | |
| Charts:- Daily , Weekly | |
| Add PRAX to Watchlist: View: Get Complete PRAX Trend Analysis ➞ | |
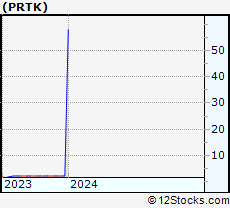 | PRTK Paratek Pharmaceuticals, Inc. |
| Sector: Health Care | |
| SubSector: Biotechnology | |
| MarketCap: 151.185 Millions | |
| Recent Price: 58.01 Market Intelligence Score: 90 | |
| Day Percent Change: 3.83032% Day Change: -9999 | |
| Week Change: 2501.35% Year-to-date Change: 0.0% | |
| PRTK Links: Profile News Message Board | |
| Charts:- Daily , Weekly | |
| Add PRTK to Watchlist: View: Get Complete PRTK Trend Analysis ➞ | |
 | INSM Insmed Inc |
| Sector: Health Care | |
| SubSector: Biotechnology | |
| MarketCap: 30670.5 Millions | |
| Recent Price: 152.83 Market Intelligence Score: 90 | |
| Day Percent Change: 3.76833% Day Change: 3.15 | |
| Week Change: 8.39007% Year-to-date Change: 118.5% | |
| INSM Links: Profile News Message Board | |
| Charts:- Daily , Weekly | |
| Add INSM to Watchlist: View: Get Complete INSM Trend Analysis ➞ | |
 | XERS Xeris Biopharma Holdings Inc |
| Sector: Health Care | |
| SubSector: Biotechnology | |
| MarketCap: 1267.62 Millions | |
| Recent Price: 8.31 Market Intelligence Score: 90 | |
| Day Percent Change: 3.74532% Day Change: 0.02 | |
| Week Change: 3.875% Year-to-date Change: 140.2% | |
| XERS Links: Profile News Message Board | |
| Charts:- Daily , Weekly | |
| Add XERS to Watchlist: View: Get Complete XERS Trend Analysis ➞ | |
 | PDLI PDL BioPharma, Inc. |
| Sector: Health Care | |
| SubSector: Biotechnology | |
| MarketCap: 310.085 Millions | |
| Recent Price: 22.03 Market Intelligence Score: 90 | |
| Day Percent Change: 3.23336% Day Change: -9999 | |
| Week Change: 112.645% Year-to-date Change: 0.0% | |
| PDLI Links: Profile News Message Board | |
| Charts:- Daily , Weekly | |
| Add PDLI to Watchlist: View: Get Complete PDLI Trend Analysis ➞ | |
 | NKTR Nektar Therapeutics |
| Sector: Health Care | |
| SubSector: Biotechnology | |
| MarketCap: 764.17 Millions | |
| Recent Price: 60.52 Market Intelligence Score: 90 | |
| Day Percent Change: 2.83772% Day Change: 1.05 | |
| Week Change: 0.314935% Year-to-date Change: 319.8% | |
| NKTR Links: Profile News Message Board | |
| Charts:- Daily , Weekly | |
| Add NKTR to Watchlist: View: Get Complete NKTR Trend Analysis ➞ | |
 | NKTX Nkarta Inc |
| Sector: Health Care | |
| SubSector: Biotechnology | |
| MarketCap: 160.52 Millions | |
| Recent Price: 2.19 Market Intelligence Score: 90 | |
| Day Percent Change: 2.8169% Day Change: 0.06 | |
| Week Change: 6.31068% Year-to-date Change: -12.4% | |
| NKTX Links: Profile News Message Board | |
| Charts:- Daily , Weekly | |
| Add NKTX to Watchlist: View: Get Complete NKTX Trend Analysis ➞ | |
 | MRNA Moderna Inc |
| Sector: Health Care | |
| SubSector: Biotechnology | |
| MarketCap: 9781.46 Millions | |
| Recent Price: 28.37 Market Intelligence Score: 90 | |
| Day Percent Change: 2.78986% Day Change: 0.35 | |
| Week Change: 9.62133% Year-to-date Change: -32.5% | |
| MRNA Links: Profile News Message Board | |
| Charts:- Daily , Weekly | |
| Add MRNA to Watchlist: View: Get Complete MRNA Trend Analysis ➞ | |
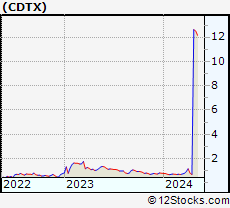 | CDTX Cidara Therapeutics Inc |
| Sector: Health Care | |
| SubSector: Biotechnology | |
| MarketCap: 1601.87 Millions | |
| Recent Price: 98.50 Market Intelligence Score: 90 | |
| Day Percent Change: 2.24206% Day Change: 2.46 | |
| Week Change: 11.1989% Year-to-date Change: 260.8% | |
| CDTX Links: Profile News Message Board | |
| Charts:- Daily , Weekly | |
| Add CDTX to Watchlist: View: Get Complete CDTX Trend Analysis ➞ | |
 | ONCE Spark Therapeutics, Inc. |
| Sector: Health Care | |
| SubSector: Biotechnology | |
| MarketCap: 1823.08 Millions | |
| Recent Price: 13.03 Market Intelligence Score: 90 | |
| Day Percent Change: 2.11599% Day Change: -9999 | |
| Week Change: 19.9816% Year-to-date Change: 0.0% | |
| ONCE Links: Profile News Message Board | |
| Charts:- Daily , Weekly | |
| Add ONCE to Watchlist: View: Get Complete ONCE Trend Analysis ➞ | |
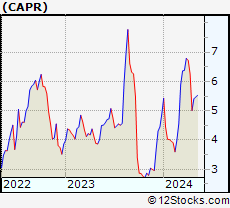 | CAPR Capricor Therapeutics Inc |
| Sector: Health Care | |
| SubSector: Biotechnology | |
| MarketCap: 308.13 Millions | |
| Recent Price: 7.98 Market Intelligence Score: 90 | |
| Day Percent Change: 2.04604% Day Change: -0.16 | |
| Week Change: 28.9176% Year-to-date Change: -46.7% | |
| CAPR Links: Profile News Message Board | |
| Charts:- Daily , Weekly | |
| Add CAPR to Watchlist: View: Get Complete CAPR Trend Analysis ➞ | |
 | DNLI Denali Therapeutics Inc |
| Sector: Health Care | |
| SubSector: Biotechnology | |
| MarketCap: 2256.06 Millions | |
| Recent Price: 15.21 Market Intelligence Score: 90 | |
| Day Percent Change: 2.01207% Day Change: 0.72 | |
| Week Change: 12.8338% Year-to-date Change: -27.0% | |
| DNLI Links: Profile News Message Board | |
| Charts:- Daily , Weekly | |
| Add DNLI to Watchlist: View: Get Complete DNLI Trend Analysis ➞ | |
 | ALXN Alexion Pharmaceuticals, Inc. |
| Sector: Health Care | |
| SubSector: Biotechnology | |
| MarketCap: 19427 Millions | |
| Recent Price: 834.36 Market Intelligence Score: 90 | |
| Day Percent Change: 1.90781% Day Change: -9999 | |
| Week Change: 357.184% Year-to-date Change: 0.0% | |
| ALXN Links: Profile News Message Board | |
| Charts:- Daily , Weekly | |
| Add ALXN to Watchlist: View: Get Complete ALXN Trend Analysis ➞ | |
 | GLUE Monte Rosa Therapeutics Inc |
| Sector: Health Care | |
| SubSector: Biotechnology | |
| MarketCap: 305.09 Millions | |
| Recent Price: 7.63 Market Intelligence Score: 90 | |
| Day Percent Change: 1.73333% Day Change: 0.07 | |
| Week Change: 15.2568% Year-to-date Change: 7.3% | |
| GLUE Links: Profile News Message Board | |
| Charts:- Daily , Weekly | |
| Add GLUE to Watchlist: View: Get Complete GLUE Trend Analysis ➞ | |
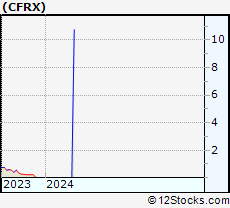 | CFRX ContraFect Corporation |
| Sector: Health Care | |
| SubSector: Biotechnology | |
| MarketCap: 126.685 Millions | |
| Recent Price: 10.75 Market Intelligence Score: 90 | |
| Day Percent Change: 1.41509% Day Change: -9999 | |
| Week Change: 47677.8% Year-to-date Change: 0.0% | |
| CFRX Links: Profile News Message Board | |
| Charts:- Daily , Weekly | |
| Add CFRX to Watchlist: View: Get Complete CFRX Trend Analysis ➞ | |
 | VERA Vera Therapeutics Inc |
| Sector: Health Care | |
| SubSector: Biotechnology | |
| MarketCap: 1543.89 Millions | |
| Recent Price: 29.19 Market Intelligence Score: 90 | |
| Day Percent Change: 1.38937% Day Change: 0.51 | |
| Week Change: 11.6679% Year-to-date Change: -30.8% | |
| VERA Links: Profile News Message Board | |
| Charts:- Daily , Weekly | |
| Add VERA to Watchlist: View: Get Complete VERA Trend Analysis ➞ | |
 | IMNM Immunome Inc |
| Sector: Health Care | |
| SubSector: Biotechnology | |
| MarketCap: 915.71 Millions | |
| Recent Price: 11.48 Market Intelligence Score: 90 | |
| Day Percent Change: 1.23457% Day Change: 0.38 | |
| Week Change: 2.5% Year-to-date Change: 9.0% | |
| IMNM Links: Profile News Message Board | |
| Charts:- Daily , Weekly | |
| Add IMNM to Watchlist: View: Get Complete IMNM Trend Analysis ➞ | |
| To view more stocks, click on Next / Previous arrows or select different range: 0 - 25 , 25 - 50 , 50 - 75 , 75 - 100 , 100 - 125 , 125 - 150 , 150 - 175 , 175 - 200 , 200 - 225 , 225 - 250 , 250 - 275 , 275 - 300 , 300 - 325 , 325 - 350 , 350 - 375 , 375 - 400 , 400 - 425 , 425 - 450 , 450 - 475 | ||
| Click To Change The Sort Order: By Market Cap or Company Size Performance: Year-to-date, Week and Day | |
| Select Chart Type: | ||
|
Best Stocks Today 12Stocks.com |
© 2025 12Stocks.com Terms & Conditions Privacy Contact Us
All Information Provided Only For Education And Not To Be Used For Investing or Trading. See Terms & Conditions


One More Thing ... Get Best Stocks Delivered Daily!
Never Ever Miss A Move With Our Top Ten Stocks Lists
Find Best Stocks In Any Market - Bull or Bear Market
Take A Peek At Our Top Ten Stocks Lists: Daily, Weekly, Year-to-Date & Top Trends
Find Best Stocks In Any Market - Bull or Bear Market
Take A Peek At Our Top Ten Stocks Lists: Daily, Weekly, Year-to-Date & Top Trends
Biotech Stocks With Best Up Trends [0-bearish to 100-bullish]: Taysha Gene[100], DBV Technologies[100], Valneva SE[100], Prime Medicine[100], AlloVir [100], Sarepta [100], Monopar [100], Cara [100], Absci Corp[100], Spruce [100], Cabaletta Bio[100]
Best Biotech Stocks Year-to-Date:
Kaleido [9900%], Vor Biopharma[3175%], Nanobiotix ADR[581.379%], I-Mab ADR[357.506%], Monopar [337.489%], Nektar [319.84%], DBV Technologies[276.923%], Celcuity [276.39%], Galectin [263.248%], Cidara [260.806%], Lineage Cell[233.981%] Best Biotech Stocks This Week:
Athersys [193287%], VBI Vaccines[86898.5%], ContraFect [47677.8%], Clovis Oncology[39610.5%], NanoString Technologies[17224.7%], Neptune Wellness[14100%], Achillion [10033.3%], Kaleido [9900%], Nymox [8258.49%], Epizyme [5739.46%], Portola [4717.55%] Best Biotech Stocks Daily:
Kaleido [9900%], Neoleukin [332.665%], Syros [226.23%], Athenex [103.333%], Taysha Gene[53.4591%], DBV Technologies[21.6485%], Valneva SE[20.197%], Prime Medicine[19.4097%], Aptose [17.5439%], AlloVir [16.9215%], Sarepta [15.6832%]