
 Login Sign Up


| |||||
 |  | ||||

| 12Stocks.com Market Intelligence |
Best Biotech Stocks
|
|
| Quick Read: Best Biotech Stocks List By Performances & Trends: Daily, Weekly, Year-to-Date, Market Cap (Size) & Technical Trends | |||
| Best Biotech Stocks Views: Quick Browse View, Summary & Slide Show View | |||
| 12Stocks.com Biotech Stocks Performances & Trends Daily | |||||||||
|
|  The overall market intelligence score is 0 (0-bearish to 100-bullish) which puts Biotech sector in short term bearish trend. The market intelligence score from previous trading session is 26 and a deterioration of trend continues.
| ||||||||
Here are the market intelligence trend scores of the most requested Biotech stocks at 12Stocks.com (click stock name for detailed review):
|


| 12Stocks.com: Investing in Biotech sector with Stocks | |
|
The following table helps investors and traders sort through current performance and trends (as measured by market intelligence score) of various
stocks in the Biotech sector. Quick View: Move mouse or cursor over stock symbol (ticker) to view short-term Technical chart and over stock name to view long term chart. Click on  to add stock symbol to your watchlist and to add stock symbol to your watchlist and  to view watchlist. Click on any ticker or stock name for detailed market intelligence report for that stock. to view watchlist. Click on any ticker or stock name for detailed market intelligence report for that stock. |
12Stocks.com Performance of Stocks in Biotech Sector
| Ticker | Stock Name | Watchlist | Category | Recent Price | Market Intelligence Score | Change % | YTD Change% |
| CERS | Cerus |   | Biotechnology | 1.64 | 20 | 0.00% | -24.07% |
| NVAX | Novavax | | Biotechnology | 3.89 | 20 | 0.00% | -18.96% |
| GNLX | Genelux | | Biotechnology | 3.62 | 20 | 0.00% | -76.25% |
| FGEN | FibroGen | | Biotechnology | 1.17 | 20 | -7.87% | 32.01% |
| DYN | Dyne | | Biotechnology | 23.65 | 20 | -4.71% | 77.82% |
| FATE | Fate | | Biotechnology | 5.04 | 20 | -4.36% | 34.76% |
| REPL | Replimune | | Biotechnology | 6.97 | 20 | -3.33% | -17.32% |
| KZR | Kezar Life | | Biotechnology | 0.79 | 20 | -3.31% | -16.66% |
| MNOV | MediciNova | | Biotechnology | 1.40 | 20 | -2.10% | -6.67% |
| PTCT | PTC | | Biotechnology | 24.69 | 20 | -1.87% | -10.41% |
| GOSS | Gossamer Bio | | Biotechnology | 0.81 | 20 | -1.71% | -11.67% |
| SLRN | Acelyrin | | Biotechnology | 4.96 | 20 | -1.29% | -32.77% |
| PIRS | Pieris | | Biotechnology | 0.16 | 20 | -1.21% | -14.73% |
| HRMY | Harmony | | Biotechnology | 29.05 | 20 | -0.48% | -10.03% |
| BNTX | BioNTech SE | | Biotechnology | 86.17 | 20 | -0.27% | -18.35% |
| APLM | Apollomics | | Biotechnology | 0.53 | 20 | -0.19% | -42.96% |
| KALA | Kala | | Biotechnology | 6.83 | 20 | -0.12% | -2.43% |
| AKBA | Akebia | | Biotechnology | 1.39 | 18 | 0.00% | 12.10% |
| LGND | Ligand | | Biotechnology | 72.52 | 18 | -8.05% | 1.54% |
| SWTX | SpringWorks | | Biotechnology | 42.47 | 18 | -3.72% | 16.36% |
| ORIC | ORIC | | Biotechnology | 9.50 | 18 | -2.96% | 3.04% |
| REGN | Regeneron | | Biotechnology | 893.99 | 18 | -0.80% | 1.79% |
| NBIX | Neurocrine | | Biotechnology | 132.54 | 18 | -0.52% | 0.59% |
| ARVN | Arvinas | | Biotechnology | 34.29 | 17 | 2.51% | -16.69% |
| JAZZ | Jazz | | Biotechnology | 109.27 | 17 | 2.03% | -11.16% |
| To view more stocks, click on Next / Previous arrows or select different range: 0 - 25 , 25 - 50 , 50 - 75 , 75 - 100 , 100 - 125 , 125 - 150 , 150 - 175 , 175 - 200 , 200 - 225 , 225 - 250 , 250 - 275 , 275 - 300 , 300 - 325 , 325 - 350 , 350 - 375 , 375 - 400 | ||
 | Click To Change The Sort Order: By Market Cap or Company Size Performance: Year-to-date, Week and Day |  |
|
Get the most comprehensive stock market coverage daily at 12Stocks.com ➞ Best Stocks Today ➞ Best Stocks Weekly ➞ Best Stocks Year-to-Date ➞ Best Stocks Trends ➞  Best Stocks Today 12Stocks.com Best Nasdaq Stocks ➞ Best S&P 500 Stocks ➞ Best Tech Stocks ➞ Best Biotech Stocks ➞ |
| Detailed Overview of Biotech Stocks |
| Biotech Technical Overview, Leaders & Laggards, Top Biotech ETF Funds & Detailed Biotech Stocks List, Charts, Trends & More |
| Biotech Sector: Technical Analysis, Trends & YTD Performance | |
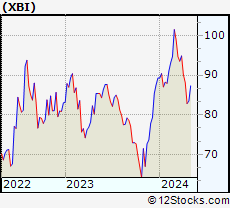
| Biotech sector, as represented by XBI, an exchange-traded fund [ETF] that holds basket of Biotech stocks (e.g, Amgen, Celgene) is down by -6.51% and is currently underperforming the overall market by -10.7% year-to-date. Below is a quick view of Technical charts and trends: | |
 XBI Weekly Chart |
|
| Long Term Trend: Not Good | |
| Medium Term Trend: Not Good | |
 XBI Daily Chart |
|
| Short Term Trend: Not Good | |
| Overall Trend Score: 0 | |
| YTD Performance: -6.51% | |
| **Trend Scores & Views Are Only For Educational Purposes And Not For Investing | |
| 12Stocks.com: Top Performing Biotech Sector Stocks | ||||||||||||||||||||||||||||||||||||||||||||||||
 The top performing Biotech sector stocks year to date are
Now, more recently, over last week, the top performing Biotech sector stocks on the move are


|
||||||||||||||||||||||||||||||||||||||||||||||||
| 12Stocks.com: Investing in Biotech Sector using Exchange Traded Funds | |
|
The following table shows list of key exchange traded funds (ETF) that
help investors track Biotech Index. For detailed view, check out our ETF Funds section of our website. Quick View: Move mouse or cursor over ETF symbol (ticker) to view short-term Technical chart and over ETF name to view long term chart. Click on ticker or stock name for detailed view. Click on to add stock symbol to your watchlist and to view watchlist. |
12Stocks.com List of ETFs that track Biotech Index
| Ticker | ETF Name | Watchlist | Recent Price | Market Intelligence Score | Change % | Week % | Year-to-date % |
| LABD | Biotech Bear 3X | | 10.52 | 100 | 4.37 | 17.15 | 8.57% |
| XBI | Biotech | | 83.48 | 0 | -1.38 | -5.3 | -6.51% |
| LABU | Biotech Bull 3X | | 88.04 | 0 | -4.33 | -15.63 | -27.82% |
| IBB | Biotechnology | | 124.64 | 0 | -0.99 | -3.81 | -8.25% |
| IYH | Healthcare | | 58.05 | 18 | -0.02 | -0.6 | 1.4% |
| IXJ | Global Healthcare | | 87.41 | 18 | -0.26 | -0.65 | 0.8% |
| BTEC | Principal Healthcare Innovators | | 34.09 | 0 | -1.51 | -5.29 | -6.17% |
| IHF | Healthcare Providers | | 51.55 | 32 | 0.93 | 1.99 | -1.84% |
| CURE | Healthcare Bull 3X | | 102.22 | 18 | -0.44 | -1.14 | 0.47% |
| FBT | First NYSE | | 141.52 | 0 | -1.52 | -3.94 | -10.46% |
| BIB | Biotechnology | | 47.94 | 0 | -2.02 | -6.71 | -15.97% |
| BIS | Short Biotech | | 20.87 | 100 | 1.69 | 6.46 | 15.47% |
| PTH | DWA Healthcare Momentum | | 39.57 | 23 | -2.18 | -5.4 | 1.1% |
| PBE | Biotech & Genome | | 59.62 | 0 | -1.75 | -2.66 | -9.45% |
| BBH | Biotech | | 152.35 | 10 | -0.43 | -3.33 | -7.84% |
| BBP | Bio Biotechnology Products | | 50.60 | 0 | -2.76 | -4.7 | -12.9% |
| BBC | Bio Biotechnology Clinical | | 25.48 | 13 | -1.32 | -6.06 | 4.2% |
| 12Stocks.com: Charts, Trends, Fundamental Data and Performances of Biotech Stocks | |
|
We now take in-depth look at all Biotech stocks including charts, multi-period performances and overall trends (as measured by market intelligence score). One can sort Biotech stocks (click link to choose) by Daily, Weekly and by Year-to-Date performances. Also, one can sort by size of the company or by market capitalization. |
| Select Your Default Chart Type: | |||||
| |||||
| Click on stock symbol or name for detailed view. Click on to add stock symbol to your watchlist and to view watchlist. Quick View: Move mouse or cursor over "Daily" to quickly view daily Technical stock chart and over "Weekly" to view weekly Technical stock chart. | |||||

 | CERS Cerus Corporation |
| Sector: Health Care | |
| SubSector: Biotechnology | |
| MarketCap: 607.185 Millions | |
| Recent Price: 1.64 Market Intelligence Score: 20 | |
| Day Percent Change: 0.00% Day Change: 0.00 | |
| Week Change: -6.29% Year-to-date Change: -24.1% | |
| CERS Links: Profile News Message Board | |
| Charts:- Daily , Weekly | |
| Add CERS to Watchlist: View: Get Complete CERS Trend Analysis ➞ | |
 | NVAX Novavax, Inc. |
| Sector: Health Care | |
| SubSector: Biotechnology | |
| MarketCap: 376.185 Millions | |
| Recent Price: 3.89 Market Intelligence Score: 20 | |
| Day Percent Change: 0.00% Day Change: 0.00 | |
| Week Change: -9.11% Year-to-date Change: -19.0% | |
| NVAX Links: Profile News Message Board | |
| Charts:- Daily , Weekly | |
| Add NVAX to Watchlist: View: Get Complete NVAX Trend Analysis ➞ | |
 | GNLX Genelux Corporation |
| Sector: Health Care | |
| SubSector: Biotechnology | |
| MarketCap: 820 Millions | |
| Recent Price: 3.62 Market Intelligence Score: 20 | |
| Day Percent Change: 0.00% Day Change: 0.00 | |
| Week Change: -12.26% Year-to-date Change: -76.3% | |
| GNLX Links: Profile News Message Board | |
| Charts:- Daily , Weekly | |
| Add GNLX to Watchlist: View: Get Complete GNLX Trend Analysis ➞ | |
 | FGEN FibroGen, Inc. |
| Sector: Health Care | |
| SubSector: Biotechnology | |
| MarketCap: 2502.95 Millions | |
| Recent Price: 1.17 Market Intelligence Score: 20 | |
| Day Percent Change: -7.87% Day Change: -0.10 | |
| Week Change: -13.97% Year-to-date Change: 32.0% | |
| FGEN Links: Profile News Message Board | |
| Charts:- Daily , Weekly | |
| Add FGEN to Watchlist: View: Get Complete FGEN Trend Analysis ➞ | |
 | DYN Dyne Therapeutics, Inc. |
| Sector: Health Care | |
| SubSector: Biotechnology | |
| MarketCap: 88487 Millions | |
| Recent Price: 23.65 Market Intelligence Score: 20 | |
| Day Percent Change: -4.71% Day Change: -1.17 | |
| Week Change: -8.51% Year-to-date Change: 77.8% | |
| DYN Links: Profile News Message Board | |
| Charts:- Daily , Weekly | |
| Add DYN to Watchlist: View: Get Complete DYN Trend Analysis ➞ | |
 | FATE Fate Therapeutics, Inc. |
| Sector: Health Care | |
| SubSector: Biotechnology | |
| MarketCap: 2022.45 Millions | |
| Recent Price: 5.04 Market Intelligence Score: 20 | |
| Day Percent Change: -4.36% Day Change: -0.23 | |
| Week Change: -15.29% Year-to-date Change: 34.8% | |
| FATE Links: Profile News Message Board | |
| Charts:- Daily , Weekly | |
| Add FATE to Watchlist: View: Get Complete FATE Trend Analysis ➞ | |
 | REPL Replimune Group, Inc. |
| Sector: Health Care | |
| SubSector: Biotechnology | |
| MarketCap: 367.885 Millions | |
| Recent Price: 6.97 Market Intelligence Score: 20 | |
| Day Percent Change: -3.33% Day Change: -0.24 | |
| Week Change: -2.38% Year-to-date Change: -17.3% | |
| REPL Links: Profile News Message Board | |
| Charts:- Daily , Weekly | |
| Add REPL to Watchlist: View: Get Complete REPL Trend Analysis ➞ | |
 | KZR Kezar Life Sciences, Inc. |
| Sector: Health Care | |
| SubSector: Biotechnology | |
| MarketCap: 174.885 Millions | |
| Recent Price: 0.79 Market Intelligence Score: 20 | |
| Day Percent Change: -3.31% Day Change: -0.03 | |
| Week Change: -8.47% Year-to-date Change: -16.7% | |
| KZR Links: Profile News Message Board | |
| Charts:- Daily , Weekly | |
| Add KZR to Watchlist: View: Get Complete KZR Trend Analysis ➞ | |
 | MNOV MediciNova, Inc. |
| Sector: Health Care | |
| SubSector: Biotechnology | |
| MarketCap: 137.685 Millions | |
| Recent Price: 1.40 Market Intelligence Score: 20 | |
| Day Percent Change: -2.10% Day Change: -0.03 | |
| Week Change: -10.83% Year-to-date Change: -6.7% | |
| MNOV Links: Profile News Message Board | |
| Charts:- Daily , Weekly | |
| Add MNOV to Watchlist: View: Get Complete MNOV Trend Analysis ➞ | |
 | PTCT PTC Therapeutics, Inc. |
| Sector: Health Care | |
| SubSector: Biotechnology | |
| MarketCap: 2795.85 Millions | |
| Recent Price: 24.69 Market Intelligence Score: 20 | |
| Day Percent Change: -1.87% Day Change: -0.47 | |
| Week Change: -6.55% Year-to-date Change: -10.4% | |
| PTCT Links: Profile News Message Board | |
| Charts:- Daily , Weekly | |
| Add PTCT to Watchlist: View: Get Complete PTCT Trend Analysis ➞ | |
 | GOSS Gossamer Bio, Inc. |
| Sector: Health Care | |
| SubSector: Biotechnology | |
| MarketCap: 653.285 Millions | |
| Recent Price: 0.81 Market Intelligence Score: 20 | |
| Day Percent Change: -1.71% Day Change: -0.01 | |
| Week Change: -9.96% Year-to-date Change: -11.7% | |
| GOSS Links: Profile News Message Board | |
| Charts:- Daily , Weekly | |
| Add GOSS to Watchlist: View: Get Complete GOSS Trend Analysis ➞ | |
 | SLRN Acelyrin, Inc. |
| Sector: Health Care | |
| SubSector: Biotechnology | |
| MarketCap: 2030 Millions | |
| Recent Price: 4.96 Market Intelligence Score: 20 | |
| Day Percent Change: -1.29% Day Change: -0.06 | |
| Week Change: -7.73% Year-to-date Change: -32.8% | |
| SLRN Links: Profile News Message Board | |
| Charts:- Daily , Weekly | |
| Add SLRN to Watchlist: View: Get Complete SLRN Trend Analysis ➞ | |
 | PIRS Pieris Pharmaceuticals, Inc. |
| Sector: Health Care | |
| SubSector: Biotechnology | |
| MarketCap: 150.785 Millions | |
| Recent Price: 0.16 Market Intelligence Score: 20 | |
| Day Percent Change: -1.21% Day Change: 0.00 | |
| Week Change: -9.45% Year-to-date Change: -14.7% | |
| PIRS Links: Profile News Message Board | |
| Charts:- Daily , Weekly | |
| Add PIRS to Watchlist: View: Get Complete PIRS Trend Analysis ➞ | |
 | HRMY Harmony Biosciences Holdings, Inc. |
| Sector: Health Care | |
| SubSector: Biotechnology | |
| MarketCap: 24487 Millions | |
| Recent Price: 29.05 Market Intelligence Score: 20 | |
| Day Percent Change: -0.48% Day Change: -0.14 | |
| Week Change: -1.53% Year-to-date Change: -10.0% | |
| HRMY Links: Profile News Message Board | |
| Charts:- Daily , Weekly | |
| Add HRMY to Watchlist: View: Get Complete HRMY Trend Analysis ➞ | |
 | BNTX BioNTech SE |
| Sector: Health Care | |
| SubSector: Biotechnology | |
| MarketCap: 11933.7 Millions | |
| Recent Price: 86.17 Market Intelligence Score: 20 | |
| Day Percent Change: -0.27% Day Change: -0.23 | |
| Week Change: -0.36% Year-to-date Change: -18.4% | |
| BNTX Links: Profile News Message Board | |
| Charts:- Daily , Weekly | |
| Add BNTX to Watchlist: View: Get Complete BNTX Trend Analysis ➞ | |
 | APLM Apollomics, Inc. |
| Sector: Health Care | |
| SubSector: Biotechnology | |
| MarketCap: 481 Millions | |
| Recent Price: 0.53 Market Intelligence Score: 20 | |
| Day Percent Change: -0.19% Day Change: 0.00 | |
| Week Change: -5.24% Year-to-date Change: -43.0% | |
| APLM Links: Profile News Message Board | |
| Charts:- Daily , Weekly | |
| Add APLM to Watchlist: View: Get Complete APLM Trend Analysis ➞ | |
 | KALA Kala Pharmaceuticals, Inc. |
| Sector: Health Care | |
| SubSector: Biotechnology | |
| MarketCap: 276.485 Millions | |
| Recent Price: 6.83 Market Intelligence Score: 20 | |
| Day Percent Change: -0.12% Day Change: -0.01 | |
| Week Change: -5.14% Year-to-date Change: -2.4% | |
| KALA Links: Profile News Message Board | |
| Charts:- Daily , Weekly | |
| Add KALA to Watchlist: View: Get Complete KALA Trend Analysis ➞ | |
 | AKBA Akebia Therapeutics, Inc. |
| Sector: Health Care | |
| SubSector: Biotechnology | |
| MarketCap: 794.285 Millions | |
| Recent Price: 1.39 Market Intelligence Score: 18 | |
| Day Percent Change: 0.00% Day Change: 0.00 | |
| Week Change: -4.79% Year-to-date Change: 12.1% | |
| AKBA Links: Profile News Message Board | |
| Charts:- Daily , Weekly | |
| Add AKBA to Watchlist: View: Get Complete AKBA Trend Analysis ➞ | |
 | LGND Ligand Pharmaceuticals Incorporated |
| Sector: Health Care | |
| SubSector: Biotechnology | |
| MarketCap: 1344.45 Millions | |
| Recent Price: 72.52 Market Intelligence Score: 18 | |
| Day Percent Change: -8.05% Day Change: -6.35 | |
| Week Change: -10.87% Year-to-date Change: 1.5% | |
| LGND Links: Profile News Message Board | |
| Charts:- Daily , Weekly | |
| Add LGND to Watchlist: View: Get Complete LGND Trend Analysis ➞ | |
 | SWTX SpringWorks Therapeutics, Inc. |
| Sector: Health Care | |
| SubSector: Biotechnology | |
| MarketCap: 1311.85 Millions | |
| Recent Price: 42.47 Market Intelligence Score: 18 | |
| Day Percent Change: -3.72% Day Change: -1.64 | |
| Week Change: -0.65% Year-to-date Change: 16.4% | |
| SWTX Links: Profile News Message Board | |
| Charts:- Daily , Weekly | |
| Add SWTX to Watchlist: View: Get Complete SWTX Trend Analysis ➞ | |
 | ORIC ORIC Pharmaceuticals, Inc. |
| Sector: Health Care | |
| SubSector: Biotechnology | |
| MarketCap: 12787 Millions | |
| Recent Price: 9.50 Market Intelligence Score: 18 | |
| Day Percent Change: -2.96% Day Change: -0.29 | |
| Week Change: -3.06% Year-to-date Change: 3.0% | |
| ORIC Links: Profile News Message Board | |
| Charts:- Daily , Weekly | |
| Add ORIC to Watchlist: View: Get Complete ORIC Trend Analysis ➞ | |
 | REGN Regeneron Pharmaceuticals, Inc. |
| Sector: Health Care | |
| SubSector: Biotechnology | |
| MarketCap: 51903.7 Millions | |
| Recent Price: 893.99 Market Intelligence Score: 18 | |
| Day Percent Change: -0.80% Day Change: -7.20 | |
| Week Change: -1.18% Year-to-date Change: 1.8% | |
| REGN Links: Profile News Message Board | |
| Charts:- Daily , Weekly | |
| Add REGN to Watchlist: View: Get Complete REGN Trend Analysis ➞ | |
 | NBIX Neurocrine Biosciences, Inc. |
| Sector: Health Care | |
| SubSector: Biotechnology | |
| MarketCap: 7897.85 Millions | |
| Recent Price: 132.54 Market Intelligence Score: 18 | |
| Day Percent Change: -0.52% Day Change: -0.69 | |
| Week Change: -1.57% Year-to-date Change: 0.6% | |
| NBIX Links: Profile News Message Board | |
| Charts:- Daily , Weekly | |
| Add NBIX to Watchlist: View: Get Complete NBIX Trend Analysis ➞ | |
 | ARVN Arvinas, Inc. |
| Sector: Health Care | |
| SubSector: Biotechnology | |
| MarketCap: 3469.85 Millions | |
| Recent Price: 34.29 Market Intelligence Score: 17 | |
| Day Percent Change: 2.51% Day Change: 0.84 | |
| Week Change: -5.51% Year-to-date Change: -16.7% | |
| ARVN Links: Profile News Message Board | |
| Charts:- Daily , Weekly | |
| Add ARVN to Watchlist: View: Get Complete ARVN Trend Analysis ➞ | |
 | JAZZ Jazz Pharmaceuticals plc |
| Sector: Health Care | |
| SubSector: Biotechnology | |
| MarketCap: 5576.05 Millions | |
| Recent Price: 109.27 Market Intelligence Score: 17 | |
| Day Percent Change: 2.03% Day Change: 2.17 | |
| Week Change: -1.18% Year-to-date Change: -11.2% | |
| JAZZ Links: Profile News Message Board | |
| Charts:- Daily , Weekly | |
| Add JAZZ to Watchlist: View: Get Complete JAZZ Trend Analysis ➞ | |
| To view more stocks, click on Next / Previous arrows or select different range: 0 - 25 , 25 - 50 , 50 - 75 , 75 - 100 , 100 - 125 , 125 - 150 , 150 - 175 , 175 - 200 , 200 - 225 , 225 - 250 , 250 - 275 , 275 - 300 , 300 - 325 , 325 - 350 , 350 - 375 , 375 - 400 | ||
| Click To Change The Sort Order: By Market Cap or Company Size Performance: Year-to-date, Week and Day | |
| Select Chart Type: | ||
|
Best Stocks Today 12Stocks.com |
© 2024 12Stocks.com Terms & Conditions Privacy Contact Us
All Information Provided Only For Education And Not To Be Used For Investing or Trading. See Terms & Conditions


One More Thing ... Get Best Stocks Delivered Daily!
Never Ever Miss A Move With Our Top Ten Stocks Lists
Find Best Stocks In Any Market - Bull or Bear Market
Take A Peek At Our Top Ten Stocks Lists: Daily, Weekly, Year-to-Date & Top Trends
Find Best Stocks In Any Market - Bull or Bear Market
Take A Peek At Our Top Ten Stocks Lists: Daily, Weekly, Year-to-Date & Top Trends
Biotech Stocks With Best Up Trends [0-bearish to 100-bullish]: Cullinan Oncology[100], ALX Oncology[100], Geron [95], Zura Bio[93], NuCana [93], Reneo [93], Vanda [93], Acrivon [88], Shattuck Labs[88], United [88], Avadel [83]
Best Biotech Stocks Year-to-Date:
Precision [2836.99%], Inovio [1900%], Assembly [1525.41%], Adverum nologies[1381.14%], NuCana [1269.17%], Affimed N.V[711.2%], Corbus [504.8%], Agenus [500.31%], Mesoblast [364.55%], Janux [348.12%], Addex [294.25%] Best Biotech Stocks This Week:
NuCana [1708.84%], ProKidney [32%], ALX Oncology[20.64%], Vanda [20.63%], Galera [16.43%], Cullinan Oncology[13.89%], Rani [13.15%], Humacyte [12.67%], Bicycle [9.91%], Zura Bio[9.52%], Intra-Cellular Therapies[9.29%] Best Biotech Stocks Daily:
Zura Bio[17.20%], Bicycle [12.33%], Vaxxinity [10.05%], Annovis Bio[9.57%], RedHill Biopharma[9.16%], Cullinan Oncology[6.42%], Longboard [6.07%], Addex [5.31%], Ginkgo Bioworks[5.13%], Century [5.13%], Acrivon [5.08%]