
 Login Sign Up


| |||||
 |  | ||||

| 12Stocks.com Market Intelligence |
Best Biotech Stocks
|
|
| Quick Read: Best Biotech Stocks List By Performances & Trends: Daily, Weekly, Year-to-Date, Market Cap (Size) & Technical Trends | |||
| Best Biotech Stocks Views: Quick Browse View, Summary & Slide Show View | |||
| 12Stocks.com Biotech Stocks Performances & Trends Daily | |||||||||
|
|  The overall market intelligence score is 10 (0-bearish to 100-bullish) which puts Biotech sector in short term bearish trend. The market intelligence score from previous trading session is 0 and hence an improvement of trend.
| ||||||||
Here are the market intelligence trend scores of the most requested Biotech stocks at 12Stocks.com (click stock name for detailed review):
|


| 12Stocks.com: Investing in Biotech sector with Stocks | |
|
The following table helps investors and traders sort through current performance and trends (as measured by market intelligence score) of various
stocks in the Biotech sector. Quick View: Move mouse or cursor over stock symbol (ticker) to view short-term Technical chart and over stock name to view long term chart. Click on  to add stock symbol to your watchlist and to add stock symbol to your watchlist and  to view watchlist. Click on any ticker or stock name for detailed market intelligence report for that stock. to view watchlist. Click on any ticker or stock name for detailed market intelligence report for that stock. |
12Stocks.com Performance of Stocks in Biotech Sector
| Ticker | Stock Name | Watchlist | Category | Recent Price | Market Intelligence Score | Change % | YTD Change% |
| IMAB | I Mab |   | Biotechnology | 1.79 | 48 | -1.10% | -5.79% |
| XOMAO | XOMA | | Biotechnology | 25.11 | 48 | 0.44% | 0.48% |
| ZNTL | Zentalis | | Biotechnology | 12.84 | 46 | 1.02% | -15.30% |
| STOK | Stoke | | Biotechnology | 11.75 | 46 | 0.26% | 123.38% |
| FBIOP | Fortress | | Biotechnology | 15.87 | 46 | 0.00% | 33.70% |
| IBIO | iBio | | Biotechnology | 1.75 | 46 | -7.41% | 27.74% |
| LCTX | Lineage Cell | | Biotechnology | 1.20 | 46 | -7.36% | 9.63% |
| SGMO | Sangamo | | Biotechnology | 0.49 | 46 | -5.21% | -9.98% |
| CARA | Cara | | Biotechnology | 0.70 | 46 | -4.36% | -5.79% |
| MDGL | Madrigal | | Biotechnology | 221.60 | 46 | -2.95% | -4.23% |
| KRYS | Krystal | | Biotechnology | 165.34 | 46 | -2.53% | 33.27% |
| EBS | Emergent Bio | | Biotechnology | 1.86 | 46 | -2.37% | -22.71% |
| GTHX | G1 | | Biotechnology | 4.18 | 46 | -2.22% | 37.21% |
| DNLI | Denali | | Biotechnology | 16.65 | 46 | -1.01% | -22.41% |
| SNDX | Syndax | | Biotechnology | 20.54 | 46 | -0.96% | -4.95% |
| MRNA | Moderna | | Biotechnology | 102.53 | 46 | -0.88% | 3.10% |
| OMER | Omeros | | Biotechnology | 3.31 | 46 | -0.75% | 1.38% |
| GMAB | Genmab A/S | | Biotechnology | 28.33 | 46 | -0.70% | -11.02% |
| XNCR | Xencor | | Biotechnology | 18.94 | 46 | -0.68% | -10.79% |
| RNA | Avidity | | Biotechnology | 23.43 | 46 | -0.53% | 159.18% |
| MGNX | MacroGenics | | Biotechnology | 16.02 | 46 | -0.50% | 66.53% |
| HALO | Halozyme | | Biotechnology | 37.85 | 46 | -0.45% | 2.41% |
| AFMD | Affimed N.V | | Biotechnology | 5.21 | 46 | -0.38% | 733.60% |
| TBPH | Theravance Biopharma | | Biotechnology | 9.30 | 45 | -2.31% | -17.26% |
| BYSI | BeyondSpring | | Biotechnology | 1.80 | 44 | -2.70% | 100.00% |
| To view more stocks, click on Next / Previous arrows or select different range: 0 - 25 , 25 - 50 , 50 - 75 , 75 - 100 , 100 - 125 , 125 - 150 , 150 - 175 , 175 - 200 , 200 - 225 , 225 - 250 , 250 - 275 , 275 - 300 , 300 - 325 , 325 - 350 , 350 - 375 , 375 - 400 | ||
 | Click To Change The Sort Order: By Market Cap or Company Size Performance: Year-to-date, Week and Day |  |
|
Get the most comprehensive stock market coverage daily at 12Stocks.com ➞ Best Stocks Today ➞ Best Stocks Weekly ➞ Best Stocks Year-to-Date ➞ Best Stocks Trends ➞  Best Stocks Today 12Stocks.com Best Nasdaq Stocks ➞ Best S&P 500 Stocks ➞ Best Tech Stocks ➞ Best Biotech Stocks ➞ |
| Detailed Overview of Biotech Stocks |
| Biotech Technical Overview, Leaders & Laggards, Top Biotech ETF Funds & Detailed Biotech Stocks List, Charts, Trends & More |
| Biotech Sector: Technical Analysis, Trends & YTD Performance | |
| Biotech sector, as represented by XBI, an exchange-traded fund [ETF] that holds basket of Biotech stocks (e.g, Amgen, Celgene) is down by -6.06% and is currently underperforming the overall market by -10.09% year-to-date. Below is a quick view of Technical charts and trends: | |
 XBI Weekly Chart |
|
| Long Term Trend: Not Good | |
| Medium Term Trend: Not Good | |
 XBI Daily Chart |
|
| Short Term Trend: Deteriorating | |
| Overall Trend Score: 10 | |
| YTD Performance: -6.06% | |
| **Trend Scores & Views Are Only For Educational Purposes And Not For Investing | |
| 12Stocks.com: Top Performing Biotech Sector Stocks | ||||||||||||||||||||||||||||||||||||||||||||||||
 The top performing Biotech sector stocks year to date are
Now, more recently, over last week, the top performing Biotech sector stocks on the move are


|
||||||||||||||||||||||||||||||||||||||||||||||||
| 12Stocks.com: Investing in Biotech Sector using Exchange Traded Funds | |
|
The following table shows list of key exchange traded funds (ETF) that
help investors track Biotech Index. For detailed view, check out our ETF Funds section of our website. Quick View: Move mouse or cursor over ETF symbol (ticker) to view short-term Technical chart and over ETF name to view long term chart. Click on ticker or stock name for detailed view. Click on to add stock symbol to your watchlist and to view watchlist. |
12Stocks.com List of ETFs that track Biotech Index
| Ticker | ETF Name | Watchlist | Recent Price | Market Intelligence Score | Change % | Week % | Year-to-date % |
| LABD | Biotech Bear 3X | | 10.42 | 82 | 3.37 | 16.04 | 7.53% |
| XBI | Biotech | | 83.88 | 10 | -0.91 | -4.84 | -6.06% |
| LABU | Biotech Bull 3X | | 89.48 | 10 | -2.76 | -14.25 | -26.64% |
| IBB | Biotechnology | | 124.91 | 0 | -0.78 | -3.6 | -8.05% |
| IYH | Healthcare | | 58.05 | 10 | -0.02 | -0.6 | 1.4% |
| IXJ | Global Healthcare | | 87.42 | 18 | -0.25 | -0.64 | 0.81% |
| BTEC | Principal Healthcare Innovators | | 34.41 | 10 | -0.58 | -4.39 | -5.28% |
| IHF | Healthcare Providers | | 51.71 | 45 | 1.25 | 2.31 | -1.52% |
| CURE | Healthcare Bull 3X | | 102.24 | 18 | -0.42 | -1.12 | 0.49% |
| FBT | First NYSE | | 141.86 | 10 | -1.29 | -3.71 | -10.25% |
| BIB | Biotechnology | | 48.23 | 0 | -1.44 | -6.16 | -15.47% |
| PTH | DWA Healthcare Momentum | | 40.51 | 46 | 0.15 | -3.16 | 3.5% |
| BIS | Short Biotech | | 20.57 | 95 | 0.24 | 4.95 | 13.84% |
| PBE | Biotech & Genome | | 59.89 | 18 | -1.31 | -2.22 | -9.04% |
| BBH | Biotech | | 152.32 | 10 | -0.45 | -3.34 | -7.86% |
| BBP | Bio Biotechnology Products | | 51.07 | 18 | -1.85 | -3.82 | -12.09% |
| BBC | Bio Biotechnology Clinical | | 25.74 | 36 | -0.31 | -5.1 | 5.27% |
| 12Stocks.com: Charts, Trends, Fundamental Data and Performances of Biotech Stocks | |
|
We now take in-depth look at all Biotech stocks including charts, multi-period performances and overall trends (as measured by market intelligence score). One can sort Biotech stocks (click link to choose) by Daily, Weekly and by Year-to-Date performances. Also, one can sort by size of the company or by market capitalization. |
| Select Your Default Chart Type: | |||||
| |||||
| Click on stock symbol or name for detailed view. Click on to add stock symbol to your watchlist and to view watchlist. Quick View: Move mouse or cursor over "Daily" to quickly view daily Technical stock chart and over "Weekly" to view weekly Technical stock chart. | |||||

 | IMAB I Mab |
| Sector: Health Care | |
| SubSector: Biotechnology | |
| MarketCap: 26187 Millions | |
| Recent Price: 1.79 Market Intelligence Score: 48 | |
| Day Percent Change: -1.10% Day Change: -0.02 | |
| Week Change: -1.1% Year-to-date Change: -5.8% | |
| IMAB Links: Profile News Message Board | |
| Charts:- Daily , Weekly | |
| Add IMAB to Watchlist: View: Get Complete IMAB Trend Analysis ➞ | |
 | XOMAO XOMA Corporation |
| Sector: Health Care | |
| SubSector: Biotechnology | |
| MarketCap: 217 Millions | |
| Recent Price: 25.11 Market Intelligence Score: 48 | |
| Day Percent Change: 0.44% Day Change: 0.11 | |
| Week Change: 0.36% Year-to-date Change: 0.5% | |
| XOMAO Links: Profile News Message Board | |
| Charts:- Daily , Weekly | |
| Add XOMAO to Watchlist: View: Get Complete XOMAO Trend Analysis ➞ | |
 | ZNTL Zentalis Pharmaceuticals, Inc. |
| Sector: Health Care | |
| SubSector: Biotechnology | |
| MarketCap: 22187 Millions | |
| Recent Price: 12.84 Market Intelligence Score: 46 | |
| Day Percent Change: 1.02% Day Change: 0.13 | |
| Week Change: -4.25% Year-to-date Change: -15.3% | |
| ZNTL Links: Profile News Message Board | |
| Charts:- Daily , Weekly | |
| Add ZNTL to Watchlist: View: Get Complete ZNTL Trend Analysis ➞ | |
 | STOK Stoke Therapeutics, Inc. |
| Sector: Health Care | |
| SubSector: Biotechnology | |
| MarketCap: 772.485 Millions | |
| Recent Price: 11.75 Market Intelligence Score: 46 | |
| Day Percent Change: 0.26% Day Change: 0.03 | |
| Week Change: -7.99% Year-to-date Change: 123.4% | |
| STOK Links: Profile News Message Board | |
| Charts:- Daily , Weekly | |
| Add STOK to Watchlist: View: Get Complete STOK Trend Analysis ➞ | |
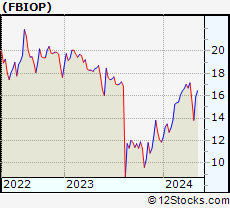 | FBIOP Fortress Biotech, Inc. |
| Sector: Health Care | |
| SubSector: Biotechnology | |
| MarketCap: 836.085 Millions | |
| Recent Price: 15.87 Market Intelligence Score: 46 | |
| Day Percent Change: 0.00% Day Change: 0.00 | |
| Week Change: -7.54% Year-to-date Change: 33.7% | |
| FBIOP Links: Profile News Message Board | |
| Charts:- Daily , Weekly | |
| Add FBIOP to Watchlist: View: Get Complete FBIOP Trend Analysis ➞ | |
 | IBIO iBio, Inc. |
| Sector: Health Care | |
| SubSector: Biotechnology | |
| MarketCap: 110.885 Millions | |
| Recent Price: 1.75 Market Intelligence Score: 46 | |
| Day Percent Change: -7.41% Day Change: -0.14 | |
| Week Change: -13.37% Year-to-date Change: 27.7% | |
| IBIO Links: Profile News Message Board | |
| Charts:- Daily , Weekly | |
| Add IBIO to Watchlist: View: Get Complete IBIO Trend Analysis ➞ | |
 | LCTX Lineage Cell Therapeutics, Inc. |
| Sector: Health Care | |
| SubSector: Biotechnology | |
| MarketCap: 141.285 Millions | |
| Recent Price: 1.20 Market Intelligence Score: 46 | |
| Day Percent Change: -7.36% Day Change: -0.09 | |
| Week Change: -8.08% Year-to-date Change: 9.6% | |
| LCTX Links: Profile News Message Board | |
| Charts:- Daily , Weekly | |
| Add LCTX to Watchlist: View: Get Complete LCTX Trend Analysis ➞ | |
 | SGMO Sangamo Therapeutics, Inc. |
| Sector: Health Care | |
| SubSector: Biotechnology | |
| MarketCap: 779.285 Millions | |
| Recent Price: 0.49 Market Intelligence Score: 46 | |
| Day Percent Change: -5.21% Day Change: -0.03 | |
| Week Change: -9.99% Year-to-date Change: -10.0% | |
| SGMO Links: Profile News Message Board | |
| Charts:- Daily , Weekly | |
| Add SGMO to Watchlist: View: Get Complete SGMO Trend Analysis ➞ | |
 | CARA Cara Therapeutics, Inc. |
| Sector: Health Care | |
| SubSector: Biotechnology | |
| MarketCap: 597.985 Millions | |
| Recent Price: 0.70 Market Intelligence Score: 46 | |
| Day Percent Change: -4.36% Day Change: -0.03 | |
| Week Change: -8.39% Year-to-date Change: -5.8% | |
| CARA Links: Profile News Message Board | |
| Charts:- Daily , Weekly | |
| Add CARA to Watchlist: View: Get Complete CARA Trend Analysis ➞ | |
 | MDGL Madrigal Pharmaceuticals, Inc. |
| Sector: Health Care | |
| SubSector: Biotechnology | |
| MarketCap: 1104.35 Millions | |
| Recent Price: 221.60 Market Intelligence Score: 46 | |
| Day Percent Change: -2.95% Day Change: -6.75 | |
| Week Change: -6.34% Year-to-date Change: -4.2% | |
| MDGL Links: Profile News Message Board | |
| Charts:- Daily , Weekly | |
| Add MDGL to Watchlist: View: Get Complete MDGL Trend Analysis ➞ | |
 | KRYS Krystal Biotech, Inc. |
| Sector: Health Care | |
| SubSector: Biotechnology | |
| MarketCap: 874.085 Millions | |
| Recent Price: 165.34 Market Intelligence Score: 46 | |
| Day Percent Change: -2.53% Day Change: -4.30 | |
| Week Change: -4.77% Year-to-date Change: 33.3% | |
| KRYS Links: Profile News Message Board | |
| Charts:- Daily , Weekly | |
| Add KRYS to Watchlist: View: Get Complete KRYS Trend Analysis ➞ | |
 | EBS Emergent BioSolutions Inc. |
| Sector: Health Care | |
| SubSector: Biotechnology | |
| MarketCap: 2417.65 Millions | |
| Recent Price: 1.86 Market Intelligence Score: 46 | |
| Day Percent Change: -2.37% Day Change: -0.04 | |
| Week Change: -9.95% Year-to-date Change: -22.7% | |
| EBS Links: Profile News Message Board | |
| Charts:- Daily , Weekly | |
| Add EBS to Watchlist: View: Get Complete EBS Trend Analysis ➞ | |
 | GTHX G1 Therapeutics, Inc. |
| Sector: Health Care | |
| SubSector: Biotechnology | |
| MarketCap: 484.085 Millions | |
| Recent Price: 4.18 Market Intelligence Score: 46 | |
| Day Percent Change: -2.22% Day Change: -0.10 | |
| Week Change: -8.02% Year-to-date Change: 37.2% | |
| GTHX Links: Profile News Message Board | |
| Charts:- Daily , Weekly | |
| Add GTHX to Watchlist: View: Get Complete GTHX Trend Analysis ➞ | |
 | DNLI Denali Therapeutics Inc. |
| Sector: Health Care | |
| SubSector: Biotechnology | |
| MarketCap: 2020.05 Millions | |
| Recent Price: 16.65 Market Intelligence Score: 46 | |
| Day Percent Change: -1.01% Day Change: -0.17 | |
| Week Change: -8.82% Year-to-date Change: -22.4% | |
| DNLI Links: Profile News Message Board | |
| Charts:- Daily , Weekly | |
| Add DNLI to Watchlist: View: Get Complete DNLI Trend Analysis ➞ | |
 | SNDX Syndax Pharmaceuticals, Inc. |
| Sector: Health Care | |
| SubSector: Biotechnology | |
| MarketCap: 365.985 Millions | |
| Recent Price: 20.54 Market Intelligence Score: 46 | |
| Day Percent Change: -0.96% Day Change: -0.20 | |
| Week Change: -5.43% Year-to-date Change: -5.0% | |
| SNDX Links: Profile News Message Board | |
| Charts:- Daily , Weekly | |
| Add SNDX to Watchlist: View: Get Complete SNDX Trend Analysis ➞ | |
 | MRNA Moderna, Inc. |
| Sector: Health Care | |
| SubSector: Biotechnology | |
| MarketCap: 11006.4 Millions | |
| Recent Price: 102.53 Market Intelligence Score: 46 | |
| Day Percent Change: -0.88% Day Change: -0.91 | |
| Week Change: -2.48% Year-to-date Change: 3.1% | |
| MRNA Links: Profile News Message Board | |
| Charts:- Daily , Weekly | |
| Add MRNA to Watchlist: View: Get Complete MRNA Trend Analysis ➞ | |
 | OMER Omeros Corporation |
| Sector: Health Care | |
| SubSector: Biotechnology | |
| MarketCap: 759.585 Millions | |
| Recent Price: 3.31 Market Intelligence Score: 46 | |
| Day Percent Change: -0.75% Day Change: -0.02 | |
| Week Change: -11.84% Year-to-date Change: 1.4% | |
| OMER Links: Profile News Message Board | |
| Charts:- Daily , Weekly | |
| Add OMER to Watchlist: View: Get Complete OMER Trend Analysis ➞ | |
 | GMAB Genmab A/S |
| Sector: Health Care | |
| SubSector: Biotechnology | |
| MarketCap: 12482.3 Millions | |
| Recent Price: 28.33 Market Intelligence Score: 46 | |
| Day Percent Change: -0.70% Day Change: -0.20 | |
| Week Change: -3.18% Year-to-date Change: -11.0% | |
| GMAB Links: Profile News Message Board | |
| Charts:- Daily , Weekly | |
| Add GMAB to Watchlist: View: Get Complete GMAB Trend Analysis ➞ | |
 | XNCR Xencor, Inc. |
| Sector: Health Care | |
| SubSector: Biotechnology | |
| MarketCap: 1744.35 Millions | |
| Recent Price: 18.94 Market Intelligence Score: 46 | |
| Day Percent Change: -0.68% Day Change: -0.13 | |
| Week Change: -7.52% Year-to-date Change: -10.8% | |
| XNCR Links: Profile News Message Board | |
| Charts:- Daily , Weekly | |
| Add XNCR to Watchlist: View: Get Complete XNCR Trend Analysis ➞ | |
 | RNA Avidity Biosciences, Inc. |
| Sector: Health Care | |
| SubSector: Biotechnology | |
| MarketCap: 12287 Millions | |
| Recent Price: 23.43 Market Intelligence Score: 46 | |
| Day Percent Change: -0.53% Day Change: -0.13 | |
| Week Change: -2.74% Year-to-date Change: 159.2% | |
| RNA Links: Profile News Message Board | |
| Charts:- Daily , Weekly | |
| Add RNA to Watchlist: View: Get Complete RNA Trend Analysis ➞ | |
 | MGNX MacroGenics, Inc. |
| Sector: Health Care | |
| SubSector: Biotechnology | |
| MarketCap: 262.785 Millions | |
| Recent Price: 16.02 Market Intelligence Score: 46 | |
| Day Percent Change: -0.50% Day Change: -0.08 | |
| Week Change: -8.67% Year-to-date Change: 66.5% | |
| MGNX Links: Profile News Message Board | |
| Charts:- Daily , Weekly | |
| Add MGNX to Watchlist: View: Get Complete MGNX Trend Analysis ➞ | |
 | HALO Halozyme Therapeutics, Inc. |
| Sector: Health Care | |
| SubSector: Biotechnology | |
| MarketCap: 2383.75 Millions | |
| Recent Price: 37.85 Market Intelligence Score: 46 | |
| Day Percent Change: -0.45% Day Change: -0.17 | |
| Week Change: -1.97% Year-to-date Change: 2.4% | |
| HALO Links: Profile News Message Board | |
| Charts:- Daily , Weekly | |
| Add HALO to Watchlist: View: Get Complete HALO Trend Analysis ➞ | |
 | AFMD Affimed N.V. |
| Sector: Health Care | |
| SubSector: Biotechnology | |
| MarketCap: 161.385 Millions | |
| Recent Price: 5.21 Market Intelligence Score: 46 | |
| Day Percent Change: -0.38% Day Change: -0.02 | |
| Week Change: -9.39% Year-to-date Change: 733.6% | |
| AFMD Links: Profile News Message Board | |
| Charts:- Daily , Weekly | |
| Add AFMD to Watchlist: View: Get Complete AFMD Trend Analysis ➞ | |
 | TBPH Theravance Biopharma, Inc. |
| Sector: Health Care | |
| SubSector: Biotechnology | |
| MarketCap: 1404.55 Millions | |
| Recent Price: 9.30 Market Intelligence Score: 45 | |
| Day Percent Change: -2.31% Day Change: -0.22 | |
| Week Change: -3.23% Year-to-date Change: -17.3% | |
| TBPH Links: Profile News Message Board | |
| Charts:- Daily , Weekly | |
| Add TBPH to Watchlist: View: Get Complete TBPH Trend Analysis ➞ | |
 | BYSI BeyondSpring Inc. |
| Sector: Health Care | |
| SubSector: Biotechnology | |
| MarketCap: 432.785 Millions | |
| Recent Price: 1.80 Market Intelligence Score: 44 | |
| Day Percent Change: -2.70% Day Change: -0.05 | |
| Week Change: -13.88% Year-to-date Change: 100.0% | |
| BYSI Links: Profile News Message Board | |
| Charts:- Daily , Weekly | |
| Add BYSI to Watchlist: View: Get Complete BYSI Trend Analysis ➞ | |
| To view more stocks, click on Next / Previous arrows or select different range: 0 - 25 , 25 - 50 , 50 - 75 , 75 - 100 , 100 - 125 , 125 - 150 , 150 - 175 , 175 - 200 , 200 - 225 , 225 - 250 , 250 - 275 , 275 - 300 , 300 - 325 , 325 - 350 , 350 - 375 , 375 - 400 | ||
| Click To Change The Sort Order: By Market Cap or Company Size Performance: Year-to-date, Week and Day | |
| Select Chart Type: | ||
|
Best Stocks Today 12Stocks.com |
© 2024 12Stocks.com Terms & Conditions Privacy Contact Us
All Information Provided Only For Education And Not To Be Used For Investing or Trading. See Terms & Conditions


One More Thing ... Get Best Stocks Delivered Daily!
Never Ever Miss A Move With Our Top Ten Stocks Lists
Find Best Stocks In Any Market - Bull or Bear Market
Take A Peek At Our Top Ten Stocks Lists: Daily, Weekly, Year-to-Date & Top Trends
Find Best Stocks In Any Market - Bull or Bear Market
Take A Peek At Our Top Ten Stocks Lists: Daily, Weekly, Year-to-Date & Top Trends
Biotech Stocks With Best Up Trends [0-bearish to 100-bullish]: Cullinan Oncology[100], Geron [100], ALX Oncology[100], Zura Bio[93], NuCana [93], Avadel [93], Vanda [93], Acrivon [88], Shattuck Labs[88], Galera [88], Rani [88]
Best Biotech Stocks Year-to-Date:
Precision [3023.29%], Inovio [1911.76%], Assembly [1479.08%], Adverum nologies[1361.21%], NuCana [1269.17%], Affimed N.V[733.6%], Agenus [511.18%], Corbus [497.76%], Mesoblast [368.18%], Janux [348.12%], Addex [294.25%] Best Biotech Stocks This Week:
NuCana [1708.84%], ProKidney [32%], Rani [28.8%], ALX Oncology[22.79%], Vanda [20.63%], Cullinan Oncology[13.89%], Humacyte [12.67%], Galera [12.46%], ADC [10.71%], Intra-Cellular Therapies[9.86%], Bicycle [9.28%] Best Biotech Stocks Daily:
Bicycle [11.69%], Zura Bio[10.99%], Vaxxinity [10.05%], Cullinan Oncology[6.42%], Annovis Bio[5.78%], RedHill Biopharma[5.34%], Addex [5.31%], Ginkgo Bioworks[5.13%], Acrivon [5.08%], Sage [4.73%], Compass [4.61%]