
 Login Sign Up


| |||||
 |  | ||||

| 12Stocks.com Market Intelligence |
Best Biotech Stocks
|
|
| Quick Read: Best Biotech Stocks List By Performances & Trends: Daily, Weekly, Year-to-Date, Market Cap (Size) & Technical Trends | |||
| Best Biotech Stocks Views: Quick Browse View, Summary & Slide Show View | |||
| 12Stocks.com Biotech Stocks Performances & Trends Daily | |||||||||
|
|  The overall market intelligence score is 49 (0-bearish to 100-bullish) which puts Biotech sector in short term neutral trend. The market intelligence score from previous trading session is 32 and hence an improvement of trend.
| ||||||||
Here are the market intelligence trend scores of the most requested Biotech stocks at 12Stocks.com (click stock name for detailed review):
|


| 12Stocks.com: Investing in Biotech sector with Stocks | |
|
The following table helps investors and traders sort through current performance and trends (as measured by market intelligence score) of various
stocks in the Biotech sector. Quick View: Move mouse or cursor over stock symbol (ticker) to view short-term Technical chart and over stock name to view long term chart. Click on  to add stock symbol to your watchlist and to add stock symbol to your watchlist and  to view watchlist. Click on any ticker or stock name for detailed market intelligence report for that stock. to view watchlist. Click on any ticker or stock name for detailed market intelligence report for that stock. |
12Stocks.com Performance of Stocks in Biotech Sector
| Ticker | Stock Name | Watchlist | Category | Recent Price | Market Intelligence Score | Change % | YTD Change% |
| CABA | Cabaletta Bio |   | Biotechnology | 12.38 | 25 | 16.30% | -45.46% |
| NKTX | Nkarta | | Biotechnology | 7.50 | 25 | 12.28% | 13.72% |
| ANNX | Annexon | | Biotechnology | 4.74 | 24 | 4.18% | 3.95% |
| PRQR | ProQR | | Biotechnology | 2.00 | 24 | 2.84% | 0.76% |
| ALGS | Aligos | | Biotechnology | 0.77 | 23 | 1.25% | 18.93% |
| IMRX | Immuneering | | Biotechnology | 1.54 | 22 | 8.45% | -79.71% |
| ASMB | Assembly | | Biotechnology | 13.29 | 22 | 6.58% | NA |
| VOR | Vor Biopharma | | Biotechnology | 1.77 | 22 | 2.91% | -20.27% |
| RLMD | Relmada | | Biotechnology | 3.70 | 22 | 1.65% | -10.63% |
| MTEM | Molecular Templates | | Biotechnology | 1.66 | 22 | 0.00% | -55.50% |
| CHRS | Coherus | | Biotechnology | 2.06 | 20 | 5.10% | -38.14% |
| APLS | Apellis | | Biotechnology | 46.07 | 20 | 4.25% | -23.04% |
| BTAI | BioXcel | | Biotechnology | 2.56 | 20 | 1.39% | -13.39% |
| VIGL | Vigil Neuroscience | | Biotechnology | 2.65 | 20 | 1.34% | -22.89% |
| AKRO | Akero | | Biotechnology | 20.07 | 20 | 0.88% | -14.07% |
| APTO | Aptose | | Biotechnology | 1.20 | 20 | 0.00% | -52.76% |
| APLM | Apollomics | | Biotechnology | 0.41 | 20 | -3.52% | -55.76% |
| FBIO | Fortress | | Biotechnology | 1.73 | 20 | -1.70% | -42.52% |
| IKNA | Ikena Oncology | | Biotechnology | 1.30 | 20 | -1.52% | -35.00% |
| PASG | Passage Bio | | Biotechnology | 1.35 | 19 | 4.65% | 33.66% |
| MNPR | Monopar | | Biotechnology | 0.65 | 19 | -1.38% | 89.24% |
| RIGL | Rigel | | Biotechnology | 1.08 | 18 | 2.38% | -25.86% |
| FENC | Fennec | | Biotechnology | 9.08 | 18 | -1.09% | -19.07% |
| KOD | Kodiak | | Biotechnology | 3.52 | 17 | 9.66% | 15.79% |
| ARCT | Arcturus | | Biotechnology | 27.90 | 17 | 9.09% | -11.53% |
| To view more stocks, click on Next / Previous arrows or select different range: 0 - 25 , 25 - 50 , 50 - 75 , 75 - 100 , 100 - 125 , 125 - 150 , 150 - 175 , 175 - 200 , 200 - 225 , 225 - 250 , 250 - 275 , 275 - 300 , 300 - 325 , 325 - 350 , 350 - 375 , 375 - 400 | ||
 | Click To Change The Sort Order: By Market Cap or Company Size Performance: Year-to-date, Week and Day |  |
|
Get the most comprehensive stock market coverage daily at 12Stocks.com ➞ Best Stocks Today ➞ Best Stocks Weekly ➞ Best Stocks Year-to-Date ➞ Best Stocks Trends ➞  Best Stocks Today 12Stocks.com Best Nasdaq Stocks ➞ Best S&P 500 Stocks ➞ Best Tech Stocks ➞ Best Biotech Stocks ➞ |
| Detailed Overview of Biotech Stocks |
| Biotech Technical Overview, Leaders & Laggards, Top Biotech ETF Funds & Detailed Biotech Stocks List, Charts, Trends & More |
| Biotech Sector: Technical Analysis, Trends & YTD Performance | |
| Biotech sector, as represented by XBI, an exchange-traded fund [ETF] that holds basket of Biotech stocks (e.g, Amgen, Celgene) is down by -2.11% and is currently underperforming the overall market by -6.65% year-to-date. Below is a quick view of Technical charts and trends: | |
 XBI Weekly Chart |
|
| Long Term Trend: Not Good | |
| Medium Term Trend: Not Good | |
 XBI Daily Chart |
|
| Short Term Trend: Very Good | |
| Overall Trend Score: 49 | |
| YTD Performance: -2.11% | |
| **Trend Scores & Views Are Only For Educational Purposes And Not For Investing | |
| 12Stocks.com: Top Performing Biotech Sector Stocks | ||||||||||||||||||||||||||||||||||||||||||||||||
 The top performing Biotech sector stocks year to date are
Now, more recently, over last week, the top performing Biotech sector stocks on the move are


|
||||||||||||||||||||||||||||||||||||||||||||||||
| 12Stocks.com: Investing in Biotech Sector using Exchange Traded Funds | |
|
The following table shows list of key exchange traded funds (ETF) that
help investors track Biotech Index. For detailed view, check out our ETF Funds section of our website. Quick View: Move mouse or cursor over ETF symbol (ticker) to view short-term Technical chart and over ETF name to view long term chart. Click on ticker or stock name for detailed view. Click on to add stock symbol to your watchlist and to view watchlist. |
12Stocks.com List of ETFs that track Biotech Index
| Ticker | ETF Name | Watchlist | Recent Price | Market Intelligence Score | Change % | Week % | Year-to-date % |
| LABD | Biotech Bear 3X | | 9.04 | 56 | -10.19 | -14.12 | -6.76% |
| XBI | Biotech | | 87.41 | 49 | 3.30 | 4.7 | -2.11% |
| LABU | Biotech Bull 3X | | 99.97 | 49 | 10.01 | 14.24 | -18.04% |
| IBB | Biotechnology | | 129.49 | 57 | 2.02 | 2.37 | -4.68% |
| IYH | Healthcare | | 59.18 | 57 | 0.59 | 0.97 | 3.37% |
| IXJ | Global Healthcare | | 89.56 | 57 | 0.27 | 0.49 | 3.27% |
| IHF | Healthcare Providers | | 51.44 | 33 | -0.77 | -0.92 | -2.04% |
| FBT | First NYSE | | 146.06 | 42 | 1.49 | 1.68 | -7.59% |
| BIB | Biotechnology | | 51.42 | 57 | 2.13 | 3.54 | -9.87% |
| CURE | Healthcare Bull 3X | | 109.16 | 64 | 3.07 | 3.66 | 7.29% |
| PBE | Biotech & Genome | | 62.87 | 64 | 3.29 | 4.12 | -4.51% |
| PTH | DWA Healthcare Momentum | | 40.53 | 27 | 0.10 | 1.6 | 3.55% |
| BIS | Short Biotech | | 18.82 | 56 | -5.14 | -6.92 | 4.15% |
| BBH | Biotech | | 159.12 | 57 | 1.72 | 2.23 | -3.74% |
| BTEC | Principal Healthcare Innovators | | 34.74 | 7 | 0.26 | 1.43 | -4.38% |
| BBC | Bio Biotechnology Clinical | | 27.50 | 27 | 5.14 | 7.72 | 12.46% |
| BBP | Bio Biotechnology Products | | 53.47 | 44 | 0.35 | 3.85 | -7.96% |
| 12Stocks.com: Charts, Trends, Fundamental Data and Performances of Biotech Stocks | |
|
We now take in-depth look at all Biotech stocks including charts, multi-period performances and overall trends (as measured by market intelligence score). One can sort Biotech stocks (click link to choose) by Daily, Weekly and by Year-to-Date performances. Also, one can sort by size of the company or by market capitalization. |
| Select Your Default Chart Type: | |||||
| |||||
| Click on stock symbol or name for detailed view. Click on to add stock symbol to your watchlist and to view watchlist. Quick View: Move mouse or cursor over "Daily" to quickly view daily Technical stock chart and over "Weekly" to view weekly Technical stock chart. | |||||

 | CABA Cabaletta Bio, Inc. |
| Sector: Health Care | |
| SubSector: Biotechnology | |
| MarketCap: 222.085 Millions | |
| Recent Price: 12.38 Market Intelligence Score: 25 | |
| Day Percent Change: 16.30% Day Change: 1.74 | |
| Week Change: 12.44% Year-to-date Change: -45.5% | |
| CABA Links: Profile News Message Board | |
| Charts:- Daily , Weekly | |
| Add CABA to Watchlist: View: Get Complete CABA Trend Analysis ➞ | |
 | NKTX Nkarta, Inc. |
| Sector: Health Care | |
| SubSector: Biotechnology | |
| MarketCap: 23487 Millions | |
| Recent Price: 7.50 Market Intelligence Score: 25 | |
| Day Percent Change: 12.28% Day Change: 0.82 | |
| Week Change: 9.17% Year-to-date Change: 13.7% | |
| NKTX Links: Profile News Message Board | |
| Charts:- Daily , Weekly | |
| Add NKTX to Watchlist: View: Get Complete NKTX Trend Analysis ➞ | |
 | ANNX Annexon, Inc. |
| Sector: Health Care | |
| SubSector: Biotechnology | |
| MarketCap: 94487 Millions | |
| Recent Price: 4.74 Market Intelligence Score: 24 | |
| Day Percent Change: 4.18% Day Change: 0.19 | |
| Week Change: 0.85% Year-to-date Change: 4.0% | |
| ANNX Links: Profile News Message Board | |
| Charts:- Daily , Weekly | |
| Add ANNX to Watchlist: View: Get Complete ANNX Trend Analysis ➞ | |
 | PRQR ProQR Therapeutics N.V. |
| Sector: Health Care | |
| SubSector: Biotechnology | |
| MarketCap: 324.385 Millions | |
| Recent Price: 2.00 Market Intelligence Score: 24 | |
| Day Percent Change: 2.84% Day Change: 0.06 | |
| Week Change: 2.84% Year-to-date Change: 0.8% | |
| PRQR Links: Profile News Message Board | |
| Charts:- Daily , Weekly | |
| Add PRQR to Watchlist: View: Get Complete PRQR Trend Analysis ➞ | |
 | ALGS Aligos Therapeutics, Inc. |
| Sector: Health Care | |
| SubSector: Biotechnology | |
| MarketCap: 76487 Millions | |
| Recent Price: 0.77 Market Intelligence Score: 23 | |
| Day Percent Change: 1.25% Day Change: 0.01 | |
| Week Change: -0.95% Year-to-date Change: 18.9% | |
| ALGS Links: Profile News Message Board | |
| Charts:- Daily , Weekly | |
| Add ALGS to Watchlist: View: Get Complete ALGS Trend Analysis ➞ | |
 | IMRX Immuneering Corporation |
| Sector: Health Care | |
| SubSector: Biotechnology | |
| MarketCap: 303 Millions | |
| Recent Price: 1.54 Market Intelligence Score: 22 | |
| Day Percent Change: 8.45% Day Change: 0.12 | |
| Week Change: 4.76% Year-to-date Change: -79.7% | |
| IMRX Links: Profile News Message Board | |
| Charts:- Daily , Weekly | |
| Add IMRX to Watchlist: View: Get Complete IMRX Trend Analysis ➞ | |
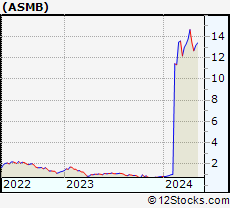 | ASMB Assembly Biosciences, Inc. |
| Sector: Health Care | |
| SubSector: Biotechnology | |
| MarketCap: 569.485 Millions | |
| Recent Price: 13.29 Market Intelligence Score: 22 | |
| Day Percent Change: 6.58% Day Change: 0.82 | |
| Week Change: 5.06% Year-to-date Change: 1,520.5% | |
| ASMB Links: Profile News Message Board | |
| Charts:- Daily , Weekly | |
| Add ASMB to Watchlist: View: Get Complete ASMB Trend Analysis ➞ | |
 | VOR Vor Biopharma Inc. |
| Sector: Health Care | |
| SubSector: Biotechnology | |
| MarketCap: 224 Millions | |
| Recent Price: 1.77 Market Intelligence Score: 22 | |
| Day Percent Change: 2.91% Day Change: 0.05 | |
| Week Change: 4.73% Year-to-date Change: -20.3% | |
| VOR Links: Profile News Message Board | |
| Charts:- Daily , Weekly | |
| Add VOR to Watchlist: View: Get Complete VOR Trend Analysis ➞ | |
 | RLMD Relmada Therapeutics, Inc. |
| Sector: Health Care | |
| SubSector: Biotechnology | |
| MarketCap: 499.685 Millions | |
| Recent Price: 3.70 Market Intelligence Score: 22 | |
| Day Percent Change: 1.65% Day Change: 0.06 | |
| Week Change: -3.39% Year-to-date Change: -10.6% | |
| RLMD Links: Profile News Message Board | |
| Charts:- Daily , Weekly | |
| Add RLMD to Watchlist: View: Get Complete RLMD Trend Analysis ➞ | |
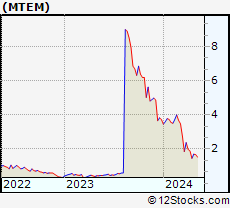 | MTEM Molecular Templates, Inc. |
| Sector: Health Care | |
| SubSector: Biotechnology | |
| MarketCap: 662.785 Millions | |
| Recent Price: 1.66 Market Intelligence Score: 22 | |
| Day Percent Change: 0.00% Day Change: 0.00 | |
| Week Change: -2.64% Year-to-date Change: -55.5% | |
| MTEM Links: Profile News Message Board | |
| Charts:- Daily , Weekly | |
| Add MTEM to Watchlist: View: Get Complete MTEM Trend Analysis ➞ | |
 | CHRS Coherus BioSciences, Inc. |
| Sector: Health Care | |
| SubSector: Biotechnology | |
| MarketCap: 1073.45 Millions | |
| Recent Price: 2.06 Market Intelligence Score: 20 | |
| Day Percent Change: 5.10% Day Change: 0.10 | |
| Week Change: 0.98% Year-to-date Change: -38.1% | |
| CHRS Links: Profile News Message Board | |
| Charts:- Daily , Weekly | |
| Add CHRS to Watchlist: View: Get Complete CHRS Trend Analysis ➞ | |
 | APLS Apellis Pharmaceuticals, Inc. |
| Sector: Health Care | |
| SubSector: Biotechnology | |
| MarketCap: 2030.95 Millions | |
| Recent Price: 46.07 Market Intelligence Score: 20 | |
| Day Percent Change: 4.25% Day Change: 1.88 | |
| Week Change: -7.6% Year-to-date Change: -23.0% | |
| APLS Links: Profile News Message Board | |
| Charts:- Daily , Weekly | |
| Add APLS to Watchlist: View: Get Complete APLS Trend Analysis ➞ | |
 | BTAI BioXcel Therapeutics, Inc. |
| Sector: Health Care | |
| SubSector: Biotechnology | |
| MarketCap: 487.485 Millions | |
| Recent Price: 2.56 Market Intelligence Score: 20 | |
| Day Percent Change: 1.39% Day Change: 0.04 | |
| Week Change: -2.85% Year-to-date Change: -13.4% | |
| BTAI Links: Profile News Message Board | |
| Charts:- Daily , Weekly | |
| Add BTAI to Watchlist: View: Get Complete BTAI Trend Analysis ➞ | |
 | VIGL Vigil Neuroscience, Inc. |
| Sector: Health Care | |
| SubSector: Biotechnology | |
| MarketCap: 339 Millions | |
| Recent Price: 2.65 Market Intelligence Score: 20 | |
| Day Percent Change: 1.34% Day Change: 0.04 | |
| Week Change: -2.4% Year-to-date Change: -22.9% | |
| VIGL Links: Profile News Message Board | |
| Charts:- Daily , Weekly | |
| Add VIGL to Watchlist: View: Get Complete VIGL Trend Analysis ➞ | |
 | AKRO Akero Therapeutics, Inc. |
| Sector: Health Care | |
| SubSector: Biotechnology | |
| MarketCap: 675.085 Millions | |
| Recent Price: 20.07 Market Intelligence Score: 20 | |
| Day Percent Change: 0.88% Day Change: 0.18 | |
| Week Change: 1.65% Year-to-date Change: -14.1% | |
| AKRO Links: Profile News Message Board | |
| Charts:- Daily , Weekly | |
| Add AKRO to Watchlist: View: Get Complete AKRO Trend Analysis ➞ | |
 | APTO Aptose Biosciences Inc. |
| Sector: Health Care | |
| SubSector: Biotechnology | |
| MarketCap: 484.585 Millions | |
| Recent Price: 1.20 Market Intelligence Score: 20 | |
| Day Percent Change: 0.00% Day Change: 0.00 | |
| Week Change: -1.64% Year-to-date Change: -52.8% | |
| APTO Links: Profile News Message Board | |
| Charts:- Daily , Weekly | |
| Add APTO to Watchlist: View: Get Complete APTO Trend Analysis ➞ | |
 | APLM Apollomics, Inc. |
| Sector: Health Care | |
| SubSector: Biotechnology | |
| MarketCap: 481 Millions | |
| Recent Price: 0.41 Market Intelligence Score: 20 | |
| Day Percent Change: -3.52% Day Change: -0.02 | |
| Week Change: -8.67% Year-to-date Change: -55.8% | |
| APLM Links: Profile News Message Board | |
| Charts:- Daily , Weekly | |
| Add APLM to Watchlist: View: Get Complete APLM Trend Analysis ➞ | |
 | FBIO Fortress Biotech, Inc. |
| Sector: Health Care | |
| SubSector: Biotechnology | |
| MarketCap: 116.885 Millions | |
| Recent Price: 1.73 Market Intelligence Score: 20 | |
| Day Percent Change: -1.70% Day Change: -0.03 | |
| Week Change: 0.58% Year-to-date Change: -42.5% | |
| FBIO Links: Profile News Message Board | |
| Charts:- Daily , Weekly | |
| Add FBIO to Watchlist: View: Get Complete FBIO Trend Analysis ➞ | |
 | IKNA Ikena Oncology, Inc. |
| Sector: Health Care | |
| SubSector: Biotechnology | |
| MarketCap: 277 Millions | |
| Recent Price: 1.30 Market Intelligence Score: 20 | |
| Day Percent Change: -1.52% Day Change: -0.02 | |
| Week Change: 0% Year-to-date Change: -35.0% | |
| IKNA Links: Profile News Message Board | |
| Charts:- Daily , Weekly | |
| Add IKNA to Watchlist: View: Get Complete IKNA Trend Analysis ➞ | |
 | PASG Passage Bio, Inc. |
| Sector: Health Care | |
| SubSector: Biotechnology | |
| MarketCap: 12787 Millions | |
| Recent Price: 1.35 Market Intelligence Score: 19 | |
| Day Percent Change: 4.65% Day Change: 0.06 | |
| Week Change: 2.27% Year-to-date Change: 33.7% | |
| PASG Links: Profile News Message Board | |
| Charts:- Daily , Weekly | |
| Add PASG to Watchlist: View: Get Complete PASG Trend Analysis ➞ | |
 | MNPR Monopar Therapeutics Inc. |
| Sector: Health Care | |
| SubSector: Biotechnology | |
| MarketCap: 71487 Millions | |
| Recent Price: 0.65 Market Intelligence Score: 19 | |
| Day Percent Change: -1.38% Day Change: -0.01 | |
| Week Change: -1.09% Year-to-date Change: 89.2% | |
| MNPR Links: Profile News Message Board | |
| Charts:- Daily , Weekly | |
| Add MNPR to Watchlist: View: Get Complete MNPR Trend Analysis ➞ | |
 | RIGL Rigel Pharmaceuticals, Inc. |
| Sector: Health Care | |
| SubSector: Biotechnology | |
| MarketCap: 256.585 Millions | |
| Recent Price: 1.08 Market Intelligence Score: 18 | |
| Day Percent Change: 2.38% Day Change: 0.02 | |
| Week Change: -2.27% Year-to-date Change: -25.9% | |
| RIGL Links: Profile News Message Board | |
| Charts:- Daily , Weekly | |
| Add RIGL to Watchlist: View: Get Complete RIGL Trend Analysis ➞ | |
 | FENC Fennec Pharmaceuticals Inc. |
| Sector: Health Care | |
| SubSector: Biotechnology | |
| MarketCap: 126.785 Millions | |
| Recent Price: 9.08 Market Intelligence Score: 18 | |
| Day Percent Change: -1.09% Day Change: -0.10 | |
| Week Change: -1.41% Year-to-date Change: -19.1% | |
| FENC Links: Profile News Message Board | |
| Charts:- Daily , Weekly | |
| Add FENC to Watchlist: View: Get Complete FENC Trend Analysis ➞ | |
 | KOD Kodiak Sciences Inc. |
| Sector: Health Care | |
| SubSector: Biotechnology | |
| MarketCap: 2132.15 Millions | |
| Recent Price: 3.52 Market Intelligence Score: 17 | |
| Day Percent Change: 9.66% Day Change: 0.31 | |
| Week Change: 7.32% Year-to-date Change: 15.8% | |
| KOD Links: Profile News Message Board | |
| Charts:- Daily , Weekly | |
| Add KOD to Watchlist: View: Get Complete KOD Trend Analysis ➞ | |
 | ARCT Arcturus Therapeutics Holdings Inc. |
| Sector: Health Care | |
| SubSector: Biotechnology | |
| MarketCap: 241.385 Millions | |
| Recent Price: 27.90 Market Intelligence Score: 17 | |
| Day Percent Change: 9.09% Day Change: 2.32 | |
| Week Change: 5.07% Year-to-date Change: -11.5% | |
| ARCT Links: Profile News Message Board | |
| Charts:- Daily , Weekly | |
| Add ARCT to Watchlist: View: Get Complete ARCT Trend Analysis ➞ | |
| To view more stocks, click on Next / Previous arrows or select different range: 0 - 25 , 25 - 50 , 50 - 75 , 75 - 100 , 100 - 125 , 125 - 150 , 150 - 175 , 175 - 200 , 200 - 225 , 225 - 250 , 250 - 275 , 275 - 300 , 300 - 325 , 325 - 350 , 350 - 375 , 375 - 400 | ||
| Click To Change The Sort Order: By Market Cap or Company Size Performance: Year-to-date, Week and Day | |
| Select Chart Type: | ||
|
Best Stocks Today 12Stocks.com |
© 2024 12Stocks.com Terms & Conditions Privacy Contact Us
All Information Provided Only For Education And Not To Be Used For Investing or Trading. See Terms & Conditions


One More Thing ... Get Best Stocks Delivered Daily!
Never Ever Miss A Move With Our Top Ten Stocks Lists
Find Best Stocks In Any Market - Bull or Bear Market
Take A Peek At Our Top Ten Stocks Lists: Daily, Weekly, Year-to-Date & Top Trends
Find Best Stocks In Any Market - Bull or Bear Market
Take A Peek At Our Top Ten Stocks Lists: Daily, Weekly, Year-to-Date & Top Trends
Biotech Stocks With Best Up Trends [0-bearish to 100-bullish]: CytomX [100], Bio-Techne [100], Xencor [100], Mesoblast [100], United [100], PTC [100], Cullinan Oncology[100], Agios [100], Day One[100], Corcept [100], Avadel [100]
Best Biotech Stocks Year-to-Date:
Pieris [6339.56%], Avenue [2881.37%], Precision [2791.78%], Inovio [2166.67%], Assembly [1520.53%], Agenus [1499.83%], NuCana [1208.32%], Adverum nologies[1201.81%], Affimed N.V[756%], Mesoblast [555.45%], Corbus [525.33%] Best Biotech Stocks This Week:
CytomX [221.38%], Deciphera [73.07%], Cue Biopharma[39.93%], Poseida [30.52%], Seres [30.3%], Exscientia [27.14%], Nektar [25%], AnaptysBio [23.81%], Janux [22.62%], Personalis [22.53%], Summit [21.24%] Best Biotech Stocks Daily:
CytomX [213.50%], Ventyx [24.63%], Summit [19.08%], Cabaletta Bio[16.30%], Bio-Techne [16.18%], TG [16.07%], Brainstorm Cell[15.44%], Poseida [14.88%], Wave Life[14.40%], Xencor [14.14%], NextCure [14.05%]