
 Login Sign Up


| |||||
 |  | ||||

| 12Stocks.com Market Intelligence |
Best Biotech Stocks
|
|
| Quick Read: Best Biotech Stocks List By Performances & Trends: Daily, Weekly, Year-to-Date, Market Cap (Size) & Technical Trends | |||
| Best Biotech Stocks Views: Quick Browse View, Summary & Slide Show View | |||
| 12Stocks.com Biotech Stocks Performances & Trends Daily | |||||||||
|
|  The overall market intelligence score is 32 (0-bearish to 100-bullish) which puts Biotech sector in short term bearish to neutral trend. The market intelligence score from previous trading session is 10 and an improvement of trend continues.
| ||||||||
Here are the market intelligence trend scores of the most requested Biotech stocks at 12Stocks.com (click stock name for detailed review):
|


| 12Stocks.com: Investing in Biotech sector with Stocks | |
|
The following table helps investors and traders sort through current performance and trends (as measured by market intelligence score) of various
stocks in the Biotech sector. Quick View: Move mouse or cursor over stock symbol (ticker) to view short-term Technical chart and over stock name to view long term chart. Click on  to add stock symbol to your watchlist and to add stock symbol to your watchlist and  to view watchlist. Click on any ticker or stock name for detailed market intelligence report for that stock. to view watchlist. Click on any ticker or stock name for detailed market intelligence report for that stock. |
12Stocks.com Performance of Stocks in Biotech Sector
| Ticker | Stock Name | Watchlist | Category | Recent Price | Market Intelligence Score | Change % | YTD Change% |
| ANVS | Annovis Bio |   | Biotechnology | 12.35 | 100 | 3.96% | -33.96% |
| BMRN | BioMarin | | Biotechnology | 92.31 | 100 | 0.27% | -4.26% |
| PRTC | PureTech Health | | Biotechnology | 28.91 | 100 | 0.00% | 20.91% |
| PMVP | PMV | | Biotechnology | 1.73 | 100 | -4.43% | -44.35% |
| PIRS | Pieris | | Biotechnology | 11.69 | 100 | -2.58% | NA |
| AGIO | Agios | | Biotechnology | 31.59 | 100 | -0.71% | 41.83% |
| AVDL | Avadel | | Biotechnology | 18.04 | 100 | -0.30% | 27.73% |
| MESO | Mesoblast | | Biotechnology | 5.92 | 95 | -1.33% | 438.18% |
| NKTR | Nektar | | Biotechnology | 1.41 | 95 | -1.06% | 148.67% |
| DAWN | Day One | | Biotechnology | 15.48 | 93 | -7.03% | 5.38% |
| AGEN | Agenus | | Biotechnology | 7.12 | 90 | 10.22% | 760.01% |
| XOMA | XOMA | | Biotechnology | 26.18 | 90 | 0.34% | 41.51% |
| ALVR | AlloVir | | Biotechnology | 0.78 | 90 | -2.00% | 14.04% |
| ADMA | ADMA Biologics | | Biotechnology | 6.49 | 90 | -0.84% | 43.47% |
| RNA | Avidity | | Biotechnology | 25.02 | 90 | -0.48% | 176.77% |
| BPMC | Blueprint Medicines | | Biotechnology | 92.51 | 88 | 0.24% | 0.29% |
| HUMA | Humacyte | | Biotechnology | 3.86 | 86 | -1.66% | 35.92% |
| NAMS | NewAmsterdam Pharma | | Biotechnology | 22.18 | 85 | 3.16% | 97.33% |
| HRTX | Heron | | Biotechnology | 2.76 | 85 | -1.43% | 62.35% |
| OPK | OPKO Health | | Biotechnology | 1.24 | 85 | -1.20% | -18.21% |
| SRRK | Scholar Rock | | Biotechnology | 14.30 | 83 | -3.31% | -23.94% |
| RANI | Rani | | Biotechnology | 6.53 | 83 | -1.43% | 97.88% |
| ITCI | Intra-Cellular Therapies | | Biotechnology | 73.50 | 83 | -0.69% | 2.62% |
| EXEL | Exelixis | | Biotechnology | 23.55 | 83 | 1.09% | -1.85% |
| ANIK | Anika | | Biotechnology | 25.93 | 83 | 0.52% | 14.41% |
| To view more stocks, click on Next / Previous arrows or select different range: 0 - 25 , 25 - 50 , 50 - 75 , 75 - 100 , 100 - 125 , 125 - 150 , 150 - 175 , 175 - 200 , 200 - 225 , 225 - 250 , 250 - 275 , 275 - 300 , 300 - 325 , 325 - 350 | ||
 | Click To Change The Sort Order: By Market Cap or Company Size Performance: Year-to-date, Week and Day |  |
|
Get the most comprehensive stock market coverage daily at 12Stocks.com ➞ Best Stocks Today ➞ Best Stocks Weekly ➞ Best Stocks Year-to-Date ➞ Best Stocks Trends ➞  Best Stocks Today 12Stocks.com Best Nasdaq Stocks ➞ Best S&P 500 Stocks ➞ Best Tech Stocks ➞ Best Biotech Stocks ➞ |
| Detailed Overview of Biotech Stocks |
| Biotech Technical Overview, Leaders & Laggards, Top Biotech ETF Funds & Detailed Biotech Stocks List, Charts, Trends & More |
| Biotech Sector: Technical Analysis, Trends & YTD Performance | |
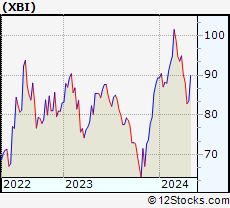
| Biotech sector, as represented by XBI, an exchange-traded fund [ETF] that holds basket of Biotech stocks (e.g, Amgen, Celgene) is down by -4.85% and is currently underperforming the overall market by -10.19% year-to-date. Below is a quick view of Technical charts and trends: | |
 XBI Weekly Chart |
|
| Long Term Trend: Not Good | |
| Medium Term Trend: Not Good | |
 XBI Daily Chart |
|
| Short Term Trend: Very Good | |
| Overall Trend Score: 32 | |
| YTD Performance: -4.85% | |
| **Trend Scores & Views Are Only For Educational Purposes And Not For Investing | |
| 12Stocks.com: Top Performing Biotech Sector Stocks | ||||||||||||||||||||||||||||||||||||||||||||||||
 The top performing Biotech sector stocks year to date are
Now, more recently, over last week, the top performing Biotech sector stocks on the move are


|
||||||||||||||||||||||||||||||||||||||||||||||||
| 12Stocks.com: Investing in Biotech Sector using Exchange Traded Funds | |
|
The following table shows list of key exchange traded funds (ETF) that
help investors track Biotech Index. For detailed view, check out our ETF Funds section of our website. Quick View: Move mouse or cursor over ETF symbol (ticker) to view short-term Technical chart and over ETF name to view long term chart. Click on ticker or stock name for detailed view. Click on to add stock symbol to your watchlist and to view watchlist. |
12Stocks.com List of ETFs that track Biotech Index
| Ticker | ETF Name | Watchlist | Recent Price | Market Intelligence Score | Change % | Week % | Year-to-date % |
| LABD | Biotech Bear 3X | | 9.98 | 55 | -0.89 | -7.59 | 2.99% |
| XBI | Biotech | | 84.96 | 32 | 0.32 | 2.57 | -4.85% |
| IBB | Biotechnology | | 127.76 | 32 | -0.20 | 2.44 | -5.96% |
| LABU | Biotech Bull 3X | | 92.49 | 32 | 0.55 | 7.48 | -24.17% |
| IXJ | Global Healthcare | | 88.93 | 52 | -0.77 | 1.34 | 2.55% |
| IHF | Healthcare Providers | | 51.93 | 55 | -0.75 | -0.54 | -1.11% |
| BBH | Biotech | | 157.97 | 49 | 0.43 | 3.68 | -4.44% |
| 12Stocks.com: Charts, Trends, Fundamental Data and Performances of Biotech Stocks | |
|
We now take in-depth look at all Biotech stocks including charts, multi-period performances and overall trends (as measured by market intelligence score). One can sort Biotech stocks (click link to choose) by Daily, Weekly and by Year-to-Date performances. Also, one can sort by size of the company or by market capitalization. |
| Select Your Default Chart Type: | |||||
| |||||
| Click on stock symbol or name for detailed view. Click on to add stock symbol to your watchlist and to view watchlist. Quick View: Move mouse or cursor over "Daily" to quickly view daily Technical stock chart and over "Weekly" to view weekly Technical stock chart. | |||||

 | ANVS Annovis Bio, Inc. |
| Sector: Health Care | |
| SubSector: Biotechnology | |
| MarketCap: 41487 Millions | |
| Recent Price: 12.35 Market Intelligence Score: 100 | |
| Day Percent Change: 3.96% Day Change: 0.47 | |
| Week Change: 23.5% Year-to-date Change: -34.0% | |
| ANVS Links: Profile News Message Board | |
| Charts:- Daily , Weekly | |
| Add ANVS to Watchlist: View: Get Complete ANVS Trend Analysis ➞ | |
 | BMRN BioMarin Pharmaceutical Inc. |
| Sector: Health Care | |
| SubSector: Biotechnology | |
| MarketCap: 14887.5 Millions | |
| Recent Price: 92.31 Market Intelligence Score: 100 | |
| Day Percent Change: 0.27% Day Change: 0.25 | |
| Week Change: 4.15% Year-to-date Change: -4.3% | |
| BMRN Links: Profile News Message Board | |
| Charts:- Daily , Weekly | |
| Add BMRN to Watchlist: View: Get Complete BMRN Trend Analysis ➞ | |
 | PRTC PureTech Health plc |
| Sector: Health Care | |
| SubSector: Biotechnology | |
| MarketCap: 819 Millions | |
| Recent Price: 28.91 Market Intelligence Score: 100 | |
| Day Percent Change: 0.00% Day Change: 0.00 | |
| Week Change: 10.55% Year-to-date Change: 20.9% | |
| PRTC Links: Profile News Message Board | |
| Charts:- Daily , Weekly | |
| Add PRTC to Watchlist: View: Get Complete PRTC Trend Analysis ➞ | |
 | PMVP PMV Pharmaceuticals, Inc. |
| Sector: Health Care | |
| SubSector: Biotechnology | |
| MarketCap: 20187 Millions | |
| Recent Price: 1.73 Market Intelligence Score: 100 | |
| Day Percent Change: -4.43% Day Change: -0.08 | |
| Week Change: 6.48% Year-to-date Change: -44.4% | |
| PMVP Links: Profile News Message Board | |
| Charts:- Daily , Weekly | |
| Add PMVP to Watchlist: View: Get Complete PMVP Trend Analysis ➞ | |
 | PIRS Pieris Pharmaceuticals, Inc. |
| Sector: Health Care | |
| SubSector: Biotechnology | |
| MarketCap: 150.785 Millions | |
| Recent Price: 11.69 Market Intelligence Score: 100 | |
| Day Percent Change: -2.58% Day Change: -0.31 | |
| Week Change: 7962.07% Year-to-date Change: 6,323.1% | |
| PIRS Links: Profile News Message Board | |
| Charts:- Daily , Weekly | |
| Add PIRS to Watchlist: View: Get Complete PIRS Trend Analysis ➞ | |
 | AGIO Agios Pharmaceuticals, Inc. |
| Sector: Health Care | |
| SubSector: Biotechnology | |
| MarketCap: 2613.35 Millions | |
| Recent Price: 31.59 Market Intelligence Score: 100 | |
| Day Percent Change: -0.71% Day Change: -0.22 | |
| Week Change: 6.96% Year-to-date Change: 41.8% | |
| AGIO Links: Profile News Message Board | |
| Charts:- Daily , Weekly | |
| Add AGIO to Watchlist: View: Get Complete AGIO Trend Analysis ➞ | |
 | AVDL Avadel Pharmaceuticals plc |
| Sector: Health Care | |
| SubSector: Biotechnology | |
| MarketCap: 354.485 Millions | |
| Recent Price: 18.04 Market Intelligence Score: 100 | |
| Day Percent Change: -0.30% Day Change: -0.05 | |
| Week Change: 4.07% Year-to-date Change: 27.7% | |
| AVDL Links: Profile News Message Board | |
| Charts:- Daily , Weekly | |
| Add AVDL to Watchlist: View: Get Complete AVDL Trend Analysis ➞ | |
 | MESO Mesoblast Limited |
| Sector: Health Care | |
| SubSector: Biotechnology | |
| MarketCap: 471.385 Millions | |
| Recent Price: 5.92 Market Intelligence Score: 95 | |
| Day Percent Change: -1.33% Day Change: -0.08 | |
| Week Change: 13.63% Year-to-date Change: 438.2% | |
| MESO Links: Profile News Message Board | |
| Charts:- Daily , Weekly | |
| Add MESO to Watchlist: View: Get Complete MESO Trend Analysis ➞ | |
 | NKTR Nektar Therapeutics |
| Sector: Health Care | |
| SubSector: Biotechnology | |
| MarketCap: 2953.45 Millions | |
| Recent Price: 1.41 Market Intelligence Score: 95 | |
| Day Percent Change: -1.06% Day Change: -0.01 | |
| Week Change: 13.31% Year-to-date Change: 148.7% | |
| NKTR Links: Profile News Message Board | |
| Charts:- Daily , Weekly | |
| Add NKTR to Watchlist: View: Get Complete NKTR Trend Analysis ➞ | |
 | DAWN Day One Biopharmaceuticals, Inc. |
| Sector: Health Care | |
| SubSector: Biotechnology | |
| MarketCap: 1040 Millions | |
| Recent Price: 15.48 Market Intelligence Score: 93 | |
| Day Percent Change: -7.03% Day Change: -1.17 | |
| Week Change: 3.48% Year-to-date Change: 5.4% | |
| DAWN Links: Profile News Message Board | |
| Charts:- Daily , Weekly | |
| Add DAWN to Watchlist: View: Get Complete DAWN Trend Analysis ➞ | |
 | AGEN Agenus Inc. |
| Sector: Health Care | |
| SubSector: Biotechnology | |
| MarketCap: 274.885 Millions | |
| Recent Price: 7.12 Market Intelligence Score: 90 | |
| Day Percent Change: 10.22% Day Change: 0.66 | |
| Week Change: 34.09% Year-to-date Change: 760.0% | |
| AGEN Links: Profile News Message Board | |
| Charts:- Daily , Weekly | |
| Add AGEN to Watchlist: View: Get Complete AGEN Trend Analysis ➞ | |
 | XOMA XOMA Corporation |
| Sector: Health Care | |
| SubSector: Biotechnology | |
| MarketCap: 174.885 Millions | |
| Recent Price: 26.18 Market Intelligence Score: 90 | |
| Day Percent Change: 0.34% Day Change: 0.09 | |
| Week Change: 2.75% Year-to-date Change: 41.5% | |
| XOMA Links: Profile News Message Board | |
| Charts:- Daily , Weekly | |
| Add XOMA to Watchlist: View: Get Complete XOMA Trend Analysis ➞ | |
 | ALVR AlloVir, Inc. |
| Sector: Health Care | |
| SubSector: Biotechnology | |
| MarketCap: 25787 Millions | |
| Recent Price: 0.78 Market Intelligence Score: 90 | |
| Day Percent Change: -2.00% Day Change: -0.02 | |
| Week Change: 3.11% Year-to-date Change: 14.0% | |
| ALVR Links: Profile News Message Board | |
| Charts:- Daily , Weekly | |
| Add ALVR to Watchlist: View: Get Complete ALVR Trend Analysis ➞ | |
 | ADMA ADMA Biologics, Inc. |
| Sector: Health Care | |
| SubSector: Biotechnology | |
| MarketCap: 204.985 Millions | |
| Recent Price: 6.49 Market Intelligence Score: 90 | |
| Day Percent Change: -0.84% Day Change: -0.05 | |
| Week Change: 3.43% Year-to-date Change: 43.5% | |
| ADMA Links: Profile News Message Board | |
| Charts:- Daily , Weekly | |
| Add ADMA to Watchlist: View: Get Complete ADMA Trend Analysis ➞ | |
 | RNA Avidity Biosciences, Inc. |
| Sector: Health Care | |
| SubSector: Biotechnology | |
| MarketCap: 12287 Millions | |
| Recent Price: 25.02 Market Intelligence Score: 90 | |
| Day Percent Change: -0.48% Day Change: -0.12 | |
| Week Change: 9.11% Year-to-date Change: 176.8% | |
| RNA Links: Profile News Message Board | |
| Charts:- Daily , Weekly | |
| Add RNA to Watchlist: View: Get Complete RNA Trend Analysis ➞ | |
 | BPMC Blueprint Medicines Corporation |
| Sector: Health Care | |
| SubSector: Biotechnology | |
| MarketCap: 3113.55 Millions | |
| Recent Price: 92.51 Market Intelligence Score: 88 | |
| Day Percent Change: 0.24% Day Change: 0.22 | |
| Week Change: 6.52% Year-to-date Change: 0.3% | |
| BPMC Links: Profile News Message Board | |
| Charts:- Daily , Weekly | |
| Add BPMC to Watchlist: View: Get Complete BPMC Trend Analysis ➞ | |
 | HUMA Humacyte, Inc. |
| Sector: Health Care | |
| SubSector: Biotechnology | |
| MarketCap: 297 Millions | |
| Recent Price: 3.86 Market Intelligence Score: 86 | |
| Day Percent Change: -1.66% Day Change: -0.06 | |
| Week Change: 4.32% Year-to-date Change: 35.9% | |
| HUMA Links: Profile News Message Board | |
| Charts:- Daily , Weekly | |
| Add HUMA to Watchlist: View: Get Complete HUMA Trend Analysis ➞ | |
 | NAMS NewAmsterdam Pharma Company N.V. |
| Sector: Health Care | |
| SubSector: Biotechnology | |
| MarketCap: 979 Millions | |
| Recent Price: 22.18 Market Intelligence Score: 85 | |
| Day Percent Change: 3.16% Day Change: 0.68 | |
| Week Change: 11.29% Year-to-date Change: 97.3% | |
| NAMS Links: Profile News Message Board | |
| Charts:- Daily , Weekly | |
| Add NAMS to Watchlist: View: Get Complete NAMS Trend Analysis ➞ | |
 | HRTX Heron Therapeutics, Inc. |
| Sector: Health Care | |
| SubSector: Biotechnology | |
| MarketCap: 1172.75 Millions | |
| Recent Price: 2.76 Market Intelligence Score: 85 | |
| Day Percent Change: -1.43% Day Change: -0.04 | |
| Week Change: 4.55% Year-to-date Change: 62.4% | |
| HRTX Links: Profile News Message Board | |
| Charts:- Daily , Weekly | |
| Add HRTX to Watchlist: View: Get Complete HRTX Trend Analysis ➞ | |
 | OPK OPKO Health, Inc. |
| Sector: Health Care | |
| SubSector: Biotechnology | |
| MarketCap: 1116.05 Millions | |
| Recent Price: 1.24 Market Intelligence Score: 85 | |
| Day Percent Change: -1.20% Day Change: -0.01 | |
| Week Change: 0.41% Year-to-date Change: -18.2% | |
| OPK Links: Profile News Message Board | |
| Charts:- Daily , Weekly | |
| Add OPK to Watchlist: View: Get Complete OPK Trend Analysis ➞ | |
 | SRRK Scholar Rock Holding Corporation |
| Sector: Health Care | |
| SubSector: Biotechnology | |
| MarketCap: 441.385 Millions | |
| Recent Price: 14.30 Market Intelligence Score: 83 | |
| Day Percent Change: -3.31% Day Change: -0.49 | |
| Week Change: 3.25% Year-to-date Change: -23.9% | |
| SRRK Links: Profile News Message Board | |
| Charts:- Daily , Weekly | |
| Add SRRK to Watchlist: View: Get Complete SRRK Trend Analysis ➞ | |
 | RANI Rani Therapeutics Holdings, Inc. |
| Sector: Health Care | |
| SubSector: Biotechnology | |
| MarketCap: 202 Millions | |
| Recent Price: 6.53 Market Intelligence Score: 83 | |
| Day Percent Change: -1.43% Day Change: -0.09 | |
| Week Change: -7.64% Year-to-date Change: 97.9% | |
| RANI Links: Profile News Message Board | |
| Charts:- Daily , Weekly | |
| Add RANI to Watchlist: View: Get Complete RANI Trend Analysis ➞ | |
 | ITCI Intra-Cellular Therapies, Inc. |
| Sector: Health Care | |
| SubSector: Biotechnology | |
| MarketCap: 991.885 Millions | |
| Recent Price: 73.50 Market Intelligence Score: 83 | |
| Day Percent Change: -0.69% Day Change: -0.51 | |
| Week Change: 1.56% Year-to-date Change: 2.6% | |
| ITCI Links: Profile News Message Board | |
| Charts:- Daily , Weekly | |
| Add ITCI to Watchlist: View: Get Complete ITCI Trend Analysis ➞ | |
 | EXEL Exelixis, Inc. |
| Sector: Health Care | |
| SubSector: Biotechnology | |
| MarketCap: 5254.75 Millions | |
| Recent Price: 23.55 Market Intelligence Score: 83 | |
| Day Percent Change: 1.09% Day Change: 0.26 | |
| Week Change: 4.55% Year-to-date Change: -1.9% | |
| EXEL Links: Profile News Message Board | |
| Charts:- Daily , Weekly | |
| Add EXEL to Watchlist: View: Get Complete EXEL Trend Analysis ➞ | |
 | ANIK Anika Therapeutics, Inc. |
| Sector: Health Care | |
| SubSector: Biotechnology | |
| MarketCap: 438.385 Millions | |
| Recent Price: 25.93 Market Intelligence Score: 83 | |
| Day Percent Change: 0.52% Day Change: 0.14 | |
| Week Change: 0.33% Year-to-date Change: 14.4% | |
| ANIK Links: Profile News Message Board | |
| Charts:- Daily , Weekly | |
| Add ANIK to Watchlist: View: Get Complete ANIK Trend Analysis ➞ | |
| To view more stocks, click on Next / Previous arrows or select different range: 0 - 25 , 25 - 50 , 50 - 75 , 75 - 100 , 100 - 125 , 125 - 150 , 150 - 175 , 175 - 200 , 200 - 225 , 225 - 250 , 250 - 275 , 275 - 300 , 300 - 325 , 325 - 350 | ||
| Click To Change The Sort Order: By Market Cap or Company Size Performance: Year-to-date, Week and Day | |
| Select Chart Type: | ||
|
Best Stocks Today 12Stocks.com |
© 2024 12Stocks.com Terms & Conditions Privacy Contact Us
All Information Provided Only For Education And Not To Be Used For Investing or Trading. See Terms & Conditions


One More Thing ... Get Best Stocks Delivered Daily!
Never Ever Miss A Move With Our Top Ten Stocks Lists
Find Best Stocks In Any Market - Bull or Bear Market
Take A Peek At Our Top Ten Stocks Lists: Daily, Weekly, Year-to-Date & Top Trends
Find Best Stocks In Any Market - Bull or Bear Market
Take A Peek At Our Top Ten Stocks Lists: Daily, Weekly, Year-to-Date & Top Trends
Biotech Stocks With Best Up Trends [0-bearish to 100-bullish]: Annovis Bio[100], BioMarin [100], PureTech Health[100], Avadel [100], Agios [100], Pieris [100], PMV [100], Nektar [95], Mesoblast [95], Day One[93], Agenus [90]
Best Biotech Stocks Year-to-Date:
Pieris [6323.08%], Precision [2679.45%], Inovio [1931.37%], Assembly [1518.1%], Adverum nologies[1359.88%], NuCana [1252.27%], Agenus [760.01%], Affimed N.V[756%], Corbus [500.58%], Mesoblast [438.18%], Janux [352.07%] Best Biotech Stocks This Week:
Pieris [7962.07%], BeyondSpring [35.56%], Agenus [34.09%], Seres [30.01%], Annovis Bio[23.5%], ProKidney [23.28%], Molecular Partners[16.87%], Longboard [15.83%], Cullinan Oncology[14.91%], Mesoblast [13.63%], Nektar [13.31%] Best Biotech Stocks Daily:
Agenus [10.22%], Cullinan Oncology[8.11%], Sage [8.03%], Vigil Neuroscience[7.92%], Annexon [7.66%], BeyondSpring [6.55%], GlycoMimetics [5.93%], Shattuck Labs[5.37%], Geron [5.14%], Biogen [4.77%], Kronos Bio[4.07%]