
 Login Sign Up


| |||||
 |  | ||||

| 12Stocks.com Market Intelligence |
Best Biotech Stocks
|
|
| Quick Read: Best Biotech Stocks List By Performances & Trends: Daily, Weekly, Year-to-Date, Market Cap (Size) & Technical Trends | |||
| Best Biotech Stocks Views: Quick Browse View, Summary & Slide Show View | |||
| 12Stocks.com Biotech Stocks Performances & Trends Daily | |||||||||
|
|  The overall market intelligence score is 49 (0-bearish to 100-bullish) which puts Biotech sector in short term neutral trend. The market intelligence score from previous trading session is 32 and hence an improvement of trend.
| ||||||||
Here are the market intelligence trend scores of the most requested Biotech stocks at 12Stocks.com (click stock name for detailed review):
|


| 12Stocks.com: Investing in Biotech sector with Stocks | |
|
The following table helps investors and traders sort through current performance and trends (as measured by market intelligence score) of various
stocks in the Biotech sector. Quick View: Move mouse or cursor over stock symbol (ticker) to view short-term Technical chart and over stock name to view long term chart. Click on  to add stock symbol to your watchlist and to add stock symbol to your watchlist and  to view watchlist. Click on any ticker or stock name for detailed market intelligence report for that stock. to view watchlist. Click on any ticker or stock name for detailed market intelligence report for that stock. |
12Stocks.com Performance of Stocks in Biotech Sector
| Ticker | Stock Name | Watchlist | Category | Recent Price | Market Intelligence Score | Change % | YTD Change% |
| TNYA | Tenaya |   | Biotechnology | 4.69 | 59 | 3.30% | 47.48% |
| BCRX | BioCryst | | Biotechnology | 4.56 | 59 | 10.41% | -23.87% |
| ADAP | Adaptimmune | | Biotechnology | 1.21 | 59 | 1.68% | 52.59% |
| INCY | yte | | Biotechnology | 52.92 | 59 | 1.67% | -15.72% |
| ILMN | Illumina | | Biotechnology | 124.64 | 59 | 1.29% | -10.49% |
| AXSM | Axsome | | Biotechnology | 74.80 | 59 | 0.71% | -6.02% |
| TNGX | Tango | | Biotechnology | 7.26 | 59 | -5.71% | -26.67% |
| RLYB | Rallybio | | Biotechnology | 1.91 | 59 | -0.78% | -19.28% |
| BLTE | Belite Bio | | Biotechnology | 40.57 | 59 | -0.07% | -10.93% |
| CRBP | Corbus | | Biotechnology | 37.77 | 58 | 1.97% | 525.33% |
| TYRA | Tyra | | Biotechnology | 18.29 | 57 | 6.71% | 37.21% |
| SGMO | Sangamo | | Biotechnology | 0.54 | 57 | 5.61% | 0.09% |
| HALO | Halozyme | | Biotechnology | 39.30 | 57 | 3.15% | 6.33% |
| VRTX | Vertex | | Biotechnology | 402.42 | 57 | 2.45% | -1.10% |
| NUVL | Nuvalent | | Biotechnology | 70.56 | 57 | 2.42% | -3.99% |
| SNDX | Syndax | | Biotechnology | 21.94 | 57 | 3.83% | 1.53% |
| ROIV | Roivant | | Biotechnology | 11.07 | 57 | 1.51% | -0.36% |
| CUE | Cue Biopharma | | Biotechnology | 1.91 | 57 | 0.53% | -27.65% |
| RANI | Rani | | Biotechnology | 6.30 | 56 | -1.25% | 90.91% |
| XBIT | X | | Biotechnology | 8.18 | 56 | 6.65% | 104.50% |
| RVNC | Revance | | Biotechnology | 3.79 | 54 | 4.99% | -56.88% |
| AVIR | Atea | | Biotechnology | 3.87 | 54 | 4.59% | 26.89% |
| DSGN | Design | | Biotechnology | 3.61 | 54 | 2.56% | 35.97% |
| INVA | Innoviva | | Biotechnology | 15.21 | 53 | 0.66% | -5.17% |
| ALNY | Alnylam | | Biotechnology | 149.92 | 52 | 4.15% | -21.68% |
| To view more stocks, click on Next / Previous arrows or select different range: 0 - 25 , 25 - 50 , 50 - 75 , 75 - 100 , 100 - 125 , 125 - 150 , 150 - 175 , 175 - 200 , 200 - 225 , 225 - 250 , 250 - 275 , 275 - 300 , 300 - 325 , 325 - 350 , 350 - 375 , 375 - 400 | ||
 | Click To Change The Sort Order: By Market Cap or Company Size Performance: Year-to-date, Week and Day |  |
|
Get the most comprehensive stock market coverage daily at 12Stocks.com ➞ Best Stocks Today ➞ Best Stocks Weekly ➞ Best Stocks Year-to-Date ➞ Best Stocks Trends ➞  Best Stocks Today 12Stocks.com Best Nasdaq Stocks ➞ Best S&P 500 Stocks ➞ Best Tech Stocks ➞ Best Biotech Stocks ➞ |
| Detailed Overview of Biotech Stocks |
| Biotech Technical Overview, Leaders & Laggards, Top Biotech ETF Funds & Detailed Biotech Stocks List, Charts, Trends & More |
| Biotech Sector: Technical Analysis, Trends & YTD Performance | |
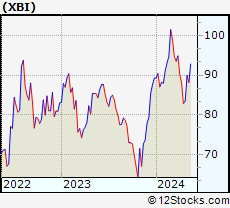
| Biotech sector, as represented by XBI, an exchange-traded fund [ETF] that holds basket of Biotech stocks (e.g, Amgen, Celgene) is down by -2.11% and is currently underperforming the overall market by -6.65% year-to-date. Below is a quick view of Technical charts and trends: | |
 XBI Weekly Chart |
|
| Long Term Trend: Not Good | |
| Medium Term Trend: Not Good | |
 XBI Daily Chart |
|
| Short Term Trend: Very Good | |
| Overall Trend Score: 49 | |
| YTD Performance: -2.11% | |
| **Trend Scores & Views Are Only For Educational Purposes And Not For Investing | |
| 12Stocks.com: Top Performing Biotech Sector Stocks | ||||||||||||||||||||||||||||||||||||||||||||||||
 The top performing Biotech sector stocks year to date are
Now, more recently, over last week, the top performing Biotech sector stocks on the move are


|
||||||||||||||||||||||||||||||||||||||||||||||||
| 12Stocks.com: Investing in Biotech Sector using Exchange Traded Funds | |
|
The following table shows list of key exchange traded funds (ETF) that
help investors track Biotech Index. For detailed view, check out our ETF Funds section of our website. Quick View: Move mouse or cursor over ETF symbol (ticker) to view short-term Technical chart and over ETF name to view long term chart. Click on ticker or stock name for detailed view. Click on to add stock symbol to your watchlist and to view watchlist. |
12Stocks.com List of ETFs that track Biotech Index
| Ticker | ETF Name | Watchlist | Recent Price | Market Intelligence Score | Change % | Week % | Year-to-date % |
| LABD | Biotech Bear 3X | | 9.04 | 56 | -10.19 | -14.12 | -6.76% |
| XBI | Biotech | | 87.41 | 49 | 3.30 | 4.7 | -2.11% |
| LABU | Biotech Bull 3X | | 99.97 | 49 | 10.01 | 14.24 | -18.04% |
| IBB | Biotechnology | | 129.49 | 57 | 2.02 | 2.37 | -4.68% |
| IYH | Healthcare | | 59.18 | 57 | 0.59 | 0.97 | 3.37% |
| IXJ | Global Healthcare | | 89.56 | 57 | 0.27 | 0.49 | 3.27% |
| IHF | Healthcare Providers | | 51.44 | 33 | -0.77 | -0.92 | -2.04% |
| FBT | First NYSE | | 146.06 | 35 | 1.49 | 1.68 | -7.59% |
| BIB | Biotechnology | | 51.42 | 57 | 2.13 | 3.54 | -9.87% |
| CURE | Healthcare Bull 3X | | 109.16 | 50 | 3.07 | 3.66 | 7.29% |
| PBE | Biotech & Genome | | 62.87 | 64 | 3.29 | 4.12 | -4.51% |
| PTH | DWA Healthcare Momentum | | 40.53 | 27 | 0.10 | 1.6 | 3.55% |
| BIS | Short Biotech | | 18.82 | 63 | -5.14 | -6.92 | 4.15% |
| BBH | Biotech | | 159.12 | 50 | 1.72 | 2.23 | -3.74% |
| BTEC | Principal Healthcare Innovators | | 34.74 | 7 | 0.26 | 1.43 | -4.38% |
| BBC | Bio Biotechnology Clinical | | 27.50 | 20 | 5.14 | 7.72 | 12.46% |
| BBP | Bio Biotechnology Products | | 53.47 | 44 | 0.35 | 3.85 | -7.96% |
| 12Stocks.com: Charts, Trends, Fundamental Data and Performances of Biotech Stocks | |
|
We now take in-depth look at all Biotech stocks including charts, multi-period performances and overall trends (as measured by market intelligence score). One can sort Biotech stocks (click link to choose) by Daily, Weekly and by Year-to-Date performances. Also, one can sort by size of the company or by market capitalization. |
| Select Your Default Chart Type: | |||||
| |||||
| Click on stock symbol or name for detailed view. Click on to add stock symbol to your watchlist and to view watchlist. Quick View: Move mouse or cursor over "Daily" to quickly view daily Technical stock chart and over "Weekly" to view weekly Technical stock chart. | |||||

 | TNYA Tenaya Therapeutics, Inc. |
| Sector: Health Care | |
| SubSector: Biotechnology | |
| MarketCap: 395 Millions | |
| Recent Price: 4.69 Market Intelligence Score: 59 | |
| Day Percent Change: 3.30% Day Change: 0.15 | |
| Week Change: 8.82% Year-to-date Change: 47.5% | |
| TNYA Links: Profile News Message Board | |
| Charts:- Daily , Weekly | |
| Add TNYA to Watchlist: View: Get Complete TNYA Trend Analysis ➞ | |
 | BCRX BioCryst Pharmaceuticals, Inc. |
| Sector: Health Care | |
| SubSector: Biotechnology | |
| MarketCap: 369.385 Millions | |
| Recent Price: 4.56 Market Intelligence Score: 59 | |
| Day Percent Change: 10.41% Day Change: 0.43 | |
| Week Change: 9.62% Year-to-date Change: -23.9% | |
| BCRX Links: Profile News Message Board | |
| Charts:- Daily , Weekly | |
| Add BCRX to Watchlist: View: Get Complete BCRX Trend Analysis ➞ | |
 | ADAP Adaptimmune Therapeutics plc |
| Sector: Health Care | |
| SubSector: Biotechnology | |
| MarketCap: 380.985 Millions | |
| Recent Price: 1.21 Market Intelligence Score: 59 | |
| Day Percent Change: 1.68% Day Change: 0.02 | |
| Week Change: 12.56% Year-to-date Change: 52.6% | |
| ADAP Links: Profile News Message Board | |
| Charts:- Daily , Weekly | |
| Add ADAP to Watchlist: View: Get Complete ADAP Trend Analysis ➞ | |
 | INCY Incyte Corporation |
| Sector: Health Care | |
| SubSector: Biotechnology | |
| MarketCap: 15343.2 Millions | |
| Recent Price: 52.92 Market Intelligence Score: 59 | |
| Day Percent Change: 1.67% Day Change: 0.87 | |
| Week Change: 2.4% Year-to-date Change: -15.7% | |
| INCY Links: Profile News Message Board | |
| Charts:- Daily , Weekly | |
| Add INCY to Watchlist: View: Get Complete INCY Trend Analysis ➞ | |
 | ILMN Illumina, Inc. |
| Sector: Health Care | |
| SubSector: Biotechnology | |
| MarketCap: 39194.3 Millions | |
| Recent Price: 124.64 Market Intelligence Score: 59 | |
| Day Percent Change: 1.29% Day Change: 1.59 | |
| Week Change: 1.93% Year-to-date Change: -10.5% | |
| ILMN Links: Profile News Message Board | |
| Charts:- Daily , Weekly | |
| Add ILMN to Watchlist: View: Get Complete ILMN Trend Analysis ➞ | |
 | AXSM Axsome Therapeutics, Inc. |
| Sector: Health Care | |
| SubSector: Biotechnology | |
| MarketCap: 2284.25 Millions | |
| Recent Price: 74.80 Market Intelligence Score: 59 | |
| Day Percent Change: 0.71% Day Change: 0.53 | |
| Week Change: 4.31% Year-to-date Change: -6.0% | |
| AXSM Links: Profile News Message Board | |
| Charts:- Daily , Weekly | |
| Add AXSM to Watchlist: View: Get Complete AXSM Trend Analysis ➞ | |
 | TNGX Tango Therapeutics, Inc. |
| Sector: Health Care | |
| SubSector: Biotechnology | |
| MarketCap: 302 Millions | |
| Recent Price: 7.26 Market Intelligence Score: 59 | |
| Day Percent Change: -5.71% Day Change: -0.44 | |
| Week Change: -2.42% Year-to-date Change: -26.7% | |
| TNGX Links: Profile News Message Board | |
| Charts:- Daily , Weekly | |
| Add TNGX to Watchlist: View: Get Complete TNGX Trend Analysis ➞ | |
 | RLYB Rallybio Corporation |
| Sector: Health Care | |
| SubSector: Biotechnology | |
| MarketCap: 226 Millions | |
| Recent Price: 1.91 Market Intelligence Score: 59 | |
| Day Percent Change: -0.78% Day Change: -0.01 | |
| Week Change: 12.06% Year-to-date Change: -19.3% | |
| RLYB Links: Profile News Message Board | |
| Charts:- Daily , Weekly | |
| Add RLYB to Watchlist: View: Get Complete RLYB Trend Analysis ➞ | |
 | BLTE Belite Bio, Inc |
| Sector: Health Care | |
| SubSector: Biotechnology | |
| MarketCap: 404 Millions | |
| Recent Price: 40.57 Market Intelligence Score: 59 | |
| Day Percent Change: -0.07% Day Change: -0.03 | |
| Week Change: 2.06% Year-to-date Change: -10.9% | |
| BLTE Links: Profile News Message Board | |
| Charts:- Daily , Weekly | |
| Add BLTE to Watchlist: View: Get Complete BLTE Trend Analysis ➞ | |
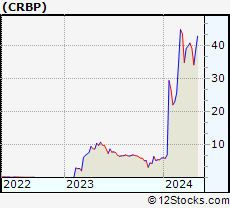 | CRBP Corbus Pharmaceuticals Holdings, Inc. |
| Sector: Health Care | |
| SubSector: Biotechnology | |
| MarketCap: 354.885 Millions | |
| Recent Price: 37.77 Market Intelligence Score: 58 | |
| Day Percent Change: 1.97% Day Change: 0.73 | |
| Week Change: 10.28% Year-to-date Change: 525.3% | |
| CRBP Links: Profile News Message Board | |
| Charts:- Daily , Weekly | |
| Add CRBP to Watchlist: View: Get Complete CRBP Trend Analysis ➞ | |
 | TYRA Tyra Biosciences, Inc. |
| Sector: Health Care | |
| SubSector: Biotechnology | |
| MarketCap: 732 Millions | |
| Recent Price: 18.29 Market Intelligence Score: 57 | |
| Day Percent Change: 6.71% Day Change: 1.15 | |
| Week Change: 16.72% Year-to-date Change: 37.2% | |
| TYRA Links: Profile News Message Board | |
| Charts:- Daily , Weekly | |
| Add TYRA to Watchlist: View: Get Complete TYRA Trend Analysis ➞ | |
 | SGMO Sangamo Therapeutics, Inc. |
| Sector: Health Care | |
| SubSector: Biotechnology | |
| MarketCap: 779.285 Millions | |
| Recent Price: 0.54 Market Intelligence Score: 57 | |
| Day Percent Change: 5.61% Day Change: 0.03 | |
| Week Change: 5.02% Year-to-date Change: 0.1% | |
| SGMO Links: Profile News Message Board | |
| Charts:- Daily , Weekly | |
| Add SGMO to Watchlist: View: Get Complete SGMO Trend Analysis ➞ | |
 | HALO Halozyme Therapeutics, Inc. |
| Sector: Health Care | |
| SubSector: Biotechnology | |
| MarketCap: 2383.75 Millions | |
| Recent Price: 39.30 Market Intelligence Score: 57 | |
| Day Percent Change: 3.15% Day Change: 1.20 | |
| Week Change: 1.89% Year-to-date Change: 6.3% | |
| HALO Links: Profile News Message Board | |
| Charts:- Daily , Weekly | |
| Add HALO to Watchlist: View: Get Complete HALO Trend Analysis ➞ | |
 | VRTX Vertex Pharmaceuticals Incorporated |
| Sector: Health Care | |
| SubSector: Biotechnology | |
| MarketCap: 57669.6 Millions | |
| Recent Price: 402.42 Market Intelligence Score: 57 | |
| Day Percent Change: 2.45% Day Change: 9.61 | |
| Week Change: 1.24% Year-to-date Change: -1.1% | |
| VRTX Links: Profile News Message Board | |
| Charts:- Daily , Weekly | |
| Add VRTX to Watchlist: View: Get Complete VRTX Trend Analysis ➞ | |
 | NUVL Nuvalent, Inc. |
| Sector: Health Care | |
| SubSector: Biotechnology | |
| MarketCap: 2400 Millions | |
| Recent Price: 70.56 Market Intelligence Score: 57 | |
| Day Percent Change: 2.42% Day Change: 1.67 | |
| Week Change: 5.62% Year-to-date Change: -4.0% | |
| NUVL Links: Profile News Message Board | |
| Charts:- Daily , Weekly | |
| Add NUVL to Watchlist: View: Get Complete NUVL Trend Analysis ➞ | |
 | SNDX Syndax Pharmaceuticals, Inc. |
| Sector: Health Care | |
| SubSector: Biotechnology | |
| MarketCap: 365.985 Millions | |
| Recent Price: 21.94 Market Intelligence Score: 57 | |
| Day Percent Change: 3.83% Day Change: 0.81 | |
| Week Change: 4.18% Year-to-date Change: 1.5% | |
| SNDX Links: Profile News Message Board | |
| Charts:- Daily , Weekly | |
| Add SNDX to Watchlist: View: Get Complete SNDX Trend Analysis ➞ | |
 | ROIV Roivant Sciences Ltd. |
| Sector: Health Care | |
| SubSector: Biotechnology | |
| MarketCap: 7780 Millions | |
| Recent Price: 11.07 Market Intelligence Score: 57 | |
| Day Percent Change: 1.51% Day Change: 0.16 | |
| Week Change: 0.27% Year-to-date Change: -0.4% | |
| ROIV Links: Profile News Message Board | |
| Charts:- Daily , Weekly | |
| Add ROIV to Watchlist: View: Get Complete ROIV Trend Analysis ➞ | |
 | CUE Cue Biopharma, Inc. |
| Sector: Health Care | |
| SubSector: Biotechnology | |
| MarketCap: 352.785 Millions | |
| Recent Price: 1.91 Market Intelligence Score: 57 | |
| Day Percent Change: 0.53% Day Change: 0.01 | |
| Week Change: 39.93% Year-to-date Change: -27.7% | |
| CUE Links: Profile News Message Board | |
| Charts:- Daily , Weekly | |
| Add CUE to Watchlist: View: Get Complete CUE Trend Analysis ➞ | |
 | RANI Rani Therapeutics Holdings, Inc. |
| Sector: Health Care | |
| SubSector: Biotechnology | |
| MarketCap: 202 Millions | |
| Recent Price: 6.30 Market Intelligence Score: 56 | |
| Day Percent Change: -1.25% Day Change: -0.08 | |
| Week Change: -5.69% Year-to-date Change: 90.9% | |
| RANI Links: Profile News Message Board | |
| Charts:- Daily , Weekly | |
| Add RANI to Watchlist: View: Get Complete RANI Trend Analysis ➞ | |
 | XBIT XBiotech Inc. |
| Sector: Health Care | |
| SubSector: Biotechnology | |
| MarketCap: 420.385 Millions | |
| Recent Price: 8.18 Market Intelligence Score: 56 | |
| Day Percent Change: 6.65% Day Change: 0.51 | |
| Week Change: 3.94% Year-to-date Change: 104.5% | |
| XBIT Links: Profile News Message Board | |
| Charts:- Daily , Weekly | |
| Add XBIT to Watchlist: View: Get Complete XBIT Trend Analysis ➞ | |
 | RVNC Revance Therapeutics, Inc. |
| Sector: Health Care | |
| SubSector: Biotechnology | |
| MarketCap: 854.185 Millions | |
| Recent Price: 3.79 Market Intelligence Score: 54 | |
| Day Percent Change: 4.99% Day Change: 0.18 | |
| Week Change: 11.47% Year-to-date Change: -56.9% | |
| RVNC Links: Profile News Message Board | |
| Charts:- Daily , Weekly | |
| Add RVNC to Watchlist: View: Get Complete RVNC Trend Analysis ➞ | |
 | AVIR Atea Pharmaceuticals, Inc. |
| Sector: Health Care | |
| SubSector: Biotechnology | |
| MarketCap: 22587 Millions | |
| Recent Price: 3.87 Market Intelligence Score: 54 | |
| Day Percent Change: 4.59% Day Change: 0.17 | |
| Week Change: 4.31% Year-to-date Change: 26.9% | |
| AVIR Links: Profile News Message Board | |
| Charts:- Daily , Weekly | |
| Add AVIR to Watchlist: View: Get Complete AVIR Trend Analysis ➞ | |
 | DSGN Design Therapeutics, Inc. |
| Sector: Health Care | |
| SubSector: Biotechnology | |
| MarketCap: 367 Millions | |
| Recent Price: 3.61 Market Intelligence Score: 54 | |
| Day Percent Change: 2.56% Day Change: 0.09 | |
| Week Change: -4.5% Year-to-date Change: 36.0% | |
| DSGN Links: Profile News Message Board | |
| Charts:- Daily , Weekly | |
| Add DSGN to Watchlist: View: Get Complete DSGN Trend Analysis ➞ | |
 | INVA Innoviva, Inc. |
| Sector: Health Care | |
| SubSector: Biotechnology | |
| MarketCap: 1023.15 Millions | |
| Recent Price: 15.21 Market Intelligence Score: 53 | |
| Day Percent Change: 0.66% Day Change: 0.10 | |
| Week Change: -0.33% Year-to-date Change: -5.2% | |
| INVA Links: Profile News Message Board | |
| Charts:- Daily , Weekly | |
| Add INVA to Watchlist: View: Get Complete INVA Trend Analysis ➞ | |
 | ALNY Alnylam Pharmaceuticals, Inc. |
| Sector: Health Care | |
| SubSector: Biotechnology | |
| MarketCap: 12793.2 Millions | |
| Recent Price: 149.92 Market Intelligence Score: 52 | |
| Day Percent Change: 4.15% Day Change: 5.97 | |
| Week Change: 4.61% Year-to-date Change: -21.7% | |
| ALNY Links: Profile News Message Board | |
| Charts:- Daily , Weekly | |
| Add ALNY to Watchlist: View: Get Complete ALNY Trend Analysis ➞ | |
| To view more stocks, click on Next / Previous arrows or select different range: 0 - 25 , 25 - 50 , 50 - 75 , 75 - 100 , 100 - 125 , 125 - 150 , 150 - 175 , 175 - 200 , 200 - 225 , 225 - 250 , 250 - 275 , 275 - 300 , 300 - 325 , 325 - 350 , 350 - 375 , 375 - 400 | ||
| Click To Change The Sort Order: By Market Cap or Company Size Performance: Year-to-date, Week and Day | |
| Select Chart Type: | ||
|
Best Stocks Today 12Stocks.com |
© 2024 12Stocks.com Terms & Conditions Privacy Contact Us
All Information Provided Only For Education And Not To Be Used For Investing or Trading. See Terms & Conditions


One More Thing ... Get Best Stocks Delivered Daily!
Never Ever Miss A Move With Our Top Ten Stocks Lists
Find Best Stocks In Any Market - Bull or Bear Market
Take A Peek At Our Top Ten Stocks Lists: Daily, Weekly, Year-to-Date & Top Trends
Find Best Stocks In Any Market - Bull or Bear Market
Take A Peek At Our Top Ten Stocks Lists: Daily, Weekly, Year-to-Date & Top Trends
Biotech Stocks With Best Up Trends [0-bearish to 100-bullish]: CytomX [100], Bio-Techne [100], Xencor [100], Mesoblast [100], United [100], PTC [100], Cullinan Oncology[100], Agios [100], Day One[100], Corcept [100], Avadel [100]
Best Biotech Stocks Year-to-Date:
Pieris [6339.56%], Avenue [2881.37%], Precision [2791.78%], Inovio [2166.67%], Assembly [1520.53%], Agenus [1499.83%], NuCana [1208.32%], Adverum nologies[1201.81%], Affimed N.V[756%], Mesoblast [555.45%], Corbus [525.33%] Best Biotech Stocks This Week:
CytomX [221.38%], Deciphera [73.07%], Cue Biopharma[39.93%], Poseida [30.52%], Seres [30.3%], Exscientia [27.14%], Nektar [25%], AnaptysBio [23.81%], Janux [22.62%], Personalis [22.53%], Summit [21.24%] Best Biotech Stocks Daily:
CytomX [213.50%], Ventyx [24.63%], Summit [19.08%], Cabaletta Bio[16.30%], Bio-Techne [16.18%], TG [16.07%], Brainstorm Cell[15.44%], Poseida [14.88%], Wave Life[14.40%], Xencor [14.14%], NextCure [14.05%]