
 Login Sign Up


| |||||
 |  | ||||

| 12Stocks.com Market Intelligence |
Best Biotech Stocks
|
|
| Quick Read: Best Biotech Stocks List By Performances & Trends: Daily, Weekly, Year-to-Date, Market Cap (Size) & Technical Trends | |||
| Best Biotech Stocks Views: Quick Browse View, Summary & Slide Show View | |||
| 12Stocks.com Biotech Stocks Performances & Trends Daily | |||||||||
|
|  The overall market intelligence score is 80 (0-bearish to 100-bullish) which puts Biotech sector in short term neutral to bullish trend. The market intelligence score from previous trading session is 60 and hence an improvement of trend.
| ||||||||
Here are the market intelligence trend scores of the most requested Biotech stocks at 12Stocks.com (click stock name for detailed review):
|


| 12Stocks.com: Investing in Biotech sector with Stocks | |
|
The following table helps investors and traders sort through current performance and trends (as measured by market intelligence score) of various
stocks in the Biotech sector. Quick View: Move mouse or cursor over stock symbol (ticker) to view short-term Technical chart and over stock name to view long term chart. Click on  to add stock symbol to your watchlist and to add stock symbol to your watchlist and  to view watchlist. Click on any ticker or stock name for detailed market intelligence report for that stock. to view watchlist. Click on any ticker or stock name for detailed market intelligence report for that stock. |
12Stocks.com Performance of Stocks in Biotech Sector
| Ticker | Stock Name | Watchlist | Category | Recent Price | Market Intelligence Score | Change % | YTD Change% |
| IDYA | Ideaya |   | Biotechnology | 24.44 | 30 | -1.13 | -2.86% |
| KROS | Keros | | Biotechnology | 15.62 | 70 | -1.14 | -1.88% |
| IMCR | Immunocore | | Biotechnology | 33.41 | 40 | -1.15 | 12.06% |
| IMMP | Immutep | | Biotechnology | 1.67 | 60 | -1.18 | -24.43% |
| IMVT | Immunovant | | Biotechnology | 15.11 | 30 | -1.18 | -40.02% |
| ALDX | Aldeyra | | Biotechnology | 4.90 | 30 | -1.21 | -6.13% |
| SRRK | Scholar Rock | | Biotechnology | 31.95 | 50 | -1.21 | -27.65% |
| EWTX | Edgewise | | Biotechnology | 13.89 | 20 | -1.21 | -48.61% |
| PRTA | Prothena | | Biotechnology | 8.06 | 30 | -1.23 | -41.04% |
| VIR | Vir nology | | Biotechnology | 4.80 | 10 | -1.23 | -33.98% |
| OCX | OncoCyte | | Biotechnology | 3.16 | 50 | -1.25 | 35.62% |
| KOD | Kodiak | | Biotechnology | 9.21 | 50 | -1.29 | 6.84% |
| TARA | Protara | | Biotechnology | 3.03 | 0 | -1.30 | -45.70% |
| KYMR | Kymera | | Biotechnology | 48.12 | 90 | -1.35 | 17.68% |
| ZGNX | Zogenix | | Biotechnology | 2.88 | 0 | -1.37 | 0.00% |
| REPL | Replimune | | Biotechnology | 5.71 | 20 | -1.38 | -54.54% |
| AVRO | AVROBIO | | Biotechnology | 1.40 | 10 | -1.41 | 0.00% |
| DMAC | DiaMedica | | Biotechnology | 6.87 | 60 | -1.43 | 24.68% |
| COGT | Cogent | | Biotechnology | 12.36 | 50 | -1.44 | 58.46% |
| IPHA | Innate Pharma | | Biotechnology | 2.05 | 50 | -1.44 | 9.63% |
| SEER | Seer | | Biotechnology | 2.06 | 40 | -1.44 | -11.59% |
| CGEN | Compugen | | Biotechnology | 1.36 | 10 | -1.45 | -17.58% |
| OCS | Oculis Holding | | Biotechnology | 17.40 | 50 | -1.47 | 2.78% |
| DNLI | Denali | | Biotechnology | 13.06 | 20 | -1.51 | -37.33% |
| CTMX | CytomX | | Biotechnology | 1.93 | 0 | -1.53 | 82.08% |
| To view more stocks, click on Next / Previous arrows or select different range: 0 - 25 , 25 - 50 , 50 - 75 , 75 - 100 , 100 - 125 , 125 - 150 , 150 - 175 , 175 - 200 , 200 - 225 , 225 - 250 , 250 - 275 , 275 - 300 , 300 - 325 , 325 - 350 , 350 - 375 , 375 - 400 , 400 - 425 , 425 - 450 , 450 - 475 | ||
 | Click To Change The Sort Order: By Market Cap or Company Size Performance: Year-to-date, Week and Day |  |
|
Get the most comprehensive stock market coverage daily at 12Stocks.com ➞ Best Stocks Today ➞ Best Stocks Weekly ➞ Best Stocks Year-to-Date ➞ Best Stocks Trends ➞  Best Stocks Today 12Stocks.com Best Nasdaq Stocks ➞ Best S&P 500 Stocks ➞ Best Tech Stocks ➞ Best Biotech Stocks ➞ |
| Detailed Overview of Biotech Stocks |
| Biotech Technical Overview, Leaders & Laggards, Top Biotech ETF Funds & Detailed Biotech Stocks List, Charts, Trends & More |
| Biotech Sector: Technical Analysis, Trends & YTD Performance | |
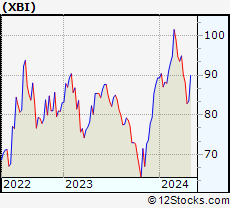
| Biotech sector, as represented by XBI, an exchange-traded fund [ETF] that holds basket of Biotech stocks (e.g, Amgen, Celgene) is up by 4.23268% and is currently underperforming the overall market by -9.35602% year-to-date. Below is a quick view of Technical charts and trends: | |
 XBI Weekly Chart |
|
| Long Term Trend: Very Good | |
| Medium Term Trend: Very Good | |
 XBI Daily Chart |
|
| Short Term Trend: Very Good | |
| Overall Trend Score: 80 | |
| YTD Performance: 4.23268% | |
| **Trend Scores & Views Are Only For Educational Purposes And Not For Investing | |
| 12Stocks.com: Top Performing Biotech Sector Stocks | ||||||||||||||||||||||||||||||||||||||||||||||
 The top performing Biotech sector stocks year to date are
Now, more recently, over last week, the top performing Biotech sector stocks on the move are


|
||||||||||||||||||||||||||||||||||||||||||||||
| 12Stocks.com: Investing in Biotech Sector using Exchange Traded Funds | |
|
The following table shows list of key exchange traded funds (ETF) that
help investors track Biotech Index. For detailed view, check out our ETF Funds section of our website. Quick View: Move mouse or cursor over ETF symbol (ticker) to view short-term Technical chart and over ETF name to view long term chart. Click on ticker or stock name for detailed view. Click on to add stock symbol to your watchlist and to view watchlist. |
12Stocks.com List of ETFs that track Biotech Index
| Ticker | ETF Name | Watchlist | Recent Price | Market Intelligence Score | Change % | Week % | Year-to-date % |
| UBIO | Biotechnology | | 73.34 | 80 | -0.0681292 | 260.748 | 0% |
| HCRF | Edge Multifactor | | 67.14 | 23 | 0 | 9999 | NA |
| SICK | Healthcare Bear 3X | | 37.90 | 36 | 0 | 9999 | NA |
| LABS | Biotech Bear 1X | | 24.18 | 56 | 0 | 9999 | NA |
| BTEC | Principal Healthcare Innovators | | 39.49 | 30 | 0 | 1.02328 | 0% |
| 12Stocks.com: Charts, Trends, Fundamental Data and Performances of Biotech Stocks | |
|
We now take in-depth look at all Biotech stocks including charts, multi-period performances and overall trends (as measured by market intelligence score). One can sort Biotech stocks (click link to choose) by Daily, Weekly and by Year-to-Date performances. Also, one can sort by size of the company or by market capitalization. |
| Select Your Default Chart Type: | |||||
| |||||
| Click on stock symbol or name for detailed view. Click on to add stock symbol to your watchlist and to view watchlist. Quick View: Move mouse or cursor over "Daily" to quickly view daily Technical stock chart and over "Weekly" to view weekly Technical stock chart. | |||||

 | IDYA Ideaya Biosciences Inc |
| Sector: Health Care | |
| SubSector: Biotechnology | |
| MarketCap: 2380.4 Millions | |
| Recent Price: 24.44 Market Intelligence Score: 30 | |
| Day Percent Change: -1.13269% Day Change: 0.31 | |
| Week Change: -1.21261% Year-to-date Change: -2.9% | |
| IDYA Links: Profile News Message Board | |
| Charts:- Daily , Weekly | |
| Add IDYA to Watchlist: View: Get Complete IDYA Trend Analysis ➞ | |
 | KROS Keros Therapeutics Inc |
| Sector: Health Care | |
| SubSector: Biotechnology | |
| MarketCap: 633.19 Millions | |
| Recent Price: 15.62 Market Intelligence Score: 70 | |
| Day Percent Change: -1.13924% Day Change: 0.94 | |
| Week Change: -0.572883% Year-to-date Change: -1.9% | |
| KROS Links: Profile News Message Board | |
| Charts:- Daily , Weekly | |
| Add KROS to Watchlist: View: Get Complete KROS Trend Analysis ➞ | |
 | IMCR Immunocore Holdings plc ADR |
| Sector: Health Care | |
| SubSector: Biotechnology | |
| MarketCap: 1873.76 Millions | |
| Recent Price: 33.41 Market Intelligence Score: 40 | |
| Day Percent Change: -1.15368% Day Change: 0.18 | |
| Week Change: -8.67723% Year-to-date Change: 12.1% | |
| IMCR Links: Profile News Message Board | |
| Charts:- Daily , Weekly | |
| Add IMCR to Watchlist: View: Get Complete IMCR Trend Analysis ➞ | |
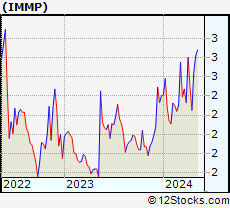 | IMMP Immutep Limited ADR |
| Sector: Health Care | |
| SubSector: Biotechnology | |
| MarketCap: 242.2 Millions | |
| Recent Price: 1.67 Market Intelligence Score: 60 | |
| Day Percent Change: -1.18343% Day Change: -0.02 | |
| Week Change: 4.375% Year-to-date Change: -24.4% | |
| IMMP Links: Profile News Message Board | |
| Charts:- Daily , Weekly | |
| Add IMMP to Watchlist: View: Get Complete IMMP Trend Analysis ➞ | |
 | IMVT Immunovant Inc |
| Sector: Health Care | |
| SubSector: Biotechnology | |
| MarketCap: 2987.79 Millions | |
| Recent Price: 15.11 Market Intelligence Score: 30 | |
| Day Percent Change: -1.17724% Day Change: 0.02 | |
| Week Change: -7.86585% Year-to-date Change: -40.0% | |
| IMVT Links: Profile News Message Board | |
| Charts:- Daily , Weekly | |
| Add IMVT to Watchlist: View: Get Complete IMVT Trend Analysis ➞ | |
 | ALDX Aldeyra Therapeutics Inc |
| Sector: Health Care | |
| SubSector: Biotechnology | |
| MarketCap: 333.02 Millions | |
| Recent Price: 4.90 Market Intelligence Score: 30 | |
| Day Percent Change: -1.20968% Day Change: 0.25 | |
| Week Change: -14.9306% Year-to-date Change: -6.1% | |
| ALDX Links: Profile News Message Board | |
| Charts:- Daily , Weekly | |
| Add ALDX to Watchlist: View: Get Complete ALDX Trend Analysis ➞ | |
 | SRRK Scholar Rock Holding Corp |
| Sector: Health Care | |
| SubSector: Biotechnology | |
| MarketCap: 3019.36 Millions | |
| Recent Price: 31.95 Market Intelligence Score: 50 | |
| Day Percent Change: -1.20594% Day Change: 0.19 | |
| Week Change: 1.17163% Year-to-date Change: -27.6% | |
| SRRK Links: Profile News Message Board | |
| Charts:- Daily , Weekly | |
| Add SRRK to Watchlist: View: Get Complete SRRK Trend Analysis ➞ | |
 | EWTX Edgewise Therapeutics Inc |
| Sector: Health Care | |
| SubSector: Biotechnology | |
| MarketCap: 1640.23 Millions | |
| Recent Price: 13.89 Market Intelligence Score: 20 | |
| Day Percent Change: -1.2091% Day Change: 0.78 | |
| Week Change: -5.83051% Year-to-date Change: -48.6% | |
| EWTX Links: Profile News Message Board | |
| Charts:- Daily , Weekly | |
| Add EWTX to Watchlist: View: Get Complete EWTX Trend Analysis ➞ | |
 | PRTA Prothena Corporation plc |
| Sector: Health Care | |
| SubSector: Biotechnology | |
| MarketCap: 460.25 Millions | |
| Recent Price: 8.06 Market Intelligence Score: 30 | |
| Day Percent Change: -1.22549% Day Change: 0.04 | |
| Week Change: -3.35731% Year-to-date Change: -41.0% | |
| PRTA Links: Profile News Message Board | |
| Charts:- Daily , Weekly | |
| Add PRTA to Watchlist: View: Get Complete PRTA Trend Analysis ➞ | |
 | VIR Vir Biotechnology Inc |
| Sector: Health Care | |
| SubSector: Biotechnology | |
| MarketCap: 732.09 Millions | |
| Recent Price: 4.80 Market Intelligence Score: 10 | |
| Day Percent Change: -1.23457% Day Change: 0.02 | |
| Week Change: -8.39695% Year-to-date Change: -34.0% | |
| VIR Links: Profile News Message Board | |
| Charts:- Daily , Weekly | |
| Add VIR to Watchlist: View: Get Complete VIR Trend Analysis ➞ | |
 | OCX OncoCyte Corporation |
| Sector: Health Care | |
| SubSector: Biotechnology | |
| MarketCap: 131.485 Millions | |
| Recent Price: 3.16 Market Intelligence Score: 50 | |
| Day Percent Change: -1.25% Day Change: -9999 | |
| Week Change: 14.7005% Year-to-date Change: 35.6% | |
| OCX Links: Profile News Message Board | |
| Charts:- Daily , Weekly | |
| Add OCX to Watchlist: View: Get Complete OCX Trend Analysis ➞ | |
 | KOD Kodiak Sciences Inc |
| Sector: Health Care | |
| SubSector: Biotechnology | |
| MarketCap: 555.68 Millions | |
| Recent Price: 9.21 Market Intelligence Score: 50 | |
| Day Percent Change: -1.28617% Day Change: 0.21 | |
| Week Change: -8.4493% Year-to-date Change: 6.8% | |
| KOD Links: Profile News Message Board | |
| Charts:- Daily , Weekly | |
| Add KOD to Watchlist: View: Get Complete KOD Trend Analysis ➞ | |
 | TARA Protara Therapeutics Inc |
| Sector: Health Care | |
| SubSector: Biotechnology | |
| MarketCap: 121.53 Millions | |
| Recent Price: 3.03 Market Intelligence Score: 0 | |
| Day Percent Change: -1.30293% Day Change: 0.07 | |
| Week Change: -2.57235% Year-to-date Change: -45.7% | |
| TARA Links: Profile News Message Board | |
| Charts:- Daily , Weekly | |
| Add TARA to Watchlist: View: Get Complete TARA Trend Analysis ➞ | |
 | KYMR Kymera Therapeutics Inc |
| Sector: Health Care | |
| SubSector: Biotechnology | |
| MarketCap: 3110.86 Millions | |
| Recent Price: 48.12 Market Intelligence Score: 90 | |
| Day Percent Change: -1.35301% Day Change: 0.24 | |
| Week Change: 10.6716% Year-to-date Change: 17.7% | |
| KYMR Links: Profile News Message Board | |
| Charts:- Daily , Weekly | |
| Add KYMR to Watchlist: View: Get Complete KYMR Trend Analysis ➞ | |
 | ZGNX Zogenix, Inc. |
| Sector: Health Care | |
| SubSector: Biotechnology | |
| MarketCap: 1143.75 Millions | |
| Recent Price: 2.88 Market Intelligence Score: 0 | |
| Day Percent Change: -1.36986% Day Change: -9999 | |
| Week Change: -89.2054% Year-to-date Change: 0.0% | |
| ZGNX Links: Profile News Message Board | |
| Charts:- Daily , Weekly | |
| Add ZGNX to Watchlist: View: Get Complete ZGNX Trend Analysis ➞ | |
 | REPL Replimune Group Inc |
| Sector: Health Care | |
| SubSector: Biotechnology | |
| MarketCap: 494.09 Millions | |
| Recent Price: 5.71 Market Intelligence Score: 20 | |
| Day Percent Change: -1.38169% Day Change: 0.35 | |
| Week Change: -1.89003% Year-to-date Change: -54.5% | |
| REPL Links: Profile News Message Board | |
| Charts:- Daily , Weekly | |
| Add REPL to Watchlist: View: Get Complete REPL Trend Analysis ➞ | |
 | AVRO AVROBIO, Inc. |
| Sector: Health Care | |
| SubSector: Biotechnology | |
| MarketCap: 626.185 Millions | |
| Recent Price: 1.40 Market Intelligence Score: 10 | |
| Day Percent Change: -1.40845% Day Change: -9999 | |
| Week Change: -6.04027% Year-to-date Change: 0.0% | |
| AVRO Links: Profile News Message Board | |
| Charts:- Daily , Weekly | |
| Add AVRO to Watchlist: View: Get Complete AVRO Trend Analysis ➞ | |
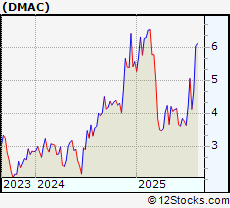 | DMAC DiaMedica Therapeutics Inc |
| Sector: Health Care | |
| SubSector: Biotechnology | |
| MarketCap: 317.37 Millions | |
| Recent Price: 6.87 Market Intelligence Score: 60 | |
| Day Percent Change: -1.43472% Day Change: -0.07 | |
| Week Change: -4.71567% Year-to-date Change: 24.7% | |
| DMAC Links: Profile News Message Board | |
| Charts:- Daily , Weekly | |
| Add DMAC to Watchlist: View: Get Complete DMAC Trend Analysis ➞ | |
 | COGT Cogent Biosciences Inc |
| Sector: Health Care | |
| SubSector: Biotechnology | |
| MarketCap: 1823.1 Millions | |
| Recent Price: 12.36 Market Intelligence Score: 50 | |
| Day Percent Change: -1.43541% Day Change: -0.09 | |
| Week Change: -3.58814% Year-to-date Change: 58.5% | |
| COGT Links: Profile News Message Board | |
| Charts:- Daily , Weekly | |
| Add COGT to Watchlist: View: Get Complete COGT Trend Analysis ➞ | |
 | IPHA Innate Pharma ADR |
| Sector: Health Care | |
| SubSector: Biotechnology | |
| MarketCap: 188.92 Millions | |
| Recent Price: 2.05 Market Intelligence Score: 50 | |
| Day Percent Change: -1.44231% Day Change: 0 | |
| Week Change: 0.244499% Year-to-date Change: 9.6% | |
| IPHA Links: Profile News Message Board | |
| Charts:- Daily , Weekly | |
| Add IPHA to Watchlist: View: Get Complete IPHA Trend Analysis ➞ | |
 | SEER Seer Inc |
| Sector: Health Care | |
| SubSector: Biotechnology | |
| MarketCap: 118.31 Millions | |
| Recent Price: 2.06 Market Intelligence Score: 40 | |
| Day Percent Change: -1.43541% Day Change: 0 | |
| Week Change: 1.9802% Year-to-date Change: -11.6% | |
| SEER Links: Profile News Message Board | |
| Charts:- Daily , Weekly | |
| Add SEER to Watchlist: View: Get Complete SEER Trend Analysis ➞ | |
 | CGEN Compugen Ltd |
| Sector: Health Care | |
| SubSector: Biotechnology | |
| MarketCap: 133.76 Millions | |
| Recent Price: 1.36 Market Intelligence Score: 10 | |
| Day Percent Change: -1.44928% Day Change: -0.01 | |
| Week Change: -4.8951% Year-to-date Change: -17.6% | |
| CGEN Links: Profile News Message Board | |
| Charts:- Daily , Weekly | |
| Add CGEN to Watchlist: View: Get Complete CGEN Trend Analysis ➞ | |
 | OCS Oculis Holding AG |
| Sector: Health Care | |
| SubSector: Biotechnology | |
| MarketCap: 939.07 Millions | |
| Recent Price: 17.40 Market Intelligence Score: 50 | |
| Day Percent Change: -1.47225% Day Change: 0.25 | |
| Week Change: 1.22164% Year-to-date Change: 2.8% | |
| OCS Links: Profile News Message Board | |
| Charts:- Daily , Weekly | |
| Add OCS to Watchlist: View: Get Complete OCS Trend Analysis ➞ | |
 | DNLI Denali Therapeutics Inc |
| Sector: Health Care | |
| SubSector: Biotechnology | |
| MarketCap: 2256.06 Millions | |
| Recent Price: 13.06 Market Intelligence Score: 20 | |
| Day Percent Change: -1.5083% Day Change: 0.72 | |
| Week Change: -14.974% Year-to-date Change: -37.3% | |
| DNLI Links: Profile News Message Board | |
| Charts:- Daily , Weekly | |
| Add DNLI to Watchlist: View: Get Complete DNLI Trend Analysis ➞ | |
 | CTMX CytomX Therapeutics Inc |
| Sector: Health Care | |
| SubSector: Biotechnology | |
| MarketCap: 376 Millions | |
| Recent Price: 1.93 Market Intelligence Score: 0 | |
| Day Percent Change: -1.53061% Day Change: 0.06 | |
| Week Change: -7.6555% Year-to-date Change: 82.1% | |
| CTMX Links: Profile News Message Board | |
| Charts:- Daily , Weekly | |
| Add CTMX to Watchlist: View: Get Complete CTMX Trend Analysis ➞ | |
| To view more stocks, click on Next / Previous arrows or select different range: 0 - 25 , 25 - 50 , 50 - 75 , 75 - 100 , 100 - 125 , 125 - 150 , 150 - 175 , 175 - 200 , 200 - 225 , 225 - 250 , 250 - 275 , 275 - 300 , 300 - 325 , 325 - 350 , 350 - 375 , 375 - 400 , 400 - 425 , 425 - 450 , 450 - 475 | ||
| Click To Change The Sort Order: By Market Cap or Company Size Performance: Year-to-date, Week and Day | |
| Select Chart Type: | ||
|
Best Stocks Today 12Stocks.com |
© 2025 12Stocks.com Terms & Conditions Privacy Contact Us
All Information Provided Only For Education And Not To Be Used For Investing or Trading. See Terms & Conditions


One More Thing ... Get Best Stocks Delivered Daily!
Never Ever Miss A Move With Our Top Ten Stocks Lists
Find Best Stocks In Any Market - Bull or Bear Market
Take A Peek At Our Top Ten Stocks Lists: Daily, Weekly, Year-to-Date & Top Trends
Find Best Stocks In Any Market - Bull or Bear Market
Take A Peek At Our Top Ten Stocks Lists: Daily, Weekly, Year-to-Date & Top Trends
Biotech Stocks With Best Up Trends [0-bearish to 100-bullish]: AlloVir [100], Monopar [100], Cara [100], Corbus [100], Ocugen [100], Spruce [100], Roivant [100], Xencor [100], Oncolytics [100], Tango [100], Arcus [100]
Best Biotech Stocks Year-to-Date:
Kaleido [9900%], Celcuity [315.842%], I-Mab ADR[307.285%], Galectin [292.308%], Immuneering Corp[265.158%], Nektar [254.284%], Precigen [253.704%], Nanobiotix ADR[251.814%], Gossamer Bio[208.247%], DBV Technologies[202.769%], Monopar [199.91%] Best Biotech Stocks This Week:
Athersys [193287%], VBI Vaccines[86898.5%], ContraFect [47677.8%], Clovis Oncology[39610.5%], NanoString Technologies[17224.7%], Neptune Wellness[14100%], Achillion [10033.3%], Kaleido [9900%], Nymox [8258.49%], Epizyme [5739.46%], Portola [4717.55%] Best Biotech Stocks Daily:
Kaleido [9900%], Neoleukin [332.665%], Syros [226.23%], Athenex [103.333%], Aptose [17.5439%], AlloVir [16.9215%], Monopar [16.9123%], Cara [14.3396%], Tyra [14.26%], Zura Bio[13.71%], Corbus [13.1451%]