
 Login Sign Up


| |||||
 |  | ||||

| 12Stocks.com Market Intelligence |
Best Tech Stocks
| In a hurry? Tech Stocks Lists: Performance & Trends, Stock Charts, FANG Stocks
Sort Tech stocks: Daily, Weekly, Year-to-Date, Market Cap & Trends. Filter Tech stocks list by size:All Tech Large Mid-Range Small and MicroCap |
| 12Stocks.com Tech Stocks Performances & Trends Daily | |||||||||
|
|  The overall Smart Investing & Trading Score is 38 (0-bearish to 100-bullish) which puts Technology sector in short term bearish to neutral trend. The Smart Investing & Trading Score from previous trading session is 45 and hence a deterioration of trend.
| ||||||||
Here are the Smart Investing & Trading Scores of the most requested Technology stocks at 12Stocks.com (click stock name for detailed review):
|


| 12Stocks.com: Investing in Technology sector with Stocks | |
|
The following table helps investors and traders sort through current performance and trends (as measured by Smart Investing & Trading Score) of various
stocks in the Tech sector. Quick View: Move mouse or cursor over stock symbol (ticker) to view short-term technical chart and over stock name to view long term chart. Click on  to add stock symbol to your watchlist and to add stock symbol to your watchlist and  to view watchlist. Click on any ticker or stock name for detailed market intelligence report for that stock. to view watchlist. Click on any ticker or stock name for detailed market intelligence report for that stock. |
12Stocks.com Performance of Stocks in Tech Sector
| Ticker | Stock Name | Watchlist | Category | Recent Price | Smart Investing & Trading Score | Change % | YTD Change% |
| NTCT | NetScout Systems |   | Software | 19.90 | 50 | -0.35% | -9.34% |
| CSGS | CSG Systems | | Software | 48.19 | 67 | -3.29% | -9.43% |
| SHOP | Shopify | | Software | 70.55 | 42 | -2.37% | -9.44% |
| TU | TELUS | | Wireless | 16.10 | 60 | 0.12% | -9.50% |
| DCBO | Docebo | | Software | 43.81 | 51 | -1.68% | -9.50% |
| KVHI | KVH Industries | | Communication | 4.76 | 20 | -1.04% | -9.51% |
| FN | Fabrinet | | Electronic | 172.20 | 35 | 1.34% | -9.53% |
| AMKR | Amkor | | Semiconductor | 30.09 | 32 | 0.77% | -9.56% |
| BLKB | Blackbaud | | Software | 78.28 | 57 | -0.13% | -9.71% |
| PAYC | Paycom Software | | Software | 186.58 | 35 | -0.71% | -9.74% |
| ANSS | ANSYS | | Software | 327.04 | 31 | -0.47% | -9.88% |
| SLAB | Silicon | | Semiconductor | 118.93 | 0 | 4.09% | -10.09% |
| AMSWA | American Software | | Software | 10.12 | 10 | -2.41% | -10.44% |
| MDB | MongoDB | | Software | 366.17 | 32 | -0.84% | -10.44% |
| LBTYK | Liberty Global | | CATV | 16.67 | 0 | -0.54% | -10.57% |
| GRPN | on | | Internet | 11.47 | 42 | 8.21% | -10.67% |
| ATHM | Autohome | | Internet | 25.05 | 39 | -0.71% | -10.73% |
| XPER | Xperi | | Semiconductor | 9.83 | 25 | -1.50% | -10.80% |
| VMEO | Vimeo | | Software - | 3.50 | 23 | -0.99% | -10.83% |
| ESE | ESCO | | Instruments | 104.28 | 76 | 0.00% | -10.89% |
| TTWO | Take-Two Interactive | | Software | 143.43 | 42 | 0.42% | -10.89% |
| DXC | DXC | | IT | 20.37 | 52 | -3.14% | -10.93% |
| ADSK | Autodesk | | Software | 216.40 | 10 | 0.65% | -11.12% |
| PHG | Koninklijke Philips | | Electronic | 20.72 | 75 | -1.19% | -11.19% |
| SWI | SolarWinds | | Software | 11.09 | 42 | -1.77% | -11.21% |
| For chart view version of above stock list: Chart View ➞ 0 - 25 , 25 - 50 , 50 - 75 , 75 - 100 , 100 - 125 , 125 - 150 , 150 - 175 , 175 - 200 , 200 - 225 , 225 - 250 , 250 - 275 , 275 - 300 , 300 - 325 , 325 - 350 , 350 - 375 , 375 - 400 , 400 - 425 , 425 - 450 , 450 - 475 , 475 - 500 , 500 - 525 , 525 - 550 , 550 - 575 , 575 - 600 , 600 - 625 , 625 - 650 | ||
 | Click To Change The Sort Order: By Market Cap or Company Size Performance: Year-to-date, Week and Day |  |
|
Get the most comprehensive stock market coverage daily at 12Stocks.com ➞ Best Stocks Today ➞ Best Stocks Weekly ➞ Best Stocks Year-to-Date ➞ Best Stocks Trends ➞  Best Stocks Today 12Stocks.com Best Nasdaq Stocks ➞ Best S&P 500 Stocks ➞ Best Tech Stocks ➞ Best Biotech Stocks ➞ |
| Detailed Overview of Tech Stocks |
| Tech Technical Overview, Leaders & Laggards, Top Tech ETF Funds & Detailed Tech Stocks List, Charts, Trends & More |
| Tech Sector: Technical Analysis, Trends & YTD Performance | |
| Technology sector is composed of stocks
from semiconductors, software, web, social media
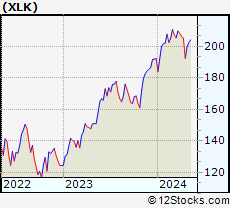
and services subsectors. Technology sector, as represented by XLK, an exchange-traded fund [ETF] that holds basket of tech stocks (e.g, Intel, Google) is up by 2.66% and is currently underperforming the overall market by -2.5% year-to-date. Below is a quick view of technical charts and trends: |
|
 XLK Weekly Chart |
|
| Long Term Trend: Not Good | |
| Medium Term Trend: Not Good | |
 XLK Daily Chart |
|
| Short Term Trend: Very Good | |
| Overall Trend Score: 38 | |
| YTD Performance: 2.66% | |
| **Trend Scores & Views Are Only For Educational Purposes And Not For Investing | |
| 12Stocks.com: Top Performing Technology Sector Stocks | ||||||||||||||||||||||||||||||||||||||||||||||||
 The top performing Technology sector stocks year to date are
Now, more recently, over last week, the top performing Technology sector stocks on the move are


|
||||||||||||||||||||||||||||||||||||||||||||||||
| 12Stocks.com: Investing in Tech Sector using Exchange Traded Funds | |
|
The following table shows list of key exchange traded funds (ETF) that
help investors track Tech Index. For detailed view, check out our ETF Funds section of our website. Quick View: Move mouse or cursor over ETF symbol (ticker) to view short-term technical chart and over ETF name to view long term chart. Click on ticker or stock name for detailed view. Click on to add stock symbol to your watchlist and to view watchlist. |
12Stocks.com List of ETFs that track Tech Index
| Ticker | ETF Name | Watchlist | Recent Price | Smart Investing & Trading Score | Change % | Week % | Year-to-date % |
| XLK | Technology | | 197.60 | 38 | -0.22 | 2.63 | 2.66% |
| QQQ | QQQ | | 424.45 | 51 | -0.48 | 2.36 | 3.65% |
| IYW | Technology | | 128.20 | 51 | -0.50 | 2.77 | 4.44% |
| VGT | Information Technology | | 495.44 | 38 | 0.04 | 3.24 | 2.36% |
| IXN | Global Tech | | 70.75 | 36 | -0.13 | 2.95 | 3.77% |
| IGV | Tech-Software | | 80.19 | 25 | -0.93 | 2.11 | -1.16% |
| XSD | Semiconductor | | 220.63 | 30 | 2.36 | 8.39 | -1.85% |
| TQQQ | QQQ | | 52.85 | 38 | -1.60 | 6.81 | 4.24% |
| SQQQ | Short QQQ | | 12.00 | 44 | 1.61 | -6.54 | -10.78% |
| SOXL | Semicondct Bull 3X | | 37.41 | 58 | 5.41 | 21.5 | 19.14% |
| SOXS | Semicondct Bear 3X | | 37.44 | 51 | -5.48 | -18.84 | 543.3% |
| SOXX | PHLX Semiconductor | | 212.41 | 51 | 1.86 | 7.07 | 10.61% |
| QTEC | First -100-Tech | | 181.18 | 51 | 0.02 | 4.16 | 3.25% |
| SMH | Semiconductor | | 212.20 | 63 | 2.00 | 6.52 | 21.35% |
| 12Stocks.com: Charts, Trends, Fundamental Data and Performances of Tech Stocks | |
|
We now take in-depth look at all Tech stocks including charts, multi-period performances and overall trends (as measured by Smart Investing & Trading Score). One can sort Tech stocks (click link to choose) by Daily, Weekly and by Year-to-Date performances. Also, one can sort by size of the company or by market capitalization. |
| Select Your Default Chart Type: | |||||
| |||||
| Click on stock symbol or name for detailed view. Click on to add stock symbol to your watchlist and to view watchlist. Quick View: Move mouse or cursor over "Daily" to quickly view daily technical stock chart and over "Weekly" to view weekly technical stock chart. | |||||


 | NTCT NetScout Systems, Inc. |
| Sector: Technology | |
| SubSector: Business Software & Services | |
| MarketCap: 1657.28 Millions | |
| Recent Price: 19.90 Smart Investing & Trading Score: 50 | |
| Day Percent Change: -0.35% Day Change: -0.07 | |
| Week Change: 2.42% Year-to-date Change: -9.3% | |
| NTCT Links: Profile News Message Board | |
| Charts:- Daily , Weekly | |
| Add NTCT to Watchlist: View: Get Complete NTCT Trend Analysis ➞ | |
 | CSGS CSG Systems International, Inc. |
| Sector: Technology | |
| SubSector: Business Software & Services | |
| MarketCap: 1336.78 Millions | |
| Recent Price: 48.19 Smart Investing & Trading Score: 67 | |
| Day Percent Change: -3.29% Day Change: -1.64 | |
| Week Change: -1.45% Year-to-date Change: -9.4% | |
| CSGS Links: Profile News Message Board | |
| Charts:- Daily , Weekly | |
| Add CSGS to Watchlist: View: Get Complete CSGS Trend Analysis ➞ | |
 | SHOP Shopify Inc. |
| Sector: Technology | |
| SubSector: Application Software | |
| MarketCap: 45164.2 Millions | |
| Recent Price: 70.55 Smart Investing & Trading Score: 42 | |
| Day Percent Change: -2.37% Day Change: -1.71 | |
| Week Change: 1.26% Year-to-date Change: -9.4% | |
| SHOP Links: Profile News Message Board | |
| Charts:- Daily , Weekly | |
| Add SHOP to Watchlist: View: Get Complete SHOP Trend Analysis ➞ | |
 | TU TELUS Corporation |
| Sector: Technology | |
| SubSector: Wireless Communications | |
| MarketCap: 10864.7 Millions | |
| Recent Price: 16.10 Smart Investing & Trading Score: 60 | |
| Day Percent Change: 0.12% Day Change: 0.02 | |
| Week Change: 1.13% Year-to-date Change: -9.5% | |
| TU Links: Profile News Message Board | |
| Charts:- Daily , Weekly | |
| Add TU to Watchlist: View: Get Complete TU Trend Analysis ➞ | |
 | DCBO Docebo Inc. |
| Sector: Technology | |
| SubSector: Software Application | |
| MarketCap: 15787 Millions | |
| Recent Price: 43.81 Smart Investing & Trading Score: 51 | |
| Day Percent Change: -1.68% Day Change: -0.75 | |
| Week Change: -1.17% Year-to-date Change: -9.5% | |
| DCBO Links: Profile News Message Board | |
| Charts:- Daily , Weekly | |
| Add DCBO to Watchlist: View: Get Complete DCBO Trend Analysis ➞ | |
 | KVHI KVH Industries, Inc. |
| Sector: Technology | |
| SubSector: Communication Equipment | |
| MarketCap: 169.939 Millions | |
| Recent Price: 4.76 Smart Investing & Trading Score: 20 | |
| Day Percent Change: -1.04% Day Change: -0.05 | |
| Week Change: -3.64% Year-to-date Change: -9.5% | |
| KVHI Links: Profile News Message Board | |
| Charts:- Daily , Weekly | |
| Add KVHI to Watchlist: View: Get Complete KVHI Trend Analysis ➞ | |
 | FN Fabrinet |
| Sector: Technology | |
| SubSector: Electronic Equipment | |
| MarketCap: 1876 Millions | |
| Recent Price: 172.20 Smart Investing & Trading Score: 35 | |
| Day Percent Change: 1.34% Day Change: 2.27 | |
| Week Change: 6.09% Year-to-date Change: -9.5% | |
| FN Links: Profile News Message Board | |
| Charts:- Daily , Weekly | |
| Add FN to Watchlist: View: Get Complete FN Trend Analysis ➞ | |
 | AMKR Amkor Technology, Inc. |
| Sector: Technology | |
| SubSector: Semiconductor - Integrated Circuits | |
| MarketCap: 1966.2 Millions | |
| Recent Price: 30.09 Smart Investing & Trading Score: 32 | |
| Day Percent Change: 0.77% Day Change: 0.23 | |
| Week Change: 5.58% Year-to-date Change: -9.6% | |
| AMKR Links: Profile News Message Board | |
| Charts:- Daily , Weekly | |
| Add AMKR to Watchlist: View: Get Complete AMKR Trend Analysis ➞ | |
 | BLKB Blackbaud, Inc. |
| Sector: Technology | |
| SubSector: Business Software & Services | |
| MarketCap: 2838.48 Millions | |
| Recent Price: 78.28 Smart Investing & Trading Score: 57 | |
| Day Percent Change: -0.13% Day Change: -0.10 | |
| Week Change: 2.35% Year-to-date Change: -9.7% | |
| BLKB Links: Profile News Message Board | |
| Charts:- Daily , Weekly | |
| Add BLKB to Watchlist: View: Get Complete BLKB Trend Analysis ➞ | |
 | PAYC Paycom Software, Inc. |
| Sector: Technology | |
| SubSector: Application Software | |
| MarketCap: 13041.6 Millions | |
| Recent Price: 186.58 Smart Investing & Trading Score: 35 | |
| Day Percent Change: -0.71% Day Change: -1.33 | |
| Week Change: 1.82% Year-to-date Change: -9.7% | |
| PAYC Links: Profile News Message Board | |
| Charts:- Daily , Weekly | |
| Add PAYC to Watchlist: View: Get Complete PAYC Trend Analysis ➞ | |
 | ANSS ANSYS, Inc. |
| Sector: Technology | |
| SubSector: Application Software | |
| MarketCap: 19497.4 Millions | |
| Recent Price: 327.04 Smart Investing & Trading Score: 31 | |
| Day Percent Change: -0.47% Day Change: -1.53 | |
| Week Change: 1.53% Year-to-date Change: -9.9% | |
| ANSS Links: Profile News Message Board | |
| Charts:- Daily , Weekly | |
| Add ANSS to Watchlist: View: Get Complete ANSS Trend Analysis ➞ | |
 | SLAB Silicon Laboratories Inc. |
| Sector: Technology | |
| SubSector: Semiconductor - Integrated Circuits | |
| MarketCap: 3710.2 Millions | |
| Recent Price: 118.93 Smart Investing & Trading Score: 0 | |
| Day Percent Change: 4.09% Day Change: 4.67 | |
| Week Change: 3.25% Year-to-date Change: -10.1% | |
| SLAB Links: Profile News Message Board | |
| Charts:- Daily , Weekly | |
| Add SLAB to Watchlist: View: Get Complete SLAB Trend Analysis ➞ | |
 | AMSWA American Software, Inc. |
| Sector: Technology | |
| SubSector: Application Software | |
| MarketCap: 389.862 Millions | |
| Recent Price: 10.12 Smart Investing & Trading Score: 10 | |
| Day Percent Change: -2.41% Day Change: -0.25 | |
| Week Change: -4.71% Year-to-date Change: -10.4% | |
| AMSWA Links: Profile News Message Board | |
| Charts:- Daily , Weekly | |
| Add AMSWA to Watchlist: View: Get Complete AMSWA Trend Analysis ➞ | |
 | MDB MongoDB, Inc. |
| Sector: Technology | |
| SubSector: Application Software | |
| MarketCap: 7591.22 Millions | |
| Recent Price: 366.17 Smart Investing & Trading Score: 32 | |
| Day Percent Change: -0.84% Day Change: -3.12 | |
| Week Change: 11.87% Year-to-date Change: -10.4% | |
| MDB Links: Profile News Message Board | |
| Charts:- Daily , Weekly | |
| Add MDB to Watchlist: View: Get Complete MDB Trend Analysis ➞ | |
 | LBTYK Liberty Global plc |
| Sector: Technology | |
| SubSector: CATV Systems | |
| MarketCap: 7253.02 Millions | |
| Recent Price: 16.67 Smart Investing & Trading Score: 0 | |
| Day Percent Change: -0.54% Day Change: -0.09 | |
| Week Change: -4.14% Year-to-date Change: -10.6% | |
| LBTYK Links: Profile News Message Board | |
| Charts:- Daily , Weekly | |
| Add LBTYK to Watchlist: View: Get Complete LBTYK Trend Analysis ➞ | |
 | GRPN Groupon, Inc. |
| Sector: Technology | |
| SubSector: Internet Information Providers | |
| MarketCap: 363.18 Millions | |
| Recent Price: 11.47 Smart Investing & Trading Score: 42 | |
| Day Percent Change: 8.21% Day Change: 0.87 | |
| Week Change: 20.61% Year-to-date Change: -10.7% | |
| GRPN Links: Profile News Message Board | |
| Charts:- Daily , Weekly | |
| Add GRPN to Watchlist: View: Get Complete GRPN Trend Analysis ➞ | |
 | ATHM Autohome Inc. |
| Sector: Technology | |
| SubSector: Internet Information Providers | |
| MarketCap: 7984.2 Millions | |
| Recent Price: 25.05 Smart Investing & Trading Score: 39 | |
| Day Percent Change: -0.71% Day Change: -0.18 | |
| Week Change: 3.17% Year-to-date Change: -10.7% | |
| ATHM Links: Profile News Message Board | |
| Charts:- Daily , Weekly | |
| Add ATHM to Watchlist: View: Get Complete ATHM Trend Analysis ➞ | |
 | XPER Xperi Corporation |
| Sector: Technology | |
| SubSector: Semiconductor Equipment & Materials | |
| MarketCap: 631.618 Millions | |
| Recent Price: 9.83 Smart Investing & Trading Score: 25 | |
| Day Percent Change: -1.50% Day Change: -0.15 | |
| Week Change: 2.18% Year-to-date Change: -10.8% | |
| XPER Links: Profile News Message Board | |
| Charts:- Daily , Weekly | |
| Add XPER to Watchlist: View: Get Complete XPER Trend Analysis ➞ | |
 | VMEO Vimeo, Inc. |
| Sector: Technology | |
| SubSector: Software - Application | |
| MarketCap: 678 Millions | |
| Recent Price: 3.50 Smart Investing & Trading Score: 23 | |
| Day Percent Change: -0.99% Day Change: -0.04 | |
| Week Change: -0.85% Year-to-date Change: -10.8% | |
| VMEO Links: Profile News Message Board | |
| Charts:- Daily , Weekly | |
| Add VMEO to Watchlist: View: Get Complete VMEO Trend Analysis ➞ | |
 | ESE ESCO Technologies Inc. |
| Sector: Technology | |
| SubSector: Scientific & Technical Instruments | |
| MarketCap: 1968.03 Millions | |
| Recent Price: 104.28 Smart Investing & Trading Score: 76 | |
| Day Percent Change: 0.00% Day Change: 0.00 | |
| Week Change: 3.33% Year-to-date Change: -10.9% | |
| ESE Links: Profile News Message Board | |
| Charts:- Daily , Weekly | |
| Add ESE to Watchlist: View: Get Complete ESE Trend Analysis ➞ | |
 | TTWO Take-Two Interactive Software, Inc. |
| Sector: Technology | |
| SubSector: Multimedia & Graphics Software | |
| MarketCap: 12479.6 Millions | |
| Recent Price: 143.43 Smart Investing & Trading Score: 42 | |
| Day Percent Change: 0.42% Day Change: 0.60 | |
| Week Change: 2.01% Year-to-date Change: -10.9% | |
| TTWO Links: Profile News Message Board | |
| Charts:- Daily , Weekly | |
| Add TTWO to Watchlist: View: Get Complete TTWO Trend Analysis ➞ | |
 | DXC DXC Technology Company |
| Sector: Technology | |
| SubSector: Information Technology Services | |
| MarketCap: 3622.28 Millions | |
| Recent Price: 20.37 Smart Investing & Trading Score: 52 | |
| Day Percent Change: -3.14% Day Change: -0.66 | |
| Week Change: 1.14% Year-to-date Change: -10.9% | |
| DXC Links: Profile News Message Board | |
| Charts:- Daily , Weekly | |
| Add DXC to Watchlist: View: Get Complete DXC Trend Analysis ➞ | |
 | ADSK Autodesk, Inc. |
| Sector: Technology | |
| SubSector: Technical & System Software | |
| MarketCap: 36975.8 Millions | |
| Recent Price: 216.40 Smart Investing & Trading Score: 10 | |
| Day Percent Change: 0.65% Day Change: 1.40 | |
| Week Change: -0.05% Year-to-date Change: -11.1% | |
| ADSK Links: Profile News Message Board | |
| Charts:- Daily , Weekly | |
| Add ADSK to Watchlist: View: Get Complete ADSK Trend Analysis ➞ | |
 | PHG Koninklijke Philips N.V. |
| Sector: Technology | |
| SubSector: Electronic Equipment | |
| MarketCap: 32405.2 Millions | |
| Recent Price: 20.72 Smart Investing & Trading Score: 75 | |
| Day Percent Change: -1.19% Day Change: -0.25 | |
| Week Change: 3.7% Year-to-date Change: -11.2% | |
| PHG Links: Profile News Message Board | |
| Charts:- Daily , Weekly | |
| Add PHG to Watchlist: View: Get Complete PHG Trend Analysis ➞ | |
 | SWI SolarWinds Corporation |
| Sector: Technology | |
| SubSector: Application Software | |
| MarketCap: 4524.62 Millions | |
| Recent Price: 11.09 Smart Investing & Trading Score: 42 | |
| Day Percent Change: -1.77% Day Change: -0.20 | |
| Week Change: 1.74% Year-to-date Change: -11.2% | |
| SWI Links: Profile News Message Board | |
| Charts:- Daily , Weekly | |
| Add SWI to Watchlist: View: Get Complete SWI Trend Analysis ➞ | |
| For tabular summary view of above stock list: Summary View ➞ 0 - 25 , 25 - 50 , 50 - 75 , 75 - 100 , 100 - 125 , 125 - 150 , 150 - 175 , 175 - 200 , 200 - 225 , 225 - 250 , 250 - 275 , 275 - 300 , 300 - 325 , 325 - 350 , 350 - 375 , 375 - 400 , 400 - 425 , 425 - 450 , 450 - 475 , 475 - 500 , 500 - 525 , 525 - 550 , 550 - 575 , 575 - 600 , 600 - 625 , 625 - 650 | ||
| Click To Change The Sort Order: By Market Cap or Company Size Performance: Year-to-date, Week and Day | |
| Select Chart Type: | ||
|
Best Stocks Today 12Stocks.com |
© 2024 12Stocks.com Terms & Conditions Privacy Contact Us
All Information Provided Only For Education And Not To Be Used For Investing or Trading. See Terms & Conditions


One More Thing ... Get Best Stocks Delivered Daily!
Never Ever Miss A Move With Our Top Ten Stocks Lists
Find Best Stocks In Any Market - Bull or Bear Market
Take A Peek At Our Top Ten Stocks Lists: Daily, Weekly, Year-to-Date & Top Trends
Find Best Stocks In Any Market - Bull or Bear Market
Take A Peek At Our Top Ten Stocks Lists: Daily, Weekly, Year-to-Date & Top Trends
Technology Stocks With Best Up Trends [0-bearish to 100-bullish]: HashiCorp [100], Teradyne [100], Karooooo [100], Cricut [100], Grab [100], Microchip [100], Sanmina [100], JD.com [100], EchoStar [100], Analog Devices[100], Allegro MicroSystems[100]
Best Technology Stocks Year-to-Date:
MediaCo Holding[390.61%], Super Micro[177%], Uxin [172.47%], Smith Micro[168.77%], CXApp [166.41%], CuriosityStream [103.67%], GigaCloud [97.54%], MicroStrategy [96.39%], SoundHound AI[94.39%], Cheetah Mobile[88.16%], NextNav [85.73%] Best Technology Stocks This Week:
Matterport [168.97%], Amesite [58.44%], HashiCorp [36.92%], Impinj [33.73%], WiMi Hologram[33.51%], Ribbon [25.58%], Cheetah Mobile[21.19%], on [20.61%], iQIYI [17.99%], SoundHound AI[17.18%], IonQ [15.37%] Best Technology Stocks Daily:
Impinj [28.65%], HashiCorp [10.69%], Tyler [9.32%], SiTime [8.84%], Cheetah Mobile[8.33%], on [8.21%], Teradyne [8.15%], Karooooo [7.84%], Viomi [7.13%], Comtech Tele[6.86%], CACI [5.93%]