
 Login Sign Up


| |||||
 |  | ||||

| 12Stocks.com Market Intelligence |
Best Tech Stocks
| In a hurry? Tech Stocks Lists: Performance & Trends, Stock Charts, FANG Stocks
Sort Tech stocks: Daily, Weekly, Year-to-Date, Market Cap & Trends. Filter Tech stocks list by size:All Tech Large Mid-Range Small and MicroCap |
| 12Stocks.com Tech Stocks Performances & Trends Daily | |||||||||
|
|  The overall Smart Investing & Trading Score is 32 (0-bearish to 100-bullish) which puts Technology sector in short term bearish to neutral trend. The Smart Investing & Trading Score from previous trading session is 38 and hence a deterioration of trend.
| ||||||||
Here are the Smart Investing & Trading Scores of the most requested Technology stocks at 12Stocks.com (click stock name for detailed review):
|


| 12Stocks.com: Investing in Technology sector with Stocks | |
|
The following table helps investors and traders sort through current performance and trends (as measured by Smart Investing & Trading Score) of various
stocks in the Tech sector. Quick View: Move mouse or cursor over stock symbol (ticker) to view short-term technical chart and over stock name to view long term chart. Click on  to add stock symbol to your watchlist and to add stock symbol to your watchlist and  to view watchlist. Click on any ticker or stock name for detailed market intelligence report for that stock. to view watchlist. Click on any ticker or stock name for detailed market intelligence report for that stock. |
12Stocks.com Performance of Stocks in Tech Sector
| Ticker | Stock Name | Watchlist | Category | Recent Price | Smart Investing & Trading Score | Change % | YTD Change% |
| AMKR | Amkor |   | Semiconductor | 29.85 | 32 | 1.32% | -10.28% |
| PD | PagerDuty | | Software | 20.76 | 10 | -1.38% | -10.32% |
| ACN | Accenture | | IT | 313.54 | 10 | -1.04% | -10.65% |
| CTSH | Cognizant | | IT | 67.48 | 18 | -0.42% | -10.65% |
| DQ | Daqo New | | Semiconductor | 23.75 | 68 | 3.22% | -10.71% |
| FN | Fabrinet | | Electronic | 169.93 | 42 | 0.75% | -10.72% |
| PRO | PROS | | Software | 34.62 | 32 | 1.02% | -10.75% |
| WMG | Warner Music | | Entertainment | 31.95 | 0 | -0.59% | -10.77% |
| RNG | RingCentral | | Software | 30.29 | 37 | -0.79% | -10.78% |
| ESE | ESCO | | Instruments | 104.28 | 90 | -0.32% | -10.89% |
| COMP | Compass | | Software - | 3.31 | 30 | -2.79% | -11.01% |
| TTWO | Take-Two Interactive | | Software | 142.79 | 42 | 0.76% | -11.28% |
| DOCN | DigitalOcean | | Software - Infrastructure | 32.79 | 32 | 0.24% | -11.33% |
| FDS | FactSet Research | | IT | 422.83 | 0 | 0.69% | -11.37% |
| PLXS | Plexus | | Circuit Boards | 95.83 | 80 | -0.78% | -11.38% |
| EVH | Evolent Health | | Healthcare Information | 29.26 | 28 | -2.89% | -11.41% |
| USM | United States | | Wireless | 36.77 | 64 | 2.80% | -11.48% |
| SEMR | Semrush | | Software - | 12.27 | 73 | 0.16% | -11.66% |
| ADSK | Autodesk | | Software | 214.97 | 18 | -1.36% | -11.71% |
| GTLB | GitLab | | Software - | 55.92 | 35 | -0.29% | -11.76% |
| SPSC | SPS Commerce | | Software | 171.01 | 49 | 0.24% | -11.78% |
| ICAD | iCAD | | Software | 1.56 | 43 | 0.00% | -11.86% |
| DIOD | Diodes | | Semiconductor | 70.97 | 93 | 1.85% | -11.86% |
| MXL | MaxLinear | | Semiconductor | 20.93 | 47 | 0.72% | -11.95% |
| AAPL | Apple | | Electronic | 168.99 | 50 | 1.25% | -12.23% |
| For chart view version of above stock list: Chart View ➞ 0 - 25 , 25 - 50 , 50 - 75 , 75 - 100 , 100 - 125 , 125 - 150 , 150 - 175 , 175 - 200 , 200 - 225 , 225 - 250 , 250 - 275 , 275 - 300 , 300 - 325 , 325 - 350 , 350 - 375 , 375 - 400 , 400 - 425 , 425 - 450 , 450 - 475 , 475 - 500 , 500 - 525 , 525 - 550 , 550 - 575 , 575 - 600 , 600 - 625 , 625 - 650 | ||
 | Click To Change The Sort Order: By Market Cap or Company Size Performance: Year-to-date, Week and Day |  |
|
Get the most comprehensive stock market coverage daily at 12Stocks.com ➞ Best Stocks Today ➞ Best Stocks Weekly ➞ Best Stocks Year-to-Date ➞ Best Stocks Trends ➞  Best Stocks Today 12Stocks.com Best Nasdaq Stocks ➞ Best S&P 500 Stocks ➞ Best Tech Stocks ➞ Best Biotech Stocks ➞ |
| Detailed Overview of Tech Stocks |
| Tech Technical Overview, Leaders & Laggards, Top Tech ETF Funds & Detailed Tech Stocks List, Charts, Trends & More |
| Tech Sector: Technical Analysis, Trends & YTD Performance | |
| Technology sector is composed of stocks
from semiconductors, software, web, social media
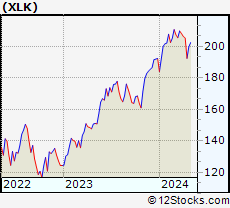
and services subsectors. Technology sector, as represented by XLK, an exchange-traded fund [ETF] that holds basket of tech stocks (e.g, Intel, Google) is up by 2.88% and is currently underperforming the overall market by -2.78% year-to-date. Below is a quick view of technical charts and trends: |
|
 XLK Weekly Chart |
|
| Long Term Trend: Good | |
| Medium Term Trend: Not Good | |
 XLK Daily Chart |
|
| Short Term Trend: Very Good | |
| Overall Trend Score: 32 | |
| YTD Performance: 2.88% | |
| **Trend Scores & Views Are Only For Educational Purposes And Not For Investing | |
| 12Stocks.com: Top Performing Technology Sector Stocks | ||||||||||||||||||||||||||||||||||||||||||||||||
 The top performing Technology sector stocks year to date are
Now, more recently, over last week, the top performing Technology sector stocks on the move are


|
||||||||||||||||||||||||||||||||||||||||||||||||
| 12Stocks.com: Investing in Tech Sector using Exchange Traded Funds | |
|
The following table shows list of key exchange traded funds (ETF) that
help investors track Tech Index. For detailed view, check out our ETF Funds section of our website. Quick View: Move mouse or cursor over ETF symbol (ticker) to view short-term technical chart and over ETF name to view long term chart. Click on ticker or stock name for detailed view. Click on to add stock symbol to your watchlist and to view watchlist. |
12Stocks.com List of ETFs that track Tech Index
| Ticker | ETF Name | Watchlist | Recent Price | Smart Investing & Trading Score | Change % | Week % | Year-to-date % |
| XLK | Technology | | 198.03 | 32 | 0.46 | 2.86 | 2.88% |
| QQQ | QQQ | | 426.44 | 58 | 0.32 | 2.84 | 4.13% |
| IYW | Technology | | 128.84 | 43 | 0.25 | 3.28 | 4.96% |
| VGT | Information Technology | | 495.24 | 30 | 0.16 | 3.2 | 2.32% |
| IXN | Global Tech | | 70.84 | 43 | 0.47 | 3.08 | 3.9% |
| IGV | Tech-Software | | 80.94 | 17 | 0.10 | 3.07 | -0.23% |
| XSD | Semiconductor | | 215.54 | 30 | 2.30 | 5.89 | -4.11% |
| TQQQ | QQQ | | 53.74 | 58 | 1.03 | 8.61 | 6% |
| SQQQ | Short QQQ | | 11.80 | 37 | -0.92 | -8.1 | -12.27% |
| SOXL | Semicondct Bull 3X | | 35.49 | 58 | 4.05 | 15.26 | 13.03% |
| SOXS | Semicondct Bear 3X | | 39.61 | 58 | -3.81 | -14.13 | 580.58% |
| SOXX | PHLX Semiconductor | | 208.62 | 43 | 1.34 | 5.16 | 8.64% |
| QTEC | First -100-Tech | | 181.22 | 30 | 0.73 | 4.19 | 3.28% |
| SMH | Semiconductor | | 208.11 | 58 | 0.15 | 4.47 | 19.01% |
| 12Stocks.com: Charts, Trends, Fundamental Data and Performances of Tech Stocks | |
|
We now take in-depth look at all Tech stocks including charts, multi-period performances and overall trends (as measured by Smart Investing & Trading Score). One can sort Tech stocks (click link to choose) by Daily, Weekly and by Year-to-Date performances. Also, one can sort by size of the company or by market capitalization. |
| Select Your Default Chart Type: | |||||
| |||||
| Click on stock symbol or name for detailed view. Click on to add stock symbol to your watchlist and to view watchlist. Quick View: Move mouse or cursor over "Daily" to quickly view daily technical stock chart and over "Weekly" to view weekly technical stock chart. | |||||


 | AMKR Amkor Technology, Inc. |
| Sector: Technology | |
| SubSector: Semiconductor - Integrated Circuits | |
| MarketCap: 1966.2 Millions | |
| Recent Price: 29.85 Smart Investing & Trading Score: 32 | |
| Day Percent Change: 1.32% Day Change: 0.39 | |
| Week Change: 4.74% Year-to-date Change: -10.3% | |
| AMKR Links: Profile News Message Board | |
| Charts:- Daily , Weekly | |
| Add AMKR to Watchlist: View: Get Complete AMKR Trend Analysis ➞ | |
 | PD PagerDuty, Inc. |
| Sector: Technology | |
| SubSector: Application Software | |
| MarketCap: 1690.32 Millions | |
| Recent Price: 20.76 Smart Investing & Trading Score: 10 | |
| Day Percent Change: -1.38% Day Change: -0.29 | |
| Week Change: 0.73% Year-to-date Change: -10.3% | |
| PD Links: Profile News Message Board | |
| Charts:- Daily , Weekly | |
| Add PD to Watchlist: View: Get Complete PD Trend Analysis ➞ | |
 | ACN Accenture plc |
| Sector: Technology | |
| SubSector: Information Technology Services | |
| MarketCap: 106627 Millions | |
| Recent Price: 313.54 Smart Investing & Trading Score: 10 | |
| Day Percent Change: -1.04% Day Change: -3.29 | |
| Week Change: -1.05% Year-to-date Change: -10.7% | |
| ACN Links: Profile News Message Board | |
| Charts:- Daily , Weekly | |
| Add ACN to Watchlist: View: Get Complete ACN Trend Analysis ➞ | |
 | CTSH Cognizant Technology Solutions Corporation |
| Sector: Technology | |
| SubSector: Information Technology Services | |
| MarketCap: 26249.7 Millions | |
| Recent Price: 67.48 Smart Investing & Trading Score: 18 | |
| Day Percent Change: -0.42% Day Change: -0.28 | |
| Week Change: 0.07% Year-to-date Change: -10.7% | |
| CTSH Links: Profile News Message Board | |
| Charts:- Daily , Weekly | |
| Add CTSH to Watchlist: View: Get Complete CTSH Trend Analysis ➞ | |
 | DQ Daqo New Energy Corp. |
| Sector: Technology | |
| SubSector: Semiconductor Equipment & Materials | |
| MarketCap: 660.918 Millions | |
| Recent Price: 23.75 Smart Investing & Trading Score: 68 | |
| Day Percent Change: 3.22% Day Change: 0.74 | |
| Week Change: 7.42% Year-to-date Change: -10.7% | |
| DQ Links: Profile News Message Board | |
| Charts:- Daily , Weekly | |
| Add DQ to Watchlist: View: Get Complete DQ Trend Analysis ➞ | |
 | FN Fabrinet |
| Sector: Technology | |
| SubSector: Electronic Equipment | |
| MarketCap: 1876 Millions | |
| Recent Price: 169.93 Smart Investing & Trading Score: 42 | |
| Day Percent Change: 0.75% Day Change: 1.26 | |
| Week Change: 4.69% Year-to-date Change: -10.7% | |
| FN Links: Profile News Message Board | |
| Charts:- Daily , Weekly | |
| Add FN to Watchlist: View: Get Complete FN Trend Analysis ➞ | |
 | PRO PROS Holdings, Inc. |
| Sector: Technology | |
| SubSector: Application Software | |
| MarketCap: 1357.42 Millions | |
| Recent Price: 34.62 Smart Investing & Trading Score: 32 | |
| Day Percent Change: 1.02% Day Change: 0.35 | |
| Week Change: 4.03% Year-to-date Change: -10.8% | |
| PRO Links: Profile News Message Board | |
| Charts:- Daily , Weekly | |
| Add PRO to Watchlist: View: Get Complete PRO Trend Analysis ➞ | |
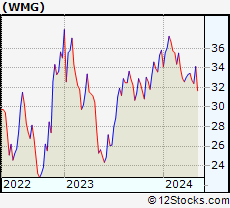 | WMG Warner Music Group Corp. |
| Sector: Technology | |
| SubSector: Entertainment | |
| MarketCap: 17237 Millions | |
| Recent Price: 31.95 Smart Investing & Trading Score: 0 | |
| Day Percent Change: -0.59% Day Change: -0.19 | |
| Week Change: -2.38% Year-to-date Change: -10.8% | |
| WMG Links: Profile News Message Board | |
| Charts:- Daily , Weekly | |
| Add WMG to Watchlist: View: Get Complete WMG Trend Analysis ➞ | |
 | RNG RingCentral, Inc. |
| Sector: Technology | |
| SubSector: Application Software | |
| MarketCap: 17755.3 Millions | |
| Recent Price: 30.29 Smart Investing & Trading Score: 37 | |
| Day Percent Change: -0.79% Day Change: -0.24 | |
| Week Change: 3.17% Year-to-date Change: -10.8% | |
| RNG Links: Profile News Message Board | |
| Charts:- Daily , Weekly | |
| Add RNG to Watchlist: View: Get Complete RNG Trend Analysis ➞ | |
 | ESE ESCO Technologies Inc. |
| Sector: Technology | |
| SubSector: Scientific & Technical Instruments | |
| MarketCap: 1968.03 Millions | |
| Recent Price: 104.28 Smart Investing & Trading Score: 90 | |
| Day Percent Change: -0.32% Day Change: -0.34 | |
| Week Change: 3.33% Year-to-date Change: -10.9% | |
| ESE Links: Profile News Message Board | |
| Charts:- Daily , Weekly | |
| Add ESE to Watchlist: View: Get Complete ESE Trend Analysis ➞ | |
 | COMP Compass, Inc. |
| Sector: Technology | |
| SubSector: Software - Application | |
| MarketCap: 1580 Millions | |
| Recent Price: 3.31 Smart Investing & Trading Score: 30 | |
| Day Percent Change: -2.79% Day Change: -0.10 | |
| Week Change: 2.31% Year-to-date Change: -11.0% | |
| COMP Links: Profile News Message Board | |
| Charts:- Daily , Weekly | |
| Add COMP to Watchlist: View: Get Complete COMP Trend Analysis ➞ | |
 | TTWO Take-Two Interactive Software, Inc. |
| Sector: Technology | |
| SubSector: Multimedia & Graphics Software | |
| MarketCap: 12479.6 Millions | |
| Recent Price: 142.79 Smart Investing & Trading Score: 42 | |
| Day Percent Change: 0.76% Day Change: 1.07 | |
| Week Change: 1.56% Year-to-date Change: -11.3% | |
| TTWO Links: Profile News Message Board | |
| Charts:- Daily , Weekly | |
| Add TTWO to Watchlist: View: Get Complete TTWO Trend Analysis ➞ | |
 | DOCN DigitalOcean Holdings, Inc. |
| Sector: Technology | |
| SubSector: Software - Infrastructure | |
| MarketCap: 3620 Millions | |
| Recent Price: 32.79 Smart Investing & Trading Score: 32 | |
| Day Percent Change: 0.24% Day Change: 0.08 | |
| Week Change: 1.11% Year-to-date Change: -11.3% | |
| DOCN Links: Profile News Message Board | |
| Charts:- Daily , Weekly | |
| Add DOCN to Watchlist: View: Get Complete DOCN Trend Analysis ➞ | |
 | FDS FactSet Research Systems Inc. |
| Sector: Technology | |
| SubSector: Information & Delivery Services | |
| MarketCap: 9024.37 Millions | |
| Recent Price: 422.83 Smart Investing & Trading Score: 0 | |
| Day Percent Change: 0.69% Day Change: 2.89 | |
| Week Change: -2.58% Year-to-date Change: -11.4% | |
| FDS Links: Profile News Message Board | |
| Charts:- Daily , Weekly | |
| Add FDS to Watchlist: View: Get Complete FDS Trend Analysis ➞ | |
 | PLXS Plexus Corp. |
| Sector: Technology | |
| SubSector: Printed Circuit Boards | |
| MarketCap: 1457.15 Millions | |
| Recent Price: 95.83 Smart Investing & Trading Score: 80 | |
| Day Percent Change: -0.78% Day Change: -0.75 | |
| Week Change: 2.78% Year-to-date Change: -11.4% | |
| PLXS Links: Profile News Message Board | |
| Charts:- Daily , Weekly | |
| Add PLXS to Watchlist: View: Get Complete PLXS Trend Analysis ➞ | |
 | EVH Evolent Health, Inc. |
| Sector: Technology | |
| SubSector: Healthcare Information Services | |
| MarketCap: 486.755 Millions | |
| Recent Price: 29.26 Smart Investing & Trading Score: 28 | |
| Day Percent Change: -2.89% Day Change: -0.87 | |
| Week Change: -0.85% Year-to-date Change: -11.4% | |
| EVH Links: Profile News Message Board | |
| Charts:- Daily , Weekly | |
| Add EVH to Watchlist: View: Get Complete EVH Trend Analysis ➞ | |
 | USM United States Cellular Corporation |
| Sector: Technology | |
| SubSector: Wireless Communications | |
| MarketCap: 2587.67 Millions | |
| Recent Price: 36.77 Smart Investing & Trading Score: 64 | |
| Day Percent Change: 2.80% Day Change: 1.00 | |
| Week Change: 3.43% Year-to-date Change: -11.5% | |
| USM Links: Profile News Message Board | |
| Charts:- Daily , Weekly | |
| Add USM to Watchlist: View: Get Complete USM Trend Analysis ➞ | |
 | SEMR Semrush Holdings, Inc. |
| Sector: Technology | |
| SubSector: Software - Application | |
| MarketCap: 1330 Millions | |
| Recent Price: 12.27 Smart Investing & Trading Score: 73 | |
| Day Percent Change: 0.16% Day Change: 0.02 | |
| Week Change: 6.7% Year-to-date Change: -11.7% | |
| SEMR Links: Profile News Message Board | |
| Charts:- Daily , Weekly | |
| Add SEMR to Watchlist: View: Get Complete SEMR Trend Analysis ➞ | |
 | ADSK Autodesk, Inc. |
| Sector: Technology | |
| SubSector: Technical & System Software | |
| MarketCap: 36975.8 Millions | |
| Recent Price: 214.97 Smart Investing & Trading Score: 18 | |
| Day Percent Change: -1.36% Day Change: -2.96 | |
| Week Change: -0.71% Year-to-date Change: -11.7% | |
| ADSK Links: Profile News Message Board | |
| Charts:- Daily , Weekly | |
| Add ADSK to Watchlist: View: Get Complete ADSK Trend Analysis ➞ | |
 | GTLB GitLab Inc. |
| Sector: Technology | |
| SubSector: Software - Application | |
| MarketCap: 7840 Millions | |
| Recent Price: 55.92 Smart Investing & Trading Score: 35 | |
| Day Percent Change: -0.29% Day Change: -0.16 | |
| Week Change: 8.6% Year-to-date Change: -11.8% | |
| GTLB Links: Profile News Message Board | |
| Charts:- Daily , Weekly | |
| Add GTLB to Watchlist: View: Get Complete GTLB Trend Analysis ➞ | |
 | SPSC SPS Commerce, Inc. |
| Sector: Technology | |
| SubSector: Application Software | |
| MarketCap: 1398.02 Millions | |
| Recent Price: 171.01 Smart Investing & Trading Score: 49 | |
| Day Percent Change: 0.24% Day Change: 0.41 | |
| Week Change: 3.33% Year-to-date Change: -11.8% | |
| SPSC Links: Profile News Message Board | |
| Charts:- Daily , Weekly | |
| Add SPSC to Watchlist: View: Get Complete SPSC Trend Analysis ➞ | |
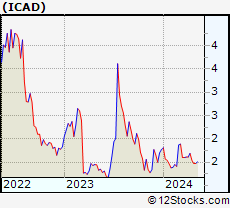 | ICAD iCAD, Inc. |
| Sector: Technology | |
| SubSector: Technical & System Software | |
| MarketCap: 174.8 Millions | |
| Recent Price: 1.56 Smart Investing & Trading Score: 43 | |
| Day Percent Change: 0.00% Day Change: 0.00 | |
| Week Change: 1.3% Year-to-date Change: -11.9% | |
| ICAD Links: Profile News Message Board | |
| Charts:- Daily , Weekly | |
| Add ICAD to Watchlist: View: Get Complete ICAD Trend Analysis ➞ | |
 | DIOD Diodes Incorporated |
| Sector: Technology | |
| SubSector: Semiconductor - Integrated Circuits | |
| MarketCap: 1967.6 Millions | |
| Recent Price: 70.97 Smart Investing & Trading Score: 93 | |
| Day Percent Change: 1.85% Day Change: 1.29 | |
| Week Change: 6.1% Year-to-date Change: -11.9% | |
| DIOD Links: Profile News Message Board | |
| Charts:- Daily , Weekly | |
| Add DIOD to Watchlist: View: Get Complete DIOD Trend Analysis ➞ | |
 | MXL MaxLinear, Inc. |
| Sector: Technology | |
| SubSector: Semiconductor - Integrated Circuits | |
| MarketCap: 751.31 Millions | |
| Recent Price: 20.93 Smart Investing & Trading Score: 47 | |
| Day Percent Change: 0.72% Day Change: 0.15 | |
| Week Change: 6.51% Year-to-date Change: -12.0% | |
| MXL Links: Profile News Message Board | |
| Charts:- Daily , Weekly | |
| Add MXL to Watchlist: View: Get Complete MXL Trend Analysis ➞ | |
 | AAPL Apple Inc. |
| Sector: Technology | |
| SubSector: Electronic Equipment | |
| MarketCap: 1112940 Millions | |
| Recent Price: 168.99 Smart Investing & Trading Score: 50 | |
| Day Percent Change: 1.25% Day Change: 2.09 | |
| Week Change: 2.42% Year-to-date Change: -12.2% | |
| AAPL Links: Profile News Message Board | |
| Charts:- Daily , Weekly | |
| Add AAPL to Watchlist: View: Get Complete AAPL Trend Analysis ➞ | |
| For tabular summary view of above stock list: Summary View ➞ 0 - 25 , 25 - 50 , 50 - 75 , 75 - 100 , 100 - 125 , 125 - 150 , 150 - 175 , 175 - 200 , 200 - 225 , 225 - 250 , 250 - 275 , 275 - 300 , 300 - 325 , 325 - 350 , 350 - 375 , 375 - 400 , 400 - 425 , 425 - 450 , 450 - 475 , 475 - 500 , 500 - 525 , 525 - 550 , 550 - 575 , 575 - 600 , 600 - 625 , 625 - 650 | ||
| Click To Change The Sort Order: By Market Cap or Company Size Performance: Year-to-date, Week and Day | |
| Select Chart Type: | ||
|
Best Stocks Today 12Stocks.com |
© 2024 12Stocks.com Terms & Conditions Privacy Contact Us
All Information Provided Only For Education And Not To Be Used For Investing or Trading. See Terms & Conditions


One More Thing ... Get Best Stocks Delivered Daily!
Never Ever Miss A Move With Our Top Ten Stocks Lists
Find Best Stocks In Any Market - Bull or Bear Market
Take A Peek At Our Top Ten Stocks Lists: Daily, Weekly, Year-to-Date & Top Trends
Find Best Stocks In Any Market - Bull or Bear Market
Take A Peek At Our Top Ten Stocks Lists: Daily, Weekly, Year-to-Date & Top Trends
Technology Stocks With Best Up Trends [0-bearish to 100-bullish]: Amesite [100], Ribbon [100], Allegro MicroSystems[100], Texas [100], Microchip [100], EchoStar [100], Analog Devices[100], Vishay Inter[100], JD.com [100], Sea [100], Jamf Holding[100]
Best Technology Stocks Year-to-Date:
Pagaya [581.02%], MicroCloud Hologram[574.82%], MediaCo Holding[364.79%], Uxin [169.61%], CXApp [167.95%], Super Micro[165.69%], Smith Micro[158.47%], SoundHound AI[103.27%], MicroStrategy [100.3%], GigaCloud [96.01%], NextNav [95.73%] Best Technology Stocks This Week:
Matterport [166.09%], Amesite [69.72%], WiMi Hologram[64.85%], Ribbon [25.78%], HashiCorp [23.7%], SoundHound AI[22.54%], Intchains [20.36%], iQIYI [17.87%], Bilibili [16.91%], FTC Solar[16.56%], BigBear.ai [16.55%] Best Technology Stocks Daily:
Amesite [65.50%], WiMi Hologram[58.53%], Ribbon [26.26%], Intchains [22.28%], Uxin [13.86%], Bilibili [11.01%], Comtech Tele[10.76%], Navitas Semiconductor[8.83%], FTC Solar[8.51%], AMTD Digital[8.33%], Allegro MicroSystems[8.24%]