
 Login Sign Up


| |||||
 |  | ||||

| 12Stocks.com Market Intelligence |
Best Tech Stocks
| In a hurry? Tech Stocks Lists: Performance & Trends, Stock Charts, FANG Stocks
Sort Tech stocks: Daily, Weekly, Year-to-Date, Market Cap & Trends. Filter Tech stocks list by size:All Tech Large Mid-Range Small and MicroCap |
| 12Stocks.com Tech Stocks Performances & Trends Daily | |||||||||
|
|  The overall Smart Investing & Trading Score is 64 (0-bearish to 100-bullish) which puts Technology sector in short term neutral to bullish trend. The Smart Investing & Trading Score from previous trading session is 49 and hence an improvement of trend.
| ||||||||
Here are the Smart Investing & Trading Scores of the most requested Technology stocks at 12Stocks.com (click stock name for detailed review):
|


| 12Stocks.com: Investing in Technology sector with Stocks | |
|
The following table helps investors and traders sort through current performance and trends (as measured by Smart Investing & Trading Score) of various
stocks in the Tech sector. Quick View: Move mouse or cursor over stock symbol (ticker) to view short-term technical chart and over stock name to view long term chart. Click on  to add stock symbol to your watchlist and to add stock symbol to your watchlist and  to view watchlist. Click on any ticker or stock name for detailed market intelligence report for that stock. to view watchlist. Click on any ticker or stock name for detailed market intelligence report for that stock. |
12Stocks.com Performance of Stocks in Tech Sector
| Ticker | Stock Name | Watchlist | Category | Recent Price | Smart Investing & Trading Score | Change % | Weekly Change% |
| POWI | Power Integrations |   | Semiconductor | 70.31 | 74 | 2.49% | 2.49% |
| QLYS | Qualys | | Software | 169.47 | 40 | 2.48% | 2.48% |
| SANM | Sanmina | | Electronics | 63.26 | 54 | 2.43% | 2.43% |
| RDFN | Redfin | | Internet | 6.35 | 69 | 2.42% | 2.42% |
| LBTYK | Liberty Global | | CATV | 17.68 | 67 | 2.37% | 2.37% |
| PEGA | Pegasystems | | Software | 60.93 | 27 | 2.32% | 2.32% |
| ONTO | Onto Innovation | | Semiconductor | 205.46 | 95 | 2.32% | 2.32% |
| YEXT | Yext | | Internet | 5.57 | 7 | 2.30% | 2.30% |
| LOGI | Logitech | | Computer | 83.94 | 64 | 2.25% | 2.25% |
| FSLY | Fastly | | Software | 8.67 | 7 | 2.24% | 2.24% |
| AMPL | Amplitude | | Software - | 10.08 | 42 | 2.23% | 2.23% |
| TEO | Telecom Argentina | | Communication | 8.77 | 100 | 2.21% | 2.21% |
| EXLS | ExlService | | IT | 30.29 | 49 | 2.16% | 2.16% |
| MPWR | Monolithic Power | | Semiconductor | 722.40 | 69 | 2.15% | 2.15% |
| RPD | Rapid7 | | Software | 46.17 | 42 | 2.12% | 2.12% |
| TTEC | TTEC | | IT | 7.82 | 52 | 2.09% | 2.09% |
| RMBS | Rambus | | Semiconductor- | 57.25 | 32 | 2.09% | 2.09% |
| ALTR | Altair Engineering | | Semiconductor | 83.17 | 57 | 2.09% | 2.09% |
| NOVT | Novanta | | Instruments | 163.23 | 39 | 2.09% | 2.09% |
| AYI | Acuity Brands | | Electronics | 259.63 | 70 | 2.05% | 2.05% |
| NTNX | Nutanix | | Software | 63.47 | 39 | 1.98% | 1.98% |
| LPSN | LivePerson | | Software | 0.59 | 54 | 1.96% | 1.96% |
| FSLR | First Solar | | Semiconductor | 195.31 | 100 | 1.96% | 1.96% |
| CYBR | CyberArk Software | | Software | 231.75 | 0 | 1.95% | 1.95% |
| KLIC | Kulicke and | | Semiconductor | 47.91 | 49 | 1.94% | 1.94% |
| For chart view version of above stock list: Chart View ➞ 0 - 25 , 25 - 50 , 50 - 75 , 75 - 100 , 100 - 125 , 125 - 150 , 150 - 175 , 175 - 200 , 200 - 225 | ||
 | Click To Change The Sort Order: By Market Cap or Company Size Performance: Year-to-date, Week and Day |  |
|
Get the most comprehensive stock market coverage daily at 12Stocks.com ➞ Best Stocks Today ➞ Best Stocks Weekly ➞ Best Stocks Year-to-Date ➞ Best Stocks Trends ➞  Best Stocks Today 12Stocks.com Best Nasdaq Stocks ➞ Best S&P 500 Stocks ➞ Best Tech Stocks ➞ Best Biotech Stocks ➞ |
| Detailed Overview of Tech Stocks |
| Tech Technical Overview, Leaders & Laggards, Top Tech ETF Funds & Detailed Tech Stocks List, Charts, Trends & More |
| Tech Sector: Technical Analysis, Trends & YTD Performance | |
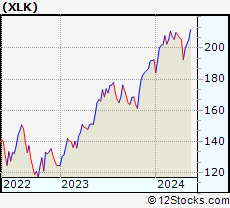
| Technology sector is composed of stocks
from semiconductors, software, web, social media
and services subsectors. Technology sector, as represented by XLK, an exchange-traded fund [ETF] that holds basket of tech stocks (e.g, Intel, Google) is up by 5.91% and is currently underperforming the overall market by -1.62% year-to-date. Below is a quick view of technical charts and trends: |
|
 XLK Weekly Chart |
|
| Long Term Trend: Not Good | |
| Medium Term Trend: Very Good | |
 XLK Daily Chart |
|
| Short Term Trend: Very Good | |
| Overall Trend Score: 64 | |
| YTD Performance: 5.91% | |
| **Trend Scores & Views Are Only For Educational Purposes And Not For Investing | |
| 12Stocks.com: Top Performing Technology Sector Stocks | ||||||||||||||||||||||||||||||||||||||||||||||||
 The top performing Technology sector stocks year to date are
Now, more recently, over last week, the top performing Technology sector stocks on the move are


|
||||||||||||||||||||||||||||||||||||||||||||||||
| 12Stocks.com: Investing in Tech Sector using Exchange Traded Funds | |
|
The following table shows list of key exchange traded funds (ETF) that
help investors track Tech Index. For detailed view, check out our ETF Funds section of our website. Quick View: Move mouse or cursor over ETF symbol (ticker) to view short-term technical chart and over ETF name to view long term chart. Click on ticker or stock name for detailed view. Click on to add stock symbol to your watchlist and to view watchlist. |
12Stocks.com List of ETFs that track Tech Index
| Ticker | ETF Name | Watchlist | Recent Price | Smart Investing & Trading Score | Change % | Week % | Year-to-date % |
| XLK | Technology | | 203.85 | 64 | 0.64 | 0.64 | 5.91% |
| IYW | Technology | | 133.38 | 62 | 0.92 | 0.92 | 8.66% |
| IXN | Global Tech | | 73.30 | 62 | 0.61 | 0.61 | 7.52% |
| XSD | Semiconductor | | 229.45 | 88 | 1.48 | 1.48 | 2.07% |
| TQQQ | QQQ | | 57.65 | 64 | 1.68 | 1.68 | 13.71% |
| SQQQ | Short QQQ | | 10.90 | 0 | -1.67 | -1.67 | -19% |
| SOXL | Semicondct Bull 3X | | 40.92 | 64 | 5.02 | 5.02 | 30.33% |
| QTEC | First -100-Tech | | 184.01 | 42 | 0.69 | 0.69 | 4.86% |
| SMH | Semiconductor | | 221.35 | 95 | 1.66 | 1.66 | 26.58% |
| 12Stocks.com: Charts, Trends, Fundamental Data and Performances of Tech Stocks | |
|
We now take in-depth look at all Tech stocks including charts, multi-period performances and overall trends (as measured by Smart Investing & Trading Score). One can sort Tech stocks (click link to choose) by Daily, Weekly and by Year-to-Date performances. Also, one can sort by size of the company or by market capitalization. |
| Select Your Default Chart Type: | |||||
| |||||
| Click on stock symbol or name for detailed view. Click on to add stock symbol to your watchlist and to view watchlist. Quick View: Move mouse or cursor over "Daily" to quickly view daily technical stock chart and over "Weekly" to view weekly technical stock chart. | |||||


 | POWI Power Integrations, Inc. |
| Sector: Technology | |
| SubSector: Semiconductor - Integrated Circuits | |
| MarketCap: 2612.1 Millions | |
| Recent Price: 70.31 Smart Investing & Trading Score: 74 | |
| Day Percent Change: 2.49% Day Change: 1.71 | |
| Week Change: 2.49% Year-to-date Change: -14.4% | |
| POWI Links: Profile News Message Board | |
| Charts:- Daily , Weekly | |
| Add POWI to Watchlist: View: Get Complete POWI Trend Analysis ➞ | |
 | QLYS Qualys, Inc. |
| Sector: Technology | |
| SubSector: Application Software | |
| MarketCap: 3475.02 Millions | |
| Recent Price: 169.47 Smart Investing & Trading Score: 40 | |
| Day Percent Change: 2.48% Day Change: 4.10 | |
| Week Change: 2.48% Year-to-date Change: -13.7% | |
| QLYS Links: Profile News Message Board | |
| Charts:- Daily , Weekly | |
| Add QLYS to Watchlist: View: Get Complete QLYS Trend Analysis ➞ | |
 | SANM Sanmina Corporation |
| Sector: Technology | |
| SubSector: Diversified Electronics | |
| MarketCap: 1790.36 Millions | |
| Recent Price: 63.26 Smart Investing & Trading Score: 54 | |
| Day Percent Change: 2.43% Day Change: 1.50 | |
| Week Change: 2.43% Year-to-date Change: 23.2% | |
| SANM Links: Profile News Message Board | |
| Charts:- Daily , Weekly | |
| Add SANM to Watchlist: View: Get Complete SANM Trend Analysis ➞ | |
 | RDFN Redfin Corporation |
| Sector: Technology | |
| SubSector: Internet Information Providers | |
| MarketCap: 1356.2 Millions | |
| Recent Price: 6.35 Smart Investing & Trading Score: 69 | |
| Day Percent Change: 2.42% Day Change: 0.15 | |
| Week Change: 2.42% Year-to-date Change: -38.5% | |
| RDFN Links: Profile News Message Board | |
| Charts:- Daily , Weekly | |
| Add RDFN to Watchlist: View: Get Complete RDFN Trend Analysis ➞ | |
 | LBTYK Liberty Global plc |
| Sector: Technology | |
| SubSector: CATV Systems | |
| MarketCap: 7253.02 Millions | |
| Recent Price: 17.68 Smart Investing & Trading Score: 67 | |
| Day Percent Change: 2.37% Day Change: 0.41 | |
| Week Change: 2.37% Year-to-date Change: -5.2% | |
| LBTYK Links: Profile News Message Board | |
| Charts:- Daily , Weekly | |
| Add LBTYK to Watchlist: View: Get Complete LBTYK Trend Analysis ➞ | |
 | PEGA Pegasystems Inc. |
| Sector: Technology | |
| SubSector: Business Software & Services | |
| MarketCap: 5924.88 Millions | |
| Recent Price: 60.93 Smart Investing & Trading Score: 27 | |
| Day Percent Change: 2.32% Day Change: 1.38 | |
| Week Change: 2.32% Year-to-date Change: 24.7% | |
| PEGA Links: Profile News Message Board | |
| Charts:- Daily , Weekly | |
| Add PEGA to Watchlist: View: Get Complete PEGA Trend Analysis ➞ | |
 | ONTO Onto Innovation Inc. |
| Sector: Technology | |
| SubSector: Semiconductor Equipment & Materials | |
| MarketCap: 1187.18 Millions | |
| Recent Price: 205.46 Smart Investing & Trading Score: 95 | |
| Day Percent Change: 2.32% Day Change: 4.66 | |
| Week Change: 2.32% Year-to-date Change: 34.4% | |
| ONTO Links: Profile News Message Board | |
| Charts:- Daily , Weekly | |
| Add ONTO to Watchlist: View: Get Complete ONTO Trend Analysis ➞ | |
 | YEXT Yext, Inc. |
| Sector: Technology | |
| SubSector: Internet Software & Services | |
| MarketCap: 1414.91 Millions | |
| Recent Price: 5.57 Smart Investing & Trading Score: 7 | |
| Day Percent Change: 2.30% Day Change: 0.13 | |
| Week Change: 2.3% Year-to-date Change: -5.5% | |
| YEXT Links: Profile News Message Board | |
| Charts:- Daily , Weekly | |
| Add YEXT to Watchlist: View: Get Complete YEXT Trend Analysis ➞ | |
 | LOGI Logitech International S.A. |
| Sector: Technology | |
| SubSector: Computer Peripherals | |
| MarketCap: 7998.19 Millions | |
| Recent Price: 83.94 Smart Investing & Trading Score: 64 | |
| Day Percent Change: 2.25% Day Change: 1.84 | |
| Week Change: 2.25% Year-to-date Change: -11.7% | |
| LOGI Links: Profile News Message Board | |
| Charts:- Daily , Weekly | |
| Add LOGI to Watchlist: View: Get Complete LOGI Trend Analysis ➞ | |
 | FSLY Fastly, Inc. |
| Sector: Technology | |
| SubSector: Application Software | |
| MarketCap: 1973.72 Millions | |
| Recent Price: 8.67 Smart Investing & Trading Score: 7 | |
| Day Percent Change: 2.24% Day Change: 0.19 | |
| Week Change: 2.24% Year-to-date Change: -51.3% | |
| FSLY Links: Profile News Message Board | |
| Charts:- Daily , Weekly | |
| Add FSLY to Watchlist: View: Get Complete FSLY Trend Analysis ➞ | |
 | AMPL Amplitude, Inc. |
| Sector: Technology | |
| SubSector: Software - Application | |
| MarketCap: 1320 Millions | |
| Recent Price: 10.08 Smart Investing & Trading Score: 42 | |
| Day Percent Change: 2.23% Day Change: 0.22 | |
| Week Change: 2.23% Year-to-date Change: -21.0% | |
| AMPL Links: Profile News Message Board | |
| Charts:- Daily , Weekly | |
| Add AMPL to Watchlist: View: Get Complete AMPL Trend Analysis ➞ | |
 | TEO Telecom Argentina S.A. |
| Sector: Technology | |
| SubSector: Diversified Communication Services | |
| MarketCap: 1508.64 Millions | |
| Recent Price: 8.77 Smart Investing & Trading Score: 100 | |
| Day Percent Change: 2.21% Day Change: 0.19 | |
| Week Change: 2.21% Year-to-date Change: 22.7% | |
| TEO Links: Profile News Message Board | |
| Charts:- Daily , Weekly | |
| Add TEO to Watchlist: View: Get Complete TEO Trend Analysis ➞ | |
 | EXLS ExlService Holdings, Inc. |
| Sector: Technology | |
| SubSector: Information Technology Services | |
| MarketCap: 1781.78 Millions | |
| Recent Price: 30.29 Smart Investing & Trading Score: 49 | |
| Day Percent Change: 2.16% Day Change: 0.64 | |
| Week Change: 2.16% Year-to-date Change: -1.8% | |
| EXLS Links: Profile News Message Board | |
| Charts:- Daily , Weekly | |
| Add EXLS to Watchlist: View: Get Complete EXLS Trend Analysis ➞ | |
 | MPWR Monolithic Power Systems, Inc. |
| Sector: Technology | |
| SubSector: Semiconductor - Specialized | |
| MarketCap: 6436.4 Millions | |
| Recent Price: 722.40 Smart Investing & Trading Score: 69 | |
| Day Percent Change: 2.15% Day Change: 15.18 | |
| Week Change: 2.15% Year-to-date Change: 14.5% | |
| MPWR Links: Profile News Message Board | |
| Charts:- Daily , Weekly | |
| Add MPWR to Watchlist: View: Get Complete MPWR Trend Analysis ➞ | |
 | RPD Rapid7, Inc. |
| Sector: Technology | |
| SubSector: Application Software | |
| MarketCap: 1981.12 Millions | |
| Recent Price: 46.17 Smart Investing & Trading Score: 42 | |
| Day Percent Change: 2.12% Day Change: 0.96 | |
| Week Change: 2.12% Year-to-date Change: -19.1% | |
| RPD Links: Profile News Message Board | |
| Charts:- Daily , Weekly | |
| Add RPD to Watchlist: View: Get Complete RPD Trend Analysis ➞ | |
 | TTEC TTEC Holdings, Inc. |
| Sector: Technology | |
| SubSector: Information Technology Services | |
| MarketCap: 1528.48 Millions | |
| Recent Price: 7.82 Smart Investing & Trading Score: 52 | |
| Day Percent Change: 2.09% Day Change: 0.16 | |
| Week Change: 2.09% Year-to-date Change: -63.9% | |
| TTEC Links: Profile News Message Board | |
| Charts:- Daily , Weekly | |
| Add TTEC to Watchlist: View: Get Complete TTEC Trend Analysis ➞ | |
 | RMBS Rambus Inc. |
| Sector: Technology | |
| SubSector: Semiconductor- Memory Chips | |
| MarketCap: 1296 Millions | |
| Recent Price: 57.25 Smart Investing & Trading Score: 32 | |
| Day Percent Change: 2.09% Day Change: 1.17 | |
| Week Change: 2.09% Year-to-date Change: -16.1% | |
| RMBS Links: Profile News Message Board | |
| Charts:- Daily , Weekly | |
| Add RMBS to Watchlist: View: Get Complete RMBS Trend Analysis ➞ | |
 | ALTR Altair Engineering Inc. |
| Sector: Technology | |
| SubSector: Semiconductor - Specialized | |
| MarketCap: 2072.2 Millions | |
| Recent Price: 83.17 Smart Investing & Trading Score: 57 | |
| Day Percent Change: 2.09% Day Change: 1.70 | |
| Week Change: 2.09% Year-to-date Change: -1.2% | |
| ALTR Links: Profile News Message Board | |
| Charts:- Daily , Weekly | |
| Add ALTR to Watchlist: View: Get Complete ALTR Trend Analysis ➞ | |
 | NOVT Novanta Inc. |
| Sector: Technology | |
| SubSector: Scientific & Technical Instruments | |
| MarketCap: 2680.83 Millions | |
| Recent Price: 163.23 Smart Investing & Trading Score: 39 | |
| Day Percent Change: 2.09% Day Change: 3.34 | |
| Week Change: 2.09% Year-to-date Change: -3.1% | |
| NOVT Links: Profile News Message Board | |
| Charts:- Daily , Weekly | |
| Add NOVT to Watchlist: View: Get Complete NOVT Trend Analysis ➞ | |
 | AYI Acuity Brands, Inc. |
| Sector: Technology | |
| SubSector: Diversified Electronics | |
| MarketCap: 3356.66 Millions | |
| Recent Price: 259.63 Smart Investing & Trading Score: 70 | |
| Day Percent Change: 2.05% Day Change: 5.22 | |
| Week Change: 2.05% Year-to-date Change: 26.8% | |
| AYI Links: Profile News Message Board | |
| Charts:- Daily , Weekly | |
| Add AYI to Watchlist: View: Get Complete AYI Trend Analysis ➞ | |
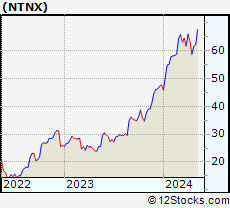 | NTNX Nutanix, Inc. |
| Sector: Technology | |
| SubSector: Technical & System Software | |
| MarketCap: 3376.6 Millions | |
| Recent Price: 63.47 Smart Investing & Trading Score: 39 | |
| Day Percent Change: 1.98% Day Change: 1.23 | |
| Week Change: 1.98% Year-to-date Change: 33.1% | |
| NTNX Links: Profile News Message Board | |
| Charts:- Daily , Weekly | |
| Add NTNX to Watchlist: View: Get Complete NTNX Trend Analysis ➞ | |
 | LPSN LivePerson, Inc. |
| Sector: Technology | |
| SubSector: Business Software & Services | |
| MarketCap: 1070.58 Millions | |
| Recent Price: 0.59 Smart Investing & Trading Score: 54 | |
| Day Percent Change: 1.96% Day Change: 0.01 | |
| Week Change: 1.96% Year-to-date Change: -84.5% | |
| LPSN Links: Profile News Message Board | |
| Charts:- Daily , Weekly | |
| Add LPSN to Watchlist: View: Get Complete LPSN Trend Analysis ➞ | |
 | FSLR First Solar, Inc. |
| Sector: Technology | |
| SubSector: Semiconductor - Specialized | |
| MarketCap: 3617.9 Millions | |
| Recent Price: 195.31 Smart Investing & Trading Score: 100 | |
| Day Percent Change: 1.96% Day Change: 3.76 | |
| Week Change: 1.96% Year-to-date Change: 13.4% | |
| FSLR Links: Profile News Message Board | |
| Charts:- Daily , Weekly | |
| Add FSLR to Watchlist: View: Get Complete FSLR Trend Analysis ➞ | |
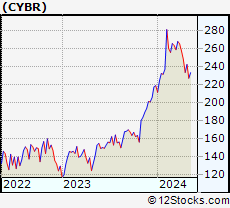 | CYBR CyberArk Software Ltd. |
| Sector: Technology | |
| SubSector: Business Software & Services | |
| MarketCap: 3223.58 Millions | |
| Recent Price: 231.75 Smart Investing & Trading Score: 0 | |
| Day Percent Change: 1.95% Day Change: 4.43 | |
| Week Change: 1.95% Year-to-date Change: 5.8% | |
| CYBR Links: Profile News Message Board | |
| Charts:- Daily , Weekly | |
| Add CYBR to Watchlist: View: Get Complete CYBR Trend Analysis ➞ | |
 | KLIC Kulicke and Soffa Industries, Inc. |
| Sector: Technology | |
| SubSector: Semiconductor Equipment & Materials | |
| MarketCap: 1336.68 Millions | |
| Recent Price: 47.91 Smart Investing & Trading Score: 49 | |
| Day Percent Change: 1.94% Day Change: 0.91 | |
| Week Change: 1.94% Year-to-date Change: -12.5% | |
| KLIC Links: Profile News Message Board | |
| Charts:- Daily , Weekly | |
| Add KLIC to Watchlist: View: Get Complete KLIC Trend Analysis ➞ | |
| For tabular summary view of above stock list: Summary View ➞ 0 - 25 , 25 - 50 , 50 - 75 , 75 - 100 , 100 - 125 , 125 - 150 , 150 - 175 , 175 - 200 , 200 - 225 | ||
| Click To Change The Sort Order: By Market Cap or Company Size Performance: Year-to-date, Week and Day | |
| Select Chart Type: | ||
|
Best Stocks Today 12Stocks.com |
© 2024 12Stocks.com Terms & Conditions Privacy Contact Us
All Information Provided Only For Education And Not To Be Used For Investing or Trading. See Terms & Conditions


One More Thing ... Get Best Stocks Delivered Daily!
Never Ever Miss A Move With Our Top Ten Stocks Lists
Find Best Stocks In Any Market - Bull or Bear Market
Take A Peek At Our Top Ten Stocks Lists: Daily, Weekly, Year-to-Date & Top Trends
Find Best Stocks In Any Market - Bull or Bear Market
Take A Peek At Our Top Ten Stocks Lists: Daily, Weekly, Year-to-Date & Top Trends
Technology Stocks With Best Up Trends [0-bearish to 100-bullish]: Silicon Motion[100], Warner Music[100], Arlo [100], WideOpenWest [100], Sensata [100], Zebra [100], Benchmark Electronics[100], Phoenix New[100], Cardlytics [100], Telecom Argentina[100], Microchip [100]
Best Technology Stocks Year-to-Date:
MicroCloud Hologram[530.22%], MediaCo Holding[400%], Bakkt [191.03%], Uxin [188.16%], Super Micro[185.73%], CXApp [160.23%], SoundHound AI[129.44%], GigaCloud [114.99%], MicroStrategy [109.31%], CuriosityStream [107.37%], NextNav [104.72%] Best Technology Stocks This Week:
Perficient [52.71%], Arteris [18.16%], Upland Software[16.6%], SoundHound AI[12.87%], SYLA [10.03%], Telephone and[9.54%], GigaCloud [9.07%], Tigo Energy[8.74%], MicroStrategy [8.1%], Silicon Motion[7.34%], AXT [6.97%] Best Technology Stocks Daily:
Perficient [52.71%], Arteris [18.16%], Upland Software[16.60%], SoundHound AI[12.87%], SYLA [10.03%], Telephone and[9.54%], GigaCloud [9.07%], Tigo Energy[8.74%], MicroStrategy [8.10%], Silicon Motion[7.34%], AXT [6.97%]