
 Login Sign Up


| |||||
 |  | ||||

| 12Stocks.com Market Intelligence |
Best Tech Stocks
| In a hurry? Tech Stocks Lists: Performance & Trends, Stock Charts, FANG Stocks
Sort Tech stocks: Daily, Weekly, Year-to-Date, Market Cap & Trends. Filter Tech stocks list by size:All Tech Large Mid-Range Small and MicroCap |
| 12Stocks.com Tech Stocks Performances & Trends Daily | |||||||||
|
|  The overall Smart Investing & Trading Score is 100 (0-bearish to 100-bullish) which puts Technology sector in short term bullish trend. The Smart Investing & Trading Score from previous trading session is 90 and an improvement of trend continues.
| ||||||||
Here are the Smart Investing & Trading Scores of the most requested Technology stocks at 12Stocks.com (click stock name for detailed review):
|


| 12Stocks.com: Investing in Technology sector with Stocks | |
|
The following table helps investors and traders sort through current performance and trends (as measured by Smart Investing & Trading Score) of various
stocks in the Tech sector. Quick View: Move mouse or cursor over stock symbol (ticker) to view short-term technical chart and over stock name to view long term chart. Click on  to add stock symbol to your watchlist and to add stock symbol to your watchlist and  to view watchlist. Click on any ticker or stock name for detailed market intelligence report for that stock. to view watchlist. Click on any ticker or stock name for detailed market intelligence report for that stock. |
12Stocks.com Performance of Stocks in Tech Sector
| Ticker | Stock Name | Watchlist | Category | Recent Price | Smart Investing & Trading Score | Change % | YTD Change% |
| TI | Telecom Italia |   | Communication | 153.68 | 0 | -0.56% | 0.00% |
| ADP | Automatic Data | | Software - | 289.83 | 0 | -0.61% | 1.10% |
| QNST | QuinStreet | | Advertising Agencies | 15.36 | 0 | -0.65% | -34.25% |
| CDK | CDK Global | | Software | 23.01 | 0 | -0.65% | 0.00% |
| DIS | Walt Disney | | Entertainment | 112.14 | 0 | -0.72% | 1.62% |
| INTA | Intapp | | Software - | 39.74 | 0 | -0.80% | -38.51% |
| BDC | Belden | | Communication | 117.47 | 0 | -0.80% | 3.87% |
| NRDY | Nerdy | | Software - | 1.23 | 0 | -0.81% | -21.66% |
| AGYS | Agilysys | | Software - | 100.36 | 0 | -0.92% | -22.57% |
| NCNO | Ncino | | Software - | 25.88 | 0 | -1.03% | -22.54% |
| G | Genpact | | IT | 41.40 | 0 | -1.05% | -2.99% |
| WUBA | 58.com | | Internet | 78.83 | 0 | -1.08% | 0.00% |
| PTNR | Partner | | Wireless | 1.63 | 0 | -1.21% | 0.00% |
| DOCU | DocuSign | | Software - | 68.09 | 0 | -1.28% | -24.64% |
| UIS | Unisys Corp | | IT | 3.84 | 0 | -1.29% | -40.65% |
| TMUS | T-Mobile US | | Telecom | 230.14 | 0 | -1.34% | 5.57% |
| INFY | Infosys | | IT | 16.15 | 0 | -1.34% | -27.59% |
| APPF | Appfolio | | Software - | 252.90 | 0 | -1.42% | 1.93% |
| IDT | IDT Corp | | Telecom | 49.90 | 0 | -1.48% | 6.24% |
| TU | Telus Corp | | Telecom | 15.58 | 0 | -1.58% | 18.53% |
| CMCSA | Comcast Corp | | Telecom | 30.40 | 0 | -1.75% | -16.58% |
| TV | Grupo Televisa | | Telecom | 2.54 | 0 | -1.93% | 52.09% |
| T | AT&T | | Telecom | 27.01 | 0 | -1.96% | 22.33% |
| SSP | E.W. Scripps | | Broadcasting | 2.50 | 0 | -1.96% | -0.79% |
| EVTC | Evertec | | Software - Infrastructure | 32.96 | 0 | -1.96% | -4.04% |
| For chart view version of above stock list: Chart View ➞ 0 - 25 , 25 - 50 , 50 - 75 , 75 - 100 , 100 - 125 , 125 - 150 , 150 - 175 , 175 - 200 , 200 - 225 , 225 - 250 , 250 - 275 , 275 - 300 , 300 - 325 , 325 - 350 , 350 - 375 , 375 - 400 , 400 - 425 , 425 - 450 , 450 - 475 , 475 - 500 , 500 - 525 , 525 - 550 , 550 - 575 , 575 - 600 , 600 - 625 , 625 - 650 , 650 - 675 , 675 - 700 , 700 - 725 , 725 - 750 , 750 - 775 , 775 - 800 , 800 - 825 , 825 - 850 , 850 - 875 , 875 - 900 | ||
 | Click To Change The Sort Order: By Market Cap or Company Size Performance: Year-to-date, Week and Day |  |
|
Get the most comprehensive stock market coverage daily at 12Stocks.com ➞ Best Stocks Today ➞ Best Stocks Weekly ➞ Best Stocks Year-to-Date ➞ Best Stocks Trends ➞  Best Stocks Today 12Stocks.com Best Nasdaq Stocks ➞ Best S&P 500 Stocks ➞ Best Tech Stocks ➞ Best Biotech Stocks ➞ |
| Detailed Overview of Tech Stocks |
| Tech Technical Overview, Leaders & Laggards, Top Tech ETF Funds & Detailed Tech Stocks List, Charts, Trends & More |
| Tech Sector: Technical Analysis, Trends & YTD Performance | |
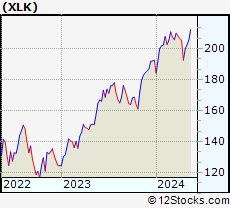
| Technology sector is composed of stocks
from semiconductors, software, web, social media
and services subsectors. Technology sector, as represented by XLK, an exchange-traded fund [ETF] that holds basket of tech stocks (e.g, Intel, Google) is up by 23.7823% and is currently outperforming the overall market by 9.0244% year-to-date. Below is a quick view of technical charts and trends: |
|
 XLK Weekly Chart |
|
| Long Term Trend: Very Good | |
| Medium Term Trend: Good | |
 XLK Daily Chart |
|
| Short Term Trend: Very Good | |
| Overall Trend Score: 100 | |
| YTD Performance: 23.7823% | |
| **Trend Scores & Views Are Only For Educational Purposes And Not For Investing | |
| 12Stocks.com: Top Performing Technology Sector Stocks | ||||||||||||||||||||||||||||||||||||||||||||||||
 The top performing Technology sector stocks year to date are
Now, more recently, over last week, the top performing Technology sector stocks on the move are


|
||||||||||||||||||||||||||||||||||||||||||||||||
| 12Stocks.com: Investing in Tech Sector using Exchange Traded Funds | |
|
The following table shows list of key exchange traded funds (ETF) that
help investors track Tech Index. For detailed view, check out our ETF Funds section of our website. Quick View: Move mouse or cursor over ETF symbol (ticker) to view short-term technical chart and over ETF name to view long term chart. Click on ticker or stock name for detailed view. Click on to add stock symbol to your watchlist and to view watchlist. |
12Stocks.com List of ETFs that track Tech Index
| Ticker | ETF Name | Watchlist | Recent Price | Smart Investing & Trading Score | Change % | Week % | Year-to-date % |
| IGN | Tech-Multimd Ntwk | | 53.86 | 40 | 0.918119 | -20.6435 | 0% |
| 12Stocks.com: Charts, Trends, Fundamental Data and Performances of Tech Stocks | |
|
We now take in-depth look at all Tech stocks including charts, multi-period performances and overall trends (as measured by Smart Investing & Trading Score). One can sort Tech stocks (click link to choose) by Daily, Weekly and by Year-to-Date performances. Also, one can sort by size of the company or by market capitalization. |
| Select Your Default Chart Type: | |||||
| |||||
| Click on stock symbol or name for detailed view. Click on to add stock symbol to your watchlist and to view watchlist. Quick View: Move mouse or cursor over "Daily" to quickly view daily technical stock chart and over "Weekly" to view weekly technical stock chart. | |||||


 | TI Telecom Italia S.p.A. |
| Sector: Technology | |
| SubSector: Diversified Communication Services | |
| MarketCap: 16855.6 Millions | |
| Recent Price: 153.68 Smart Investing & Trading Score: 0 | |
| Day Percent Change: -0.55649% Day Change: -9999 | |
| Week Change: -24.9059% Year-to-date Change: 0.0% | |
| TI Links: Profile News Message Board | |
| Charts:- Daily , Weekly | |
| Add TI to Watchlist: View: Get Complete TI Trend Analysis ➞ | |
 | ADP Automatic Data Processing Inc |
| Sector: Technology | |
| SubSector: Software - Application | |
| MarketCap: 119881 Millions | |
| Recent Price: 289.83 Smart Investing & Trading Score: 0 | |
| Day Percent Change: -0.610404% Day Change: -2.73 | |
| Week Change: -0.572899% Year-to-date Change: 1.1% | |
| ADP Links: Profile News Message Board | |
| Charts:- Daily , Weekly | |
| Add ADP to Watchlist: View: Get Complete ADP Trend Analysis ➞ | |
 | QNST QuinStreet Inc |
| Sector: Technology | |
| SubSector: Advertising Agencies | |
| MarketCap: 919.93 Millions | |
| Recent Price: 15.36 Smart Investing & Trading Score: 0 | |
| Day Percent Change: -0.646831% Day Change: -0.06 | |
| Week Change: -5.82465% Year-to-date Change: -34.2% | |
| QNST Links: Profile News Message Board | |
| Charts:- Daily , Weekly | |
| Add QNST to Watchlist: View: Get Complete QNST Trend Analysis ➞ | |
 | CDK CDK Global, Inc. |
| Sector: Technology | |
| SubSector: Application Software | |
| MarketCap: 3953.32 Millions | |
| Recent Price: 23.01 Smart Investing & Trading Score: 0 | |
| Day Percent Change: -0.647668% Day Change: -9999 | |
| Week Change: -57.9803% Year-to-date Change: 0.0% | |
| CDK Links: Profile News Message Board | |
| Charts:- Daily , Weekly | |
| Add CDK to Watchlist: View: Get Complete CDK Trend Analysis ➞ | |
 | DIS Walt Disney Co |
| Sector: Technology | |
| SubSector: Entertainment | |
| MarketCap: 211994 Millions | |
| Recent Price: 112.14 Smart Investing & Trading Score: 0 | |
| Day Percent Change: -0.717131% Day Change: -0.38 | |
| Week Change: -1.13727% Year-to-date Change: 1.6% | |
| DIS Links: Profile News Message Board | |
| Charts:- Daily , Weekly | |
| Add DIS to Watchlist: View: Get Complete DIS Trend Analysis ➞ | |
 | INTA Intapp Inc |
| Sector: Technology | |
| SubSector: Software - Application | |
| MarketCap: 3670.77 Millions | |
| Recent Price: 39.74 Smart Investing & Trading Score: 0 | |
| Day Percent Change: -0.798802% Day Change: 0.08 | |
| Week Change: -6.86665% Year-to-date Change: -38.5% | |
| INTA Links: Profile News Message Board | |
| Charts:- Daily , Weekly | |
| Add INTA to Watchlist: View: Get Complete INTA Trend Analysis ➞ | |
 | BDC Belden Inc |
| Sector: Technology | |
| SubSector: Communication Equipment | |
| MarketCap: 5143.84 Millions | |
| Recent Price: 117.47 Smart Investing & Trading Score: 0 | |
| Day Percent Change: -0.802229% Day Change: 0.8 | |
| Week Change: -8.56231% Year-to-date Change: 3.9% | |
| BDC Links: Profile News Message Board | |
| Charts:- Daily , Weekly | |
| Add BDC to Watchlist: View: Get Complete BDC Trend Analysis ➞ | |
 | NRDY Nerdy Inc |
| Sector: Technology | |
| SubSector: Software - Application | |
| MarketCap: 248.97 Millions | |
| Recent Price: 1.23 Smart Investing & Trading Score: 0 | |
| Day Percent Change: -0.806452% Day Change: -0.01 | |
| Week Change: -8.88889% Year-to-date Change: -21.7% | |
| NRDY Links: Profile News Message Board | |
| Charts:- Daily , Weekly | |
| Add NRDY to Watchlist: View: Get Complete NRDY Trend Analysis ➞ | |
 | AGYS Agilysys, Inc |
| Sector: Technology | |
| SubSector: Software - Application | |
| MarketCap: 3100.41 Millions | |
| Recent Price: 100.36 Smart Investing & Trading Score: 0 | |
| Day Percent Change: -0.918156% Day Change: 0.44 | |
| Week Change: -3.72218% Year-to-date Change: -22.6% | |
| AGYS Links: Profile News Message Board | |
| Charts:- Daily , Weekly | |
| Add AGYS to Watchlist: View: Get Complete AGYS Trend Analysis ➞ | |
 | NCNO Ncino Inc |
| Sector: Technology | |
| SubSector: Software - Application | |
| MarketCap: 3520.77 Millions | |
| Recent Price: 25.88 Smart Investing & Trading Score: 0 | |
| Day Percent Change: -1.0325% Day Change: 0.02 | |
| Week Change: -9.44717% Year-to-date Change: -22.5% | |
| NCNO Links: Profile News Message Board | |
| Charts:- Daily , Weekly | |
| Add NCNO to Watchlist: View: Get Complete NCNO Trend Analysis ➞ | |
 | G Genpact Ltd |
| Sector: Technology | |
| SubSector: Information Technology Services | |
| MarketCap: 7821.24 Millions | |
| Recent Price: 41.40 Smart Investing & Trading Score: 0 | |
| Day Percent Change: -1.05163% Day Change: -0.35 | |
| Week Change: -3.02179% Year-to-date Change: -3.0% | |
| G Links: Profile News Message Board | |
| Charts:- Daily , Weekly | |
| Add G to Watchlist: View: Get Complete G Trend Analysis ➞ | |
 | WUBA 58.com Inc. |
| Sector: Technology | |
| SubSector: Internet Information Providers | |
| MarketCap: 7215.3 Millions | |
| Recent Price: 78.83 Smart Investing & Trading Score: 0 | |
| Day Percent Change: -1.07918% Day Change: -9999 | |
| Week Change: -24.0851% Year-to-date Change: 0.0% | |
| WUBA Links: Profile News Message Board | |
| Charts:- Daily , Weekly | |
| Add WUBA to Watchlist: View: Get Complete WUBA Trend Analysis ➞ | |
 | PTNR Partner Communications Company Ltd. |
| Sector: Technology | |
| SubSector: Wireless Communications | |
| MarketCap: 754.027 Millions | |
| Recent Price: 1.63 Smart Investing & Trading Score: 0 | |
| Day Percent Change: -1.21212% Day Change: -9999 | |
| Week Change: -56.7639% Year-to-date Change: 0.0% | |
| PTNR Links: Profile News Message Board | |
| Charts:- Daily , Weekly | |
| Add PTNR to Watchlist: View: Get Complete PTNR Trend Analysis ➞ | |
 | DOCU DocuSign Inc |
| Sector: Technology | |
| SubSector: Software - Application | |
| MarketCap: 16136.7 Millions | |
| Recent Price: 68.09 Smart Investing & Trading Score: 0 | |
| Day Percent Change: -1.27592% Day Change: -0.7 | |
| Week Change: -18.9501% Year-to-date Change: -24.6% | |
| DOCU Links: Profile News Message Board | |
| Charts:- Daily , Weekly | |
| Add DOCU to Watchlist: View: Get Complete DOCU Trend Analysis ➞ | |
 | UIS Unisys Corp |
| Sector: Technology | |
| SubSector: Information Technology Services | |
| MarketCap: 276.62 Millions | |
| Recent Price: 3.84 Smart Investing & Trading Score: 0 | |
| Day Percent Change: -1.28535% Day Change: 0.03 | |
| Week Change: -4.47761% Year-to-date Change: -40.6% | |
| UIS Links: Profile News Message Board | |
| Charts:- Daily , Weekly | |
| Add UIS to Watchlist: View: Get Complete UIS Trend Analysis ➞ | |
 | TMUS T-Mobile US Inc |
| Sector: Technology | |
| SubSector: Telecom Services | |
| MarketCap: 284461 Millions | |
| Recent Price: 230.14 Smart Investing & Trading Score: 0 | |
| Day Percent Change: -1.33756% Day Change: -2.58 | |
| Week Change: -3.46477% Year-to-date Change: 5.6% | |
| TMUS Links: Profile News Message Board | |
| Charts:- Daily , Weekly | |
| Add TMUS to Watchlist: View: Get Complete TMUS Trend Analysis ➞ | |
 | INFY Infosys Ltd ADR |
| Sector: Technology | |
| SubSector: Information Technology Services | |
| MarketCap: 68048.6 Millions | |
| Recent Price: 16.15 Smart Investing & Trading Score: 0 | |
| Day Percent Change: -1.34392% Day Change: -0.23 | |
| Week Change: -5.16735% Year-to-date Change: -27.6% | |
| INFY Links: Profile News Message Board | |
| Charts:- Daily , Weekly | |
| Add INFY to Watchlist: View: Get Complete INFY Trend Analysis ➞ | |
 | APPF Appfolio Inc |
| Sector: Technology | |
| SubSector: Software - Application | |
| MarketCap: 10211.2 Millions | |
| Recent Price: 252.90 Smart Investing & Trading Score: 0 | |
| Day Percent Change: -1.41888% Day Change: -5.54 | |
| Week Change: -9.57523% Year-to-date Change: 1.9% | |
| APPF Links: Profile News Message Board | |
| Charts:- Daily , Weekly | |
| Add APPF to Watchlist: View: Get Complete APPF Trend Analysis ➞ | |
 | IDT IDT Corp |
| Sector: Technology | |
| SubSector: Telecom Services | |
| MarketCap: 1637.42 Millions | |
| Recent Price: 49.90 Smart Investing & Trading Score: 0 | |
| Day Percent Change: -1.48075% Day Change: 0.26 | |
| Week Change: -19.2295% Year-to-date Change: 6.2% | |
| IDT Links: Profile News Message Board | |
| Charts:- Daily , Weekly | |
| Add IDT to Watchlist: View: Get Complete IDT Trend Analysis ➞ | |
 | TU Telus Corp |
| Sector: Technology | |
| SubSector: Telecom Services | |
| MarketCap: 25269.2 Millions | |
| Recent Price: 15.58 Smart Investing & Trading Score: 0 | |
| Day Percent Change: -1.57928% Day Change: -0.24 | |
| Week Change: -1.39241% Year-to-date Change: 18.5% | |
| TU Links: Profile News Message Board | |
| Charts:- Daily , Weekly | |
| Add TU to Watchlist: View: Get Complete TU Trend Analysis ➞ | |
 | CMCSA Comcast Corp |
| Sector: Technology | |
| SubSector: Telecom Services | |
| MarketCap: 125203 Millions | |
| Recent Price: 30.40 Smart Investing & Trading Score: 0 | |
| Day Percent Change: -1.74531% Day Change: -0.22 | |
| Week Change: -3.8279% Year-to-date Change: -16.6% | |
| CMCSA Links: Profile News Message Board | |
| Charts:- Daily , Weekly | |
| Add CMCSA to Watchlist: View: Get Complete CMCSA Trend Analysis ➞ | |
 | TV Grupo Televisa SAB ADR |
| Sector: Technology | |
| SubSector: Telecom Services | |
| MarketCap: 1281.93 Millions | |
| Recent Price: 2.54 Smart Investing & Trading Score: 0 | |
| Day Percent Change: -1.9305% Day Change: -0.01 | |
| Week Change: -5.57621% Year-to-date Change: 52.1% | |
| TV Links: Profile News Message Board | |
| Charts:- Daily , Weekly | |
| Add TV to Watchlist: View: Get Complete TV Trend Analysis ➞ | |
 | T AT&T, Inc |
| Sector: Technology | |
| SubSector: Telecom Services | |
| MarketCap: 211580 Millions | |
| Recent Price: 27.01 Smart Investing & Trading Score: 0 | |
| Day Percent Change: -1.96007% Day Change: -0.55 | |
| Week Change: -4.62571% Year-to-date Change: 22.3% | |
| T Links: Profile News Message Board | |
| Charts:- Daily , Weekly | |
| Add T to Watchlist: View: Get Complete T Trend Analysis ➞ | |
 | SSP E.W. Scripps Co |
| Sector: Technology | |
| SubSector: Broadcasting | |
| MarketCap: 260.58 Millions | |
| Recent Price: 2.50 Smart Investing & Trading Score: 0 | |
| Day Percent Change: -1.96078% Day Change: 0.23 | |
| Week Change: -13.1944% Year-to-date Change: -0.8% | |
| SSP Links: Profile News Message Board | |
| Charts:- Daily , Weekly | |
| Add SSP to Watchlist: View: Get Complete SSP Trend Analysis ➞ | |
 | EVTC Evertec Inc |
| Sector: Technology | |
| SubSector: Software - Infrastructure | |
| MarketCap: 2205.46 Millions | |
| Recent Price: 32.96 Smart Investing & Trading Score: 0 | |
| Day Percent Change: -1.96312% Day Change: -0.36 | |
| Week Change: -2.60047% Year-to-date Change: -4.0% | |
| EVTC Links: Profile News Message Board | |
| Charts:- Daily , Weekly | |
| Add EVTC to Watchlist: View: Get Complete EVTC Trend Analysis ➞ | |
| For tabular summary view of above stock list: Summary View ➞ 0 - 25 , 25 - 50 , 50 - 75 , 75 - 100 , 100 - 125 , 125 - 150 , 150 - 175 , 175 - 200 , 200 - 225 , 225 - 250 , 250 - 275 , 275 - 300 , 300 - 325 , 325 - 350 , 350 - 375 , 375 - 400 , 400 - 425 , 425 - 450 , 450 - 475 , 475 - 500 , 500 - 525 , 525 - 550 , 550 - 575 , 575 - 600 , 600 - 625 , 625 - 650 , 650 - 675 , 675 - 700 , 700 - 725 , 725 - 750 , 750 - 775 , 775 - 800 , 800 - 825 , 825 - 850 , 850 - 875 , 875 - 900 | ||
| Click To Change The Sort Order: By Market Cap or Company Size Performance: Year-to-date, Week and Day | |
| Select Chart Type: | ||
|
Best Stocks Today 12Stocks.com |
© 2025 12Stocks.com Terms & Conditions Privacy Contact Us
All Information Provided Only For Education And Not To Be Used For Investing or Trading. See Terms & Conditions


One More Thing ... Get Best Stocks Delivered Daily!
Never Ever Miss A Move With Our Top Ten Stocks Lists
Find Best Stocks In Any Market - Bull or Bear Market
Take A Peek At Our Top Ten Stocks Lists: Daily, Weekly, Year-to-Date & Top Trends
Find Best Stocks In Any Market - Bull or Bear Market
Take A Peek At Our Top Ten Stocks Lists: Daily, Weekly, Year-to-Date & Top Trends
Technology Stocks With Best Up Trends [0-bearish to 100-bullish]: Sony [100], Bakkt [100], Rigetti Computing[100], Fair Isaac[100], Arqit Quantum[100], D-Wave Quantum[100], Navitas Semiconductor[100], Shoals [100], Vuzix [100], Arteris [100], Lantronix [100]
Best Technology Stocks Year-to-Date:
Xunlei [370.476%], Sify [315.033%], Wolfspeed [307.01%], Digital Turbine[265.057%], EchoStar Corp[247.253%], CuriosityStream [241.605%], Viasat [224.029%], Pagaya [222.638%], Oneconnect Financial[209.053%], D-Wave Quantum[203.954%], CommScope Holding[203.101%] Best Technology Stocks This Week:
GTT [443626%], Barracuda Networks[71050%], Mobile TeleSystems[10483.5%], Nam Tai[5033.33%], Ebix [4200.85%], Fang [4150%], NantHealth [3114.02%], Hemisphere Media[2981.82%], Yandex N.V[2935.27%], Wolfspeed [1961.98%], Castlight Health[1751.96%] Best Technology Stocks Daily:
Sony [194.565%], Bakkt [28.6091%], Rigetti Computing[18.4925%], Fair Isaac[17.979%], Arqit Quantum[17.9369%], Marti [17%], Latch [16.6667%], Oclaro [14.734%], D-Wave Quantum[13.968%], Arbe Robotics[13.0178%], Navitas Semiconductor[12.3288%]