
 Login Sign Up


| |||||
 |  | ||||

| 12Stocks.com Market Intelligence |
Best Tech Stocks
| In a hurry? Tech Stocks Lists: Performance & Trends, Stock Charts, FANG Stocks
Sort Tech stocks: Daily, Weekly, Year-to-Date, Market Cap & Trends. Filter Tech stocks list by size:All Tech Large Mid-Range Small and MicroCap |
| 12Stocks.com Tech Stocks Performances & Trends Daily | |||||||||
|
|  The overall Smart Investing & Trading Score is 100 (0-bearish to 100-bullish) which puts Technology sector in short term bullish trend. The Smart Investing & Trading Score from previous trading session is 90 and an improvement of trend continues.
| ||||||||
Here are the Smart Investing & Trading Scores of the most requested Technology stocks at 12Stocks.com (click stock name for detailed review):
|


| 12Stocks.com: Investing in Technology sector with Stocks | |
|
The following table helps investors and traders sort through current performance and trends (as measured by Smart Investing & Trading Score) of various
stocks in the Tech sector. Quick View: Move mouse or cursor over stock symbol (ticker) to view short-term technical chart and over stock name to view long term chart. Click on  to add stock symbol to your watchlist and to add stock symbol to your watchlist and  to view watchlist. Click on any ticker or stock name for detailed market intelligence report for that stock. to view watchlist. Click on any ticker or stock name for detailed market intelligence report for that stock. |
12Stocks.com Performance of Stocks in Tech Sector
| Ticker | Stock Name | Watchlist | Category | Recent Price | Smart Investing & Trading Score | Change % | YTD Change% |
| MEET | Meet |   | Internet | 3.46 | 20 | -3.62% | 0.00% |
| SNPS | Synopsys | | Software - Infrastructure | 471.08 | 20 | -3.62% | -2.42% |
| BLND | Blend Labs | | Software - | 3.47 | 20 | -3.88% | -9.64% |
| GAIA | Gaia | | Entertainment | 5.51 | 20 | -3.94% | 20.39% |
| NIHD | NII | | Wireless | 2.64 | 20 | -4.00% | 0.00% |
| LVLT | Level 3 | | Communication | 1.29 | 20 | -5.15% | 0.00% |
| KYO | Kyocera | | Electronics | 1.29 | 20 | -5.15% | 0.00% |
| OPRA | Opera | | Internet Content & Information | 18.31 | 20 | -6.96% | -0.50% |
| LUNA | Luna Innovations | | Instruments | 0.77 | 20 | -23.00% | -61.69% |
| AKTS | Akoustis | | Communication | 0.02 | 10 | 4.85% | 0.00% |
| AUR | Aurora Innovation | | IT | 5.34 | 10 | 2.50% | -12.46% |
| GFS | GlobalFoundries | | Semiconductors | 35.74 | 10 | 2.49% | -14.71% |
| COUP | Coupa Software | | Internet | 55.71 | 10 | 2.07% | 0.00% |
| IDN | Intellicheck | | Software - | 5.15 | 10 | 1.98% | 81.98% |
| Z | Zillow | | Internet Content & Information | 74.85 | 10 | 1.86% | 2.34% |
| ZG | Zillow | | Internet Content & Information | 72.46 | 10 | 1.80% | 3.40% |
| HUYA | HUYA | | Entertainment | 3.28 | 10 | 1.55% | 90.92% |
| TOST | Toast | | Software - Infrastructure | 36.13 | 10 | 1.49% | -0.69% |
| MLNX | Mellanox | | Semiconductor | 13.79 | 10 | 1.40% | 0.00% |
| ZBRA | Zebra | | Communication | 295.85 | 10 | 1.39% | -22.91% |
| CRM | Salesforce | | Software - | 238.88 | 10 | 1.35% | -27.53% |
| PAR | Par | | Software - | 38.17 | 10 | 1.30% | -46.62% |
| DHX | DHI | | Software - | 2.67 | 10 | 1.14% | 52.57% |
| TNGO | Tangoe | | Software | 0.91 | 10 | 1.11% | 0.00% |
| ADI | Analog Devices | | Semiconductors | 241.67 | 10 | 1.00% | 15.37% |
| For chart view version of above stock list: Chart View ➞ 0 - 25 , 25 - 50 , 50 - 75 , 75 - 100 , 100 - 125 , 125 - 150 , 150 - 175 , 175 - 200 , 200 - 225 , 225 - 250 , 250 - 275 , 275 - 300 , 300 - 325 , 325 - 350 , 350 - 375 , 375 - 400 , 400 - 425 , 425 - 450 , 450 - 475 , 475 - 500 , 500 - 525 , 525 - 550 , 550 - 575 , 575 - 600 , 600 - 625 , 625 - 650 , 650 - 675 , 675 - 700 , 700 - 725 , 725 - 750 , 750 - 775 , 775 - 800 , 800 - 825 , 825 - 850 , 850 - 875 , 875 - 900 | ||
 | Click To Change The Sort Order: By Market Cap or Company Size Performance: Year-to-date, Week and Day |  |
|
Get the most comprehensive stock market coverage daily at 12Stocks.com ➞ Best Stocks Today ➞ Best Stocks Weekly ➞ Best Stocks Year-to-Date ➞ Best Stocks Trends ➞  Best Stocks Today 12Stocks.com Best Nasdaq Stocks ➞ Best S&P 500 Stocks ➞ Best Tech Stocks ➞ Best Biotech Stocks ➞ |
| Detailed Overview of Tech Stocks |
| Tech Technical Overview, Leaders & Laggards, Top Tech ETF Funds & Detailed Tech Stocks List, Charts, Trends & More |
| Tech Sector: Technical Analysis, Trends & YTD Performance | |
| Technology sector is composed of stocks
from semiconductors, software, web, social media
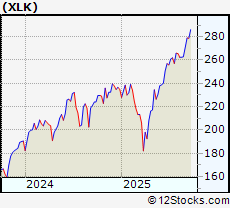
and services subsectors. Technology sector, as represented by XLK, an exchange-traded fund [ETF] that holds basket of tech stocks (e.g, Intel, Google) is up by 23.7823% and is currently outperforming the overall market by 9.0244% year-to-date. Below is a quick view of technical charts and trends: |
|
 XLK Weekly Chart |
|
| Long Term Trend: Very Good | |
| Medium Term Trend: Good | |
 XLK Daily Chart |
|
| Short Term Trend: Very Good | |
| Overall Trend Score: 100 | |
| YTD Performance: 23.7823% | |
| **Trend Scores & Views Are Only For Educational Purposes And Not For Investing | |
| 12Stocks.com: Top Performing Technology Sector Stocks | ||||||||||||||||||||||||||||||||||||||||||||||||
 The top performing Technology sector stocks year to date are
Now, more recently, over last week, the top performing Technology sector stocks on the move are


|
||||||||||||||||||||||||||||||||||||||||||||||||
| 12Stocks.com: Investing in Tech Sector using Exchange Traded Funds | |
|
The following table shows list of key exchange traded funds (ETF) that
help investors track Tech Index. For detailed view, check out our ETF Funds section of our website. Quick View: Move mouse or cursor over ETF symbol (ticker) to view short-term technical chart and over ETF name to view long term chart. Click on ticker or stock name for detailed view. Click on to add stock symbol to your watchlist and to view watchlist. |
12Stocks.com List of ETFs that track Tech Index
| Ticker | ETF Name | Watchlist | Recent Price | Smart Investing & Trading Score | Change % | Week % | Year-to-date % |
| IGN | Tech-Multimd Ntwk | | 53.86 | 40 | 0.918119 | -20.6435 | 0% |
| 12Stocks.com: Charts, Trends, Fundamental Data and Performances of Tech Stocks | |
|
We now take in-depth look at all Tech stocks including charts, multi-period performances and overall trends (as measured by Smart Investing & Trading Score). One can sort Tech stocks (click link to choose) by Daily, Weekly and by Year-to-Date performances. Also, one can sort by size of the company or by market capitalization. |
| Select Your Default Chart Type: | |||||
| |||||
| Click on stock symbol or name for detailed view. Click on to add stock symbol to your watchlist and to view watchlist. Quick View: Move mouse or cursor over "Daily" to quickly view daily technical stock chart and over "Weekly" to view weekly technical stock chart. | |||||


 | MEET The Meet Group, Inc. |
| Sector: Technology | |
| SubSector: Internet Information Providers | |
| MarketCap: 396.48 Millions | |
| Recent Price: 3.46 Smart Investing & Trading Score: 20 | |
| Day Percent Change: -3.62117% Day Change: -9999 | |
| Week Change: -63.6172% Year-to-date Change: 0.0% | |
| MEET Links: Profile News Message Board | |
| Charts:- Daily , Weekly | |
| Add MEET to Watchlist: View: Get Complete MEET Trend Analysis ➞ | |
 | SNPS Synopsys, Inc |
| Sector: Technology | |
| SubSector: Software - Infrastructure | |
| MarketCap: 110682 Millions | |
| Recent Price: 471.08 Smart Investing & Trading Score: 20 | |
| Day Percent Change: -3.62126% Day Change: -12.98 | |
| Week Change: 0.638766% Year-to-date Change: -2.4% | |
| SNPS Links: Profile News Message Board | |
| Charts:- Daily , Weekly | |
| Add SNPS to Watchlist: View: Get Complete SNPS Trend Analysis ➞ | |
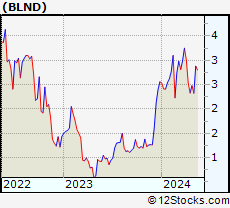 | BLND Blend Labs Inc |
| Sector: Technology | |
| SubSector: Software - Application | |
| MarketCap: 1045.08 Millions | |
| Recent Price: 3.47 Smart Investing & Trading Score: 20 | |
| Day Percent Change: -3.87812% Day Change: 0.49 | |
| Week Change: -7.95756% Year-to-date Change: -9.6% | |
| BLND Links: Profile News Message Board | |
| Charts:- Daily , Weekly | |
| Add BLND to Watchlist: View: Get Complete BLND Trend Analysis ➞ | |
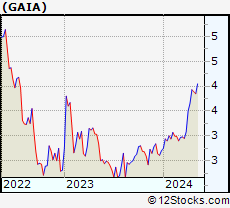 | GAIA Gaia Inc |
| Sector: Technology | |
| SubSector: Entertainment | |
| MarketCap: 139.61 Millions | |
| Recent Price: 5.51 Smart Investing & Trading Score: 20 | |
| Day Percent Change: -3.93728% Day Change: -0.32 | |
| Week Change: -10.9208% Year-to-date Change: 20.4% | |
| GAIA Links: Profile News Message Board | |
| Charts:- Daily , Weekly | |
| Add GAIA to Watchlist: View: Get Complete GAIA Trend Analysis ➞ | |
 | NIHD NII Holdings, Inc. |
| Sector: Technology | |
| SubSector: Wireless Communications | |
| MarketCap: 179.22 Millions | |
| Recent Price: 2.64 Smart Investing & Trading Score: 20 | |
| Day Percent Change: -4% Day Change: -9999 | |
| Week Change: -57.76% Year-to-date Change: 0.0% | |
| NIHD Links: Profile News Message Board | |
| Charts:- Daily , Weekly | |
| Add NIHD to Watchlist: View: Get Complete NIHD Trend Analysis ➞ | |
 | LVLT Level 3 Communications, Inc. |
| Sector: Technology | |
| SubSector: Diversified Communication Services | |
| MarketCap: 20718.4 Millions | |
| Recent Price: 1.29 Smart Investing & Trading Score: 20 | |
| Day Percent Change: -5.14706% Day Change: -9999 | |
| Week Change: -89.9922% Year-to-date Change: 0.0% | |
| LVLT Links: Profile News Message Board | |
| Charts:- Daily , Weekly | |
| Add LVLT to Watchlist: View: Get Complete LVLT Trend Analysis ➞ | |
 | KYO Kyocera Corporation |
| Sector: Technology | |
| SubSector: Diversified Electronics | |
| MarketCap: 20759.9 Millions | |
| Recent Price: 1.29 Smart Investing & Trading Score: 20 | |
| Day Percent Change: -5.14706% Day Change: -9999 | |
| Week Change: -89.9922% Year-to-date Change: 0.0% | |
| KYO Links: Profile News Message Board | |
| Charts:- Daily , Weekly | |
| Add KYO to Watchlist: View: Get Complete KYO Trend Analysis ➞ | |
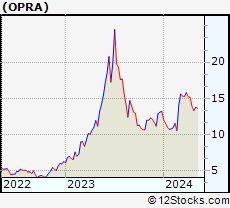 | OPRA Opera Ltd ADR |
| Sector: Technology | |
| SubSector: Internet Content & Information | |
| MarketCap: 1595.07 Millions | |
| Recent Price: 18.31 Smart Investing & Trading Score: 20 | |
| Day Percent Change: -6.96138% Day Change: 0.26 | |
| Week Change: -4.53597% Year-to-date Change: -0.5% | |
| OPRA Links: Profile News Message Board | |
| Charts:- Daily , Weekly | |
| Add OPRA to Watchlist: View: Get Complete OPRA Trend Analysis ➞ | |
 | LUNA Luna Innovations Incorporated |
| Sector: Technology | |
| SubSector: Scientific & Technical Instruments | |
| MarketCap: 166.353 Millions | |
| Recent Price: 0.77 Smart Investing & Trading Score: 20 | |
| Day Percent Change: -23% Day Change: -9999 | |
| Week Change: 14.9254% Year-to-date Change: -61.7% | |
| LUNA Links: Profile News Message Board | |
| Charts:- Daily , Weekly | |
| Add LUNA to Watchlist: View: Get Complete LUNA Trend Analysis ➞ | |
 | AKTS Akoustis Technologies, Inc. |
| Sector: Technology | |
| SubSector: Communication Equipment | |
| MarketCap: 197.039 Millions | |
| Recent Price: 0.02 Smart Investing & Trading Score: 10 | |
| Day Percent Change: 4.84848% Day Change: -9999 | |
| Week Change: -79.5024% Year-to-date Change: 0.0% | |
| AKTS Links: Profile News Message Board | |
| Charts:- Daily , Weekly | |
| Add AKTS to Watchlist: View: Get Complete AKTS Trend Analysis ➞ | |
 | AUR Aurora Innovation Inc |
| Sector: Technology | |
| SubSector: Information Technology Services | |
| MarketCap: 10573.8 Millions | |
| Recent Price: 5.34 Smart Investing & Trading Score: 10 | |
| Day Percent Change: 2.4952% Day Change: 0.08 | |
| Week Change: -8.24742% Year-to-date Change: -12.5% | |
| AUR Links: Profile News Message Board | |
| Charts:- Daily , Weekly | |
| Add AUR to Watchlist: View: Get Complete AUR Trend Analysis ➞ | |
 | GFS GlobalFoundries Inc |
| Sector: Technology | |
| SubSector: Semiconductors | |
| MarketCap: 18406.5 Millions | |
| Recent Price: 35.74 Smart Investing & Trading Score: 10 | |
| Day Percent Change: 2.49% Day Change: 0.86 | |
| Week Change: -0.62% Year-to-date Change: -14.7% | |
| GFS Links: Profile News Message Board | |
| Charts:- Daily , Weekly | |
| Add GFS to Watchlist: View: Get Complete GFS Trend Analysis ➞ | |
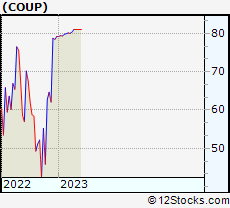 | COUP Coupa Software Incorporated |
| Sector: Technology | |
| SubSector: Internet Software & Services | |
| MarketCap: 9424.21 Millions | |
| Recent Price: 55.71 Smart Investing & Trading Score: 10 | |
| Day Percent Change: 2.07036% Day Change: -9999 | |
| Week Change: -31.1967% Year-to-date Change: 0.0% | |
| COUP Links: Profile News Message Board | |
| Charts:- Daily , Weekly | |
| Add COUP to Watchlist: View: Get Complete COUP Trend Analysis ➞ | |
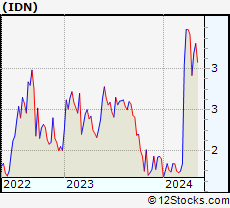 | IDN Intellicheck Inc |
| Sector: Technology | |
| SubSector: Software - Application | |
| MarketCap: 107 Millions | |
| Recent Price: 5.15 Smart Investing & Trading Score: 10 | |
| Day Percent Change: 1.9802% Day Change: -0.07 | |
| Week Change: -7.03971% Year-to-date Change: 82.0% | |
| IDN Links: Profile News Message Board | |
| Charts:- Daily , Weekly | |
| Add IDN to Watchlist: View: Get Complete IDN Trend Analysis ➞ | |
 | Z Zillow Group Inc |
| Sector: Technology | |
| SubSector: Internet Content & Information | |
| MarketCap: 21137.5 Millions | |
| Recent Price: 74.85 Smart Investing & Trading Score: 10 | |
| Day Percent Change: 1.86445% Day Change: 0.83 | |
| Week Change: -5.25316% Year-to-date Change: 2.3% | |
| Z Links: Profile News Message Board | |
| Charts:- Daily , Weekly | |
| Add Z to Watchlist: View: Get Complete Z Trend Analysis ➞ | |
 | ZG Zillow Group Inc |
| Sector: Technology | |
| SubSector: Internet Content & Information | |
| MarketCap: 21137.5 Millions | |
| Recent Price: 72.46 Smart Investing & Trading Score: 10 | |
| Day Percent Change: 1.79826% Day Change: 0.76 | |
| Week Change: -5.26866% Year-to-date Change: 3.4% | |
| ZG Links: Profile News Message Board | |
| Charts:- Daily , Weekly | |
| Add ZG to Watchlist: View: Get Complete ZG Trend Analysis ➞ | |
 | HUYA HUYA Inc ADR |
| Sector: Technology | |
| SubSector: Entertainment | |
| MarketCap: 257.65 Millions | |
| Recent Price: 3.28 Smart Investing & Trading Score: 10 | |
| Day Percent Change: 1.54799% Day Change: 0.13 | |
| Week Change: -2.95858% Year-to-date Change: 90.9% | |
| HUYA Links: Profile News Message Board | |
| Charts:- Daily , Weekly | |
| Add HUYA to Watchlist: View: Get Complete HUYA Trend Analysis ➞ | |
 | TOST Toast Inc |
| Sector: Technology | |
| SubSector: Software - Infrastructure | |
| MarketCap: 24031.3 Millions | |
| Recent Price: 36.13 Smart Investing & Trading Score: 10 | |
| Day Percent Change: 1.48876% Day Change: 0.28 | |
| Week Change: -3.73035% Year-to-date Change: -0.7% | |
| TOST Links: Profile News Message Board | |
| Charts:- Daily , Weekly | |
| Add TOST to Watchlist: View: Get Complete TOST Trend Analysis ➞ | |
 | MLNX Mellanox Technologies, Ltd. |
| Sector: Technology | |
| SubSector: Semiconductor - Broad Line | |
| MarketCap: 6440.62 Millions | |
| Recent Price: 13.79 Smart Investing & Trading Score: 10 | |
| Day Percent Change: 1.39706% Day Change: -9999 | |
| Week Change: -62.3018% Year-to-date Change: 0.0% | |
| MLNX Links: Profile News Message Board | |
| Charts:- Daily , Weekly | |
| Add MLNX to Watchlist: View: Get Complete MLNX Trend Analysis ➞ | |
 | ZBRA Zebra Technologies Corp |
| Sector: Technology | |
| SubSector: Communication Equipment | |
| MarketCap: 15955.2 Millions | |
| Recent Price: 295.85 Smart Investing & Trading Score: 10 | |
| Day Percent Change: 1.39141% Day Change: 3.75 | |
| Week Change: -4.09427% Year-to-date Change: -22.9% | |
| ZBRA Links: Profile News Message Board | |
| Charts:- Daily , Weekly | |
| Add ZBRA to Watchlist: View: Get Complete ZBRA Trend Analysis ➞ | |
 | CRM Salesforce Inc |
| Sector: Technology | |
| SubSector: Software - Application | |
| MarketCap: 238724 Millions | |
| Recent Price: 238.88 Smart Investing & Trading Score: 10 | |
| Day Percent Change: 1.35347% Day Change: 3.19 | |
| Week Change: -2.85087% Year-to-date Change: -27.5% | |
| CRM Links: Profile News Message Board | |
| Charts:- Daily , Weekly | |
| Add CRM to Watchlist: View: Get Complete CRM Trend Analysis ➞ | |
 | PAR Par Technology Corp |
| Sector: Technology | |
| SubSector: Software - Application | |
| MarketCap: 1960.07 Millions | |
| Recent Price: 38.17 Smart Investing & Trading Score: 10 | |
| Day Percent Change: 1.30042% Day Change: -0.26 | |
| Week Change: -7.39932% Year-to-date Change: -46.6% | |
| PAR Links: Profile News Message Board | |
| Charts:- Daily , Weekly | |
| Add PAR to Watchlist: View: Get Complete PAR Trend Analysis ➞ | |
 | DHX DHI Group Inc |
| Sector: Technology | |
| SubSector: Software - Application | |
| MarketCap: 142.59 Millions | |
| Recent Price: 2.67 Smart Investing & Trading Score: 10 | |
| Day Percent Change: 1.13636% Day Change: -0.16 | |
| Week Change: -4.98221% Year-to-date Change: 52.6% | |
| DHX Links: Profile News Message Board | |
| Charts:- Daily , Weekly | |
| Add DHX to Watchlist: View: Get Complete DHX Trend Analysis ➞ | |
 | TNGO Tangoe, Inc. |
| Sector: Technology | |
| SubSector: Business Software & Services | |
| MarketCap: 182.17 Millions | |
| Recent Price: 0.91 Smart Investing & Trading Score: 10 | |
| Day Percent Change: 1.11111% Day Change: -9999 | |
| Week Change: -69.4631% Year-to-date Change: 0.0% | |
| TNGO Links: Profile News Message Board | |
| Charts:- Daily , Weekly | |
| Add TNGO to Watchlist: View: Get Complete TNGO Trend Analysis ➞ | |
 | ADI Analog Devices Inc |
| Sector: Technology | |
| SubSector: Semiconductors | |
| MarketCap: 121547 Millions | |
| Recent Price: 241.67 Smart Investing & Trading Score: 10 | |
| Day Percent Change: 0.99883% Day Change: 3.56 | |
| Week Change: -2.79152% Year-to-date Change: 15.4% | |
| ADI Links: Profile News Message Board | |
| Charts:- Daily , Weekly | |
| Add ADI to Watchlist: View: Get Complete ADI Trend Analysis ➞ | |
| For tabular summary view of above stock list: Summary View ➞ 0 - 25 , 25 - 50 , 50 - 75 , 75 - 100 , 100 - 125 , 125 - 150 , 150 - 175 , 175 - 200 , 200 - 225 , 225 - 250 , 250 - 275 , 275 - 300 , 300 - 325 , 325 - 350 , 350 - 375 , 375 - 400 , 400 - 425 , 425 - 450 , 450 - 475 , 475 - 500 , 500 - 525 , 525 - 550 , 550 - 575 , 575 - 600 , 600 - 625 , 625 - 650 , 650 - 675 , 675 - 700 , 700 - 725 , 725 - 750 , 750 - 775 , 775 - 800 , 800 - 825 , 825 - 850 , 850 - 875 , 875 - 900 | ||
| Click To Change The Sort Order: By Market Cap or Company Size Performance: Year-to-date, Week and Day | |
| Select Chart Type: | ||
|
Best Stocks Today 12Stocks.com |
© 2025 12Stocks.com Terms & Conditions Privacy Contact Us
All Information Provided Only For Education And Not To Be Used For Investing or Trading. See Terms & Conditions


One More Thing ... Get Best Stocks Delivered Daily!
Never Ever Miss A Move With Our Top Ten Stocks Lists
Find Best Stocks In Any Market - Bull or Bear Market
Take A Peek At Our Top Ten Stocks Lists: Daily, Weekly, Year-to-Date & Top Trends
Find Best Stocks In Any Market - Bull or Bear Market
Take A Peek At Our Top Ten Stocks Lists: Daily, Weekly, Year-to-Date & Top Trends
Technology Stocks With Best Up Trends [0-bearish to 100-bullish]: Sony [100], Bakkt [100], Rigetti Computing[100], Fair Isaac[100], Arqit Quantum[100], D-Wave Quantum[100], Navitas Semiconductor[100], Shoals [100], Vuzix [100], Arteris [100], Lantronix [100]
Best Technology Stocks Year-to-Date:
Xunlei [370.476%], Sify [315.033%], Wolfspeed [307.01%], Digital Turbine[265.057%], EchoStar Corp[247.253%], CuriosityStream [241.605%], Viasat [224.029%], Pagaya [222.638%], Oneconnect Financial[209.053%], D-Wave Quantum[203.954%], CommScope Holding[203.101%] Best Technology Stocks This Week:
GTT [443626%], Barracuda Networks[71050%], Mobile TeleSystems[10483.5%], Nam Tai[5033.33%], Ebix [4200.85%], Fang [4150%], NantHealth [3114.02%], Hemisphere Media[2981.82%], Yandex N.V[2935.27%], Wolfspeed [1961.98%], Castlight Health[1751.96%] Best Technology Stocks Daily:
Sony [194.565%], Bakkt [28.6091%], Rigetti Computing[18.4925%], Fair Isaac[17.979%], Arqit Quantum[17.9369%], Marti [17%], Latch [16.6667%], Oclaro [14.734%], D-Wave Quantum[13.968%], Arbe Robotics[13.0178%], Navitas Semiconductor[12.3288%]