
 Login Sign Up


| |||||
 |  | ||||

| 12Stocks.com Market Intelligence |
Best Tech Stocks
| In a hurry? Tech Stocks Lists: Performance & Trends, Stock Charts, FANG Stocks
Sort Tech stocks: Daily, Weekly, Year-to-Date, Market Cap & Trends. Filter Tech stocks list by size:All Tech Large Mid-Range Small and MicroCap |
| 12Stocks.com Tech Stocks Performances & Trends Daily | |||||||||
|
|  The overall Smart Investing & Trading Score is 100 (0-bearish to 100-bullish) which puts Technology sector in short term bullish trend. The Smart Investing & Trading Score from previous trading session is 90 and an improvement of trend continues.
| ||||||||
Here are the Smart Investing & Trading Scores of the most requested Technology stocks at 12Stocks.com (click stock name for detailed review):
|


| 12Stocks.com: Investing in Technology sector with Stocks | |
|
The following table helps investors and traders sort through current performance and trends (as measured by Smart Investing & Trading Score) of various
stocks in the Tech sector. Quick View: Move mouse or cursor over stock symbol (ticker) to view short-term technical chart and over stock name to view long term chart. Click on  to add stock symbol to your watchlist and to add stock symbol to your watchlist and  to view watchlist. Click on any ticker or stock name for detailed market intelligence report for that stock. to view watchlist. Click on any ticker or stock name for detailed market intelligence report for that stock. |
12Stocks.com Performance of Stocks in Tech Sector
| Ticker | Stock Name | Watchlist | Category | Recent Price | Smart Investing & Trading Score | Change % | YTD Change% |
| CYOU | Changyou.com |   | Software | 43.91 | 70 | -0.05% | 0.00% |
| FFIV | F5 | | Software - Infrastructure | 327.07 | 70 | -0.07% | 29.92% |
| ELLI | Ellie Mae | | Software | 13.55 | 70 | -0.07% | 0.00% |
| ORBC | ORBCOMM | | Communication | 65.32 | 70 | -0.09% | 0.00% |
| CSC | Computer Sciences | | IT | 42.46 | 70 | -0.09% | 0.00% |
| YNDX | Yandex N.V | | Internet | 574.88 | 70 | -0.12% | 0.00% |
| LORL | Loral Space | | Communication | 96.44 | 70 | -0.17% | 0.00% |
| OCFT | Oneconnect Financial | | Software - | 7.51 | 70 | -0.27% | 209.05% |
| NH | NantHealth | | Healthcare Information | 13.02 | 70 | -0.31% | 0.00% |
| PDFS | | Software - | 26.11 | 70 | -0.42% | -4.46% | |
| RSYS | RadiSys | | Computer Based | 43.92 | 70 | -0.45% | 0.00% |
| CBB | Cinnati Bell | | Telecom | 49.58 | 70 | -0.54% | 0.00% |
| CSCO | Cisco Systems | | Communication | 68.31 | 70 | -0.64% | 17.85% |
| FORTY | Formula Systems | | IT | 136.07 | 70 | -0.85% | 66.23% |
| ESE | Esco | | Instruments | 210.95 | 70 | -1.03% | 60.53% |
| DVMT | Dell | | Computer | 795.75 | 70 | -1.06% | 0.00% |
| NATL | NCR Atleos | | Software - | 39.05 | 70 | -1.09% | 22.57% |
| HRS | Harris | | Communication | 33.42 | 70 | -1.30% | 0.00% |
| PATH | UiPath | | Software - Infrastructure | 12.75 | 70 | -1.85% | -1.39% |
| COMM | CommScope Holding | | Communication | 15.64 | 70 | -2.19% | 203.10% |
| ZIXI | Zix | | Software | 33.40 | 70 | -2.25% | 0.00% |
| YY | JOYY | | Internet | 47.85 | 70 | -2.39% | 20.29% |
| XRX | Xerox | | IT | 3.78 | 70 | -2.58% | -52.87% |
| IIJI | Internet Initiative | | Communication | 31.11 | 70 | -2.63% | 0.00% |
| DJCO | Daily Journal | | Software - | 459.51 | 70 | -3.48% | -17.56% |
| For chart view version of above stock list: Chart View ➞ 0 - 25 , 25 - 50 , 50 - 75 , 75 - 100 , 100 - 125 , 125 - 150 , 150 - 175 , 175 - 200 , 200 - 225 , 225 - 250 , 250 - 275 , 275 - 300 , 300 - 325 , 325 - 350 , 350 - 375 , 375 - 400 , 400 - 425 , 425 - 450 , 450 - 475 , 475 - 500 , 500 - 525 , 525 - 550 , 550 - 575 , 575 - 600 , 600 - 625 , 625 - 650 , 650 - 675 , 675 - 700 , 700 - 725 , 725 - 750 , 750 - 775 , 775 - 800 , 800 - 825 , 825 - 850 , 850 - 875 , 875 - 900 | ||
 | Click To Change The Sort Order: By Market Cap or Company Size Performance: Year-to-date, Week and Day |  |
|
Get the most comprehensive stock market coverage daily at 12Stocks.com ➞ Best Stocks Today ➞ Best Stocks Weekly ➞ Best Stocks Year-to-Date ➞ Best Stocks Trends ➞  Best Stocks Today 12Stocks.com Best Nasdaq Stocks ➞ Best S&P 500 Stocks ➞ Best Tech Stocks ➞ Best Biotech Stocks ➞ |
| Detailed Overview of Tech Stocks |
| Tech Technical Overview, Leaders & Laggards, Top Tech ETF Funds & Detailed Tech Stocks List, Charts, Trends & More |
| Tech Sector: Technical Analysis, Trends & YTD Performance | |
| Technology sector is composed of stocks
from semiconductors, software, web, social media
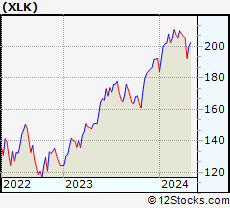
and services subsectors. Technology sector, as represented by XLK, an exchange-traded fund [ETF] that holds basket of tech stocks (e.g, Intel, Google) is up by 23.7823% and is currently outperforming the overall market by 9.0244% year-to-date. Below is a quick view of technical charts and trends: |
|
 XLK Weekly Chart |
|
| Long Term Trend: Very Good | |
| Medium Term Trend: Good | |
 XLK Daily Chart |
|
| Short Term Trend: Very Good | |
| Overall Trend Score: 100 | |
| YTD Performance: 23.7823% | |
| **Trend Scores & Views Are Only For Educational Purposes And Not For Investing | |
| 12Stocks.com: Top Performing Technology Sector Stocks | ||||||||||||||||||||||||||||||||||||||||||||||||
 The top performing Technology sector stocks year to date are
Now, more recently, over last week, the top performing Technology sector stocks on the move are


|
||||||||||||||||||||||||||||||||||||||||||||||||
| 12Stocks.com: Investing in Tech Sector using Exchange Traded Funds | |
|
The following table shows list of key exchange traded funds (ETF) that
help investors track Tech Index. For detailed view, check out our ETF Funds section of our website. Quick View: Move mouse or cursor over ETF symbol (ticker) to view short-term technical chart and over ETF name to view long term chart. Click on ticker or stock name for detailed view. Click on to add stock symbol to your watchlist and to view watchlist. |
12Stocks.com List of ETFs that track Tech Index
| Ticker | ETF Name | Watchlist | Recent Price | Smart Investing & Trading Score | Change % | Week % | Year-to-date % |
| IGN | Tech-Multimd Ntwk | | 53.86 | 40 | 0.918119 | -20.6435 | 0% |
| 12Stocks.com: Charts, Trends, Fundamental Data and Performances of Tech Stocks | |
|
We now take in-depth look at all Tech stocks including charts, multi-period performances and overall trends (as measured by Smart Investing & Trading Score). One can sort Tech stocks (click link to choose) by Daily, Weekly and by Year-to-Date performances. Also, one can sort by size of the company or by market capitalization. |
| Select Your Default Chart Type: | |||||
| |||||
| Click on stock symbol or name for detailed view. Click on to add stock symbol to your watchlist and to view watchlist. Quick View: Move mouse or cursor over "Daily" to quickly view daily technical stock chart and over "Weekly" to view weekly technical stock chart. | |||||


 | CYOU Changyou.com Limited |
| Sector: Technology | |
| SubSector: Multimedia & Graphics Software | |
| MarketCap: 587.286 Millions | |
| Recent Price: 43.91 Smart Investing & Trading Score: 70 | |
| Day Percent Change: -0.045527% Day Change: -9999 | |
| Week Change: 123.233% Year-to-date Change: 0.0% | |
| CYOU Links: Profile News Message Board | |
| Charts:- Daily , Weekly | |
| Add CYOU to Watchlist: View: Get Complete CYOU Trend Analysis ➞ | |
 | FFIV F5 Inc |
| Sector: Technology | |
| SubSector: Software - Infrastructure | |
| MarketCap: 18147 Millions | |
| Recent Price: 327.07 Smart Investing & Trading Score: 70 | |
| Day Percent Change: -0.0672187% Day Change: 0.34 | |
| Week Change: 0.801307% Year-to-date Change: 29.9% | |
| FFIV Links: Profile News Message Board | |
| Charts:- Daily , Weekly | |
| Add FFIV to Watchlist: View: Get Complete FFIV Trend Analysis ➞ | |
 | ELLI Ellie Mae, Inc. |
| Sector: Technology | |
| SubSector: Application Software | |
| MarketCap: 3332.94 Millions | |
| Recent Price: 13.55 Smart Investing & Trading Score: 70 | |
| Day Percent Change: -0.0737463% Day Change: -9999 | |
| Week Change: 148.169% Year-to-date Change: 0.0% | |
| ELLI Links: Profile News Message Board | |
| Charts:- Daily , Weekly | |
| Add ELLI to Watchlist: View: Get Complete ELLI Trend Analysis ➞ | |
 | ORBC ORBCOMM Inc. |
| Sector: Technology | |
| SubSector: Diversified Communication Services | |
| MarketCap: 116.964 Millions | |
| Recent Price: 65.32 Smart Investing & Trading Score: 70 | |
| Day Percent Change: -0.0917712% Day Change: -9999 | |
| Week Change: 468.494% Year-to-date Change: 0.0% | |
| ORBC Links: Profile News Message Board | |
| Charts:- Daily , Weekly | |
| Add ORBC to Watchlist: View: Get Complete ORBC Trend Analysis ➞ | |
 | CSC Computer Sciences Corporation |
| Sector: Technology | |
| SubSector: Information Technology Services | |
| MarketCap: 9777.03 Millions | |
| Recent Price: 42.46 Smart Investing & Trading Score: 70 | |
| Day Percent Change: -0.0941176% Day Change: -9999 | |
| Week Change: 189.829% Year-to-date Change: 0.0% | |
| CSC Links: Profile News Message Board | |
| Charts:- Daily , Weekly | |
| Add CSC to Watchlist: View: Get Complete CSC Trend Analysis ➞ | |
 | YNDX Yandex N.V. |
| Sector: Technology | |
| SubSector: Internet Information Providers | |
| MarketCap: 11018 Millions | |
| Recent Price: 574.88 Smart Investing & Trading Score: 70 | |
| Day Percent Change: -0.118146% Day Change: -9999 | |
| Week Change: 2935.27% Year-to-date Change: 0.0% | |
| YNDX Links: Profile News Message Board | |
| Charts:- Daily , Weekly | |
| Add YNDX to Watchlist: View: Get Complete YNDX Trend Analysis ➞ | |
 | LORL Loral Space & Communications Inc. |
| Sector: Technology | |
| SubSector: Communication Equipment | |
| MarketCap: 365.939 Millions | |
| Recent Price: 96.44 Smart Investing & Trading Score: 70 | |
| Day Percent Change: -0.165631% Day Change: -9999 | |
| Week Change: 132.274% Year-to-date Change: 0.0% | |
| LORL Links: Profile News Message Board | |
| Charts:- Daily , Weekly | |
| Add LORL to Watchlist: View: Get Complete LORL Trend Analysis ➞ | |
 | OCFT Oneconnect Financial Technology Co Ltd ADR |
| Sector: Technology | |
| SubSector: Software - Application | |
| MarketCap: 265.26 Millions | |
| Recent Price: 7.51 Smart Investing & Trading Score: 70 | |
| Day Percent Change: -0.265604% Day Change: 0.08 | |
| Week Change: 0.805369% Year-to-date Change: 209.1% | |
| OCFT Links: Profile News Message Board | |
| Charts:- Daily , Weekly | |
| Add OCFT to Watchlist: View: Get Complete OCFT Trend Analysis ➞ | |
 | NH NantHealth, Inc. |
| Sector: Technology | |
| SubSector: Healthcare Information Services | |
| MarketCap: 165.355 Millions | |
| Recent Price: 13.02 Smart Investing & Trading Score: 70 | |
| Day Percent Change: -0.306279% Day Change: -9999 | |
| Week Change: 3114.02% Year-to-date Change: 0.0% | |
| NH Links: Profile News Message Board | |
| Charts:- Daily , Weekly | |
| Add NH to Watchlist: View: Get Complete NH Trend Analysis ➞ | |
 | PDFS PDF Solutions Inc |
| Sector: Technology | |
| SubSector: Software - Application | |
| MarketCap: 787.88 Millions | |
| Recent Price: 26.11 Smart Investing & Trading Score: 70 | |
| Day Percent Change: -0.419527% Day Change: -0.04 | |
| Week Change: 2.55302% Year-to-date Change: -4.5% | |
| PDFS Links: Profile News Message Board | |
| Charts:- Daily , Weekly | |
| Add PDFS to Watchlist: View: Get Complete PDFS Trend Analysis ➞ | |
 | RSYS RadiSys Corporation |
| Sector: Technology | |
| SubSector: Computer Based Systems | |
| MarketCap: 153.48 Millions | |
| Recent Price: 43.92 Smart Investing & Trading Score: 70 | |
| Day Percent Change: -0.453309% Day Change: -9999 | |
| Week Change: 919.026% Year-to-date Change: 0.0% | |
| RSYS Links: Profile News Message Board | |
| Charts:- Daily , Weekly | |
| Add RSYS to Watchlist: View: Get Complete RSYS Trend Analysis ➞ | |
 | CBB Cincinnati Bell Inc. |
| Sector: Technology | |
| SubSector: Telecom Services - Domestic | |
| MarketCap: 722.977 Millions | |
| Recent Price: 49.58 Smart Investing & Trading Score: 70 | |
| Day Percent Change: -0.541625% Day Change: -9999 | |
| Week Change: 220.284% Year-to-date Change: 0.0% | |
| CBB Links: Profile News Message Board | |
| Charts:- Daily , Weekly | |
| Add CBB to Watchlist: View: Get Complete CBB Trend Analysis ➞ | |
 | CSCO Cisco Systems, Inc |
| Sector: Technology | |
| SubSector: Communication Equipment | |
| MarketCap: 264469 Millions | |
| Recent Price: 68.31 Smart Investing & Trading Score: 70 | |
| Day Percent Change: -0.644364% Day Change: -0.08 | |
| Week Change: 1.46613% Year-to-date Change: 17.8% | |
| CSCO Links: Profile News Message Board | |
| Charts:- Daily , Weekly | |
| Add CSCO to Watchlist: View: Get Complete CSCO Trend Analysis ➞ | |
 | FORTY Formula Systems (1985) Ltd. ADR |
| Sector: Technology | |
| SubSector: Information Technology Services | |
| MarketCap: 2097.04 Millions | |
| Recent Price: 136.07 Smart Investing & Trading Score: 70 | |
| Day Percent Change: -0.848878% Day Change: -9999 | |
| Week Change: 5.46814% Year-to-date Change: 66.2% | |
| FORTY Links: Profile News Message Board | |
| Charts:- Daily , Weekly | |
| Add FORTY to Watchlist: View: Get Complete FORTY Trend Analysis ➞ | |
 | ESE Esco Technologies, Inc |
| Sector: Technology | |
| SubSector: Scientific & Technical Instruments | |
| MarketCap: 5233.63 Millions | |
| Recent Price: 210.95 Smart Investing & Trading Score: 70 | |
| Day Percent Change: -1.03214% Day Change: 0.05 | |
| Week Change: -0.448325% Year-to-date Change: 60.5% | |
| ESE Links: Profile News Message Board | |
| Charts:- Daily , Weekly | |
| Add ESE to Watchlist: View: Get Complete ESE Trend Analysis ➞ | |
 | DVMT Dell Technologies Inc. |
| Sector: Technology | |
| SubSector: Diversified Computer Systems | |
| MarketCap: 13697.5 Millions | |
| Recent Price: 795.75 Smart Investing & Trading Score: 70 | |
| Day Percent Change: -1.05935% Day Change: -9999 | |
| Week Change: 538.849% Year-to-date Change: 0.0% | |
| DVMT Links: Profile News Message Board | |
| Charts:- Daily , Weekly | |
| Add DVMT to Watchlist: View: Get Complete DVMT Trend Analysis ➞ | |
 | NATL NCR Atleos Corp |
| Sector: Technology | |
| SubSector: Software - Application | |
| MarketCap: 2947.12 Millions | |
| Recent Price: 39.05 Smart Investing & Trading Score: 70 | |
| Day Percent Change: -1.09% Day Change: -0.43 | |
| Week Change: 0.57% Year-to-date Change: 22.6% | |
| NATL Links: Profile News Message Board | |
| Charts:- Daily , Weekly | |
| Add NATL to Watchlist: View: Get Complete NATL Trend Analysis ➞ | |
 | HRS Harris Corporation |
| Sector: Technology | |
| SubSector: Communication Equipment | |
| MarketCap: 13829.1 Millions | |
| Recent Price: 33.42 Smart Investing & Trading Score: 70 | |
| Day Percent Change: -1.29947% Day Change: -9999 | |
| Week Change: 14.5698% Year-to-date Change: 0.0% | |
| HRS Links: Profile News Message Board | |
| Charts:- Daily , Weekly | |
| Add HRS to Watchlist: View: Get Complete HRS Trend Analysis ➞ | |
 | PATH UiPath Inc |
| Sector: Technology | |
| SubSector: Software - Infrastructure | |
| MarketCap: 6147.6 Millions | |
| Recent Price: 12.75 Smart Investing & Trading Score: 70 | |
| Day Percent Change: -1.84758% Day Change: -0.35 | |
| Week Change: 3.49026% Year-to-date Change: -1.4% | |
| PATH Links: Profile News Message Board | |
| Charts:- Daily , Weekly | |
| Add PATH to Watchlist: View: Get Complete PATH Trend Analysis ➞ | |
 | COMM CommScope Holding Company Inc |
| Sector: Technology | |
| SubSector: Communication Equipment | |
| MarketCap: 3548.84 Millions | |
| Recent Price: 15.64 Smart Investing & Trading Score: 70 | |
| Day Percent Change: -2.18887% Day Change: -0.32 | |
| Week Change: -0.698413% Year-to-date Change: 203.1% | |
| COMM Links: Profile News Message Board | |
| Charts:- Daily , Weekly | |
| Add COMM to Watchlist: View: Get Complete COMM Trend Analysis ➞ | |
 | ZIXI Zix Corporation |
| Sector: Technology | |
| SubSector: Application Software | |
| MarketCap: 242.462 Millions | |
| Recent Price: 33.40 Smart Investing & Trading Score: 70 | |
| Day Percent Change: -2.25344% Day Change: -9999 | |
| Week Change: 293.636% Year-to-date Change: 0.0% | |
| ZIXI Links: Profile News Message Board | |
| Charts:- Daily , Weekly | |
| Add ZIXI to Watchlist: View: Get Complete ZIXI Trend Analysis ➞ | |
 | YY JOYY Inc. |
| Sector: Technology | |
| SubSector: Internet Information Providers | |
| MarketCap: 3527.6 Millions | |
| Recent Price: 47.85 Smart Investing & Trading Score: 70 | |
| Day Percent Change: -2.38678% Day Change: -9999 | |
| Week Change: 10.8922% Year-to-date Change: 20.3% | |
| YY Links: Profile News Message Board | |
| Charts:- Daily , Weekly | |
| Add YY to Watchlist: View: Get Complete YY Trend Analysis ➞ | |
 | XRX Xerox Holdings Corp |
| Sector: Technology | |
| SubSector: Information Technology Services | |
| MarketCap: 493.25 Millions | |
| Recent Price: 3.78 Smart Investing & Trading Score: 70 | |
| Day Percent Change: -2.57732% Day Change: -0.13 | |
| Week Change: 0% Year-to-date Change: -52.9% | |
| XRX Links: Profile News Message Board | |
| Charts:- Daily , Weekly | |
| Add XRX to Watchlist: View: Get Complete XRX Trend Analysis ➞ | |
 | IIJI Internet Initiative Japan Inc. |
| Sector: Technology | |
| SubSector: Communication Equipment | |
| MarketCap: 833.51 Millions | |
| Recent Price: 31.11 Smart Investing & Trading Score: 70 | |
| Day Percent Change: -2.62911% Day Change: -9999 | |
| Week Change: 913.355% Year-to-date Change: 0.0% | |
| IIJI Links: Profile News Message Board | |
| Charts:- Daily , Weekly | |
| Add IIJI to Watchlist: View: Get Complete IIJI Trend Analysis ➞ | |
 | DJCO Daily Journal Corporation |
| Sector: Technology | |
| SubSector: Software - Application | |
| MarketCap: 675.78 Millions | |
| Recent Price: 459.51 Smart Investing & Trading Score: 70 | |
| Day Percent Change: -3.47848% Day Change: -26.79 | |
| Week Change: -3.03139% Year-to-date Change: -17.6% | |
| DJCO Links: Profile News Message Board | |
| Charts:- Daily , Weekly | |
| Add DJCO to Watchlist: View: Get Complete DJCO Trend Analysis ➞ | |
| For tabular summary view of above stock list: Summary View ➞ 0 - 25 , 25 - 50 , 50 - 75 , 75 - 100 , 100 - 125 , 125 - 150 , 150 - 175 , 175 - 200 , 200 - 225 , 225 - 250 , 250 - 275 , 275 - 300 , 300 - 325 , 325 - 350 , 350 - 375 , 375 - 400 , 400 - 425 , 425 - 450 , 450 - 475 , 475 - 500 , 500 - 525 , 525 - 550 , 550 - 575 , 575 - 600 , 600 - 625 , 625 - 650 , 650 - 675 , 675 - 700 , 700 - 725 , 725 - 750 , 750 - 775 , 775 - 800 , 800 - 825 , 825 - 850 , 850 - 875 , 875 - 900 | ||
| Click To Change The Sort Order: By Market Cap or Company Size Performance: Year-to-date, Week and Day | |
| Select Chart Type: | ||
|
Best Stocks Today 12Stocks.com |
© 2025 12Stocks.com Terms & Conditions Privacy Contact Us
All Information Provided Only For Education And Not To Be Used For Investing or Trading. See Terms & Conditions


One More Thing ... Get Best Stocks Delivered Daily!
Never Ever Miss A Move With Our Top Ten Stocks Lists
Find Best Stocks In Any Market - Bull or Bear Market
Take A Peek At Our Top Ten Stocks Lists: Daily, Weekly, Year-to-Date & Top Trends
Find Best Stocks In Any Market - Bull or Bear Market
Take A Peek At Our Top Ten Stocks Lists: Daily, Weekly, Year-to-Date & Top Trends
Technology Stocks With Best Up Trends [0-bearish to 100-bullish]: Sony [100], Bakkt [100], Rigetti Computing[100], Fair Isaac[100], Arqit Quantum[100], D-Wave Quantum[100], Navitas Semiconductor[100], Shoals [100], Vuzix [100], Arteris [100], Lantronix [100]
Best Technology Stocks Year-to-Date:
Xunlei [370.476%], Sify [315.033%], Wolfspeed [307.01%], Digital Turbine[265.057%], EchoStar Corp[247.253%], CuriosityStream [241.605%], Viasat [224.029%], Pagaya [222.638%], Oneconnect Financial[209.053%], D-Wave Quantum[203.954%], CommScope Holding[203.101%] Best Technology Stocks This Week:
GTT [443626%], Barracuda Networks[71050%], Mobile TeleSystems[10483.5%], Nam Tai[5033.33%], Ebix [4200.85%], Fang [4150%], NantHealth [3114.02%], Hemisphere Media[2981.82%], Yandex N.V[2935.27%], Wolfspeed [1961.98%], Castlight Health[1751.96%] Best Technology Stocks Daily:
Sony [194.565%], Bakkt [28.6091%], Rigetti Computing[18.4925%], Fair Isaac[17.979%], Arqit Quantum[17.9369%], Marti [17%], Latch [16.6667%], Oclaro [14.734%], D-Wave Quantum[13.968%], Arbe Robotics[13.0178%], Navitas Semiconductor[12.3288%]