
 Login Sign Up


| |||||
 |  | ||||

| 12Stocks.com Market Intelligence |
Best Tech Stocks
| In a hurry? Tech Stocks Lists: Performance & Trends, Stock Charts, FANG Stocks
Sort Tech stocks: Daily, Weekly, Year-to-Date, Market Cap & Trends. Filter Tech stocks list by size:All Tech Large Mid-Range Small and MicroCap |
| 12Stocks.com Tech Stocks Performances & Trends Daily | |||||||||
|
|  The overall Smart Investing & Trading Score is 100 (0-bearish to 100-bullish) which puts Technology sector in short term bullish trend. The Smart Investing & Trading Score from previous trading session is 90 and an improvement of trend continues.
| ||||||||
Here are the Smart Investing & Trading Scores of the most requested Technology stocks at 12Stocks.com (click stock name for detailed review):
|


| 12Stocks.com: Investing in Technology sector with Stocks | |
|
The following table helps investors and traders sort through current performance and trends (as measured by Smart Investing & Trading Score) of various
stocks in the Tech sector. Quick View: Move mouse or cursor over stock symbol (ticker) to view short-term technical chart and over stock name to view long term chart. Click on  to add stock symbol to your watchlist and to add stock symbol to your watchlist and  to view watchlist. Click on any ticker or stock name for detailed market intelligence report for that stock. to view watchlist. Click on any ticker or stock name for detailed market intelligence report for that stock. |
12Stocks.com Performance of Stocks in Tech Sector
| Ticker | Stock Name | Watchlist | Category | Recent Price | Smart Investing & Trading Score | Change % | YTD Change% |
| TTD | Trade Desk |   | Advertising Agencies | 50.89 | 70 | 3.18% | -56.77% |
| MCHP | Microchip | | Semiconductors | 66.13 | 70 | 3.15% | 18.04% |
| SQ | Square | | Internet | 89.50 | 70 | 2.92% | 3.17% |
| API | Agora | | Software - | 3.85 | 70 | 2.81% | -12.01% |
| VSH | Vishay Inter | | Semiconductors | 15.82 | 70 | 2.59% | -4.01% |
| PAYS | PaySign | | Software - Infrastructure | 6.25 | 70 | 2.46% | 118.53% |
| PRGS | Progress Software | | Software - Infrastructure | 46.30 | 70 | 2.39% | -28.45% |
| MEI | Methode Electronics | | Electronic Components | 7.78 | 70 | 2.37% | -31.05% |
| TEO | Telecom Argentina | | Telecom | 7.45 | 70 | 2.34% | -46.01% |
| IMPV | Imperva | | Software | 57.69 | 70 | 2.23% | 0.00% |
| CRNT | Ceragon Networks | | Communication | 2.33 | 70 | 2.19% | -52.06% |
| PERI | Perion Network | | Internet Content & Information | 9.65 | 70 | 2.12% | 11.05% |
| QTM | Quantum | | Data Storage | 28.79 | 70 | 2.06% | 0.00% |
| BMI | Badger Meter | | Instruments | 179.75 | 70 | 1.74% | -14.83% |
| DGII | Digi | | Communication | 36.95 | 70 | 1.71% | 26.09% |
| MTSC | MTS Systems | | Instruments | 85.84 | 70 | 1.63% | 0.00% |
| MX | MagnaChip Semiconductor | | Semiconductors | 3.22 | 70 | 1.58% | -19.90% |
| AVGO | Broadcom | | Semiconductors | 338.18 | 70 | 1.44% | 46.57% |
| SITM | SiTime Corp | | Semiconductors | 299.84 | 70 | 1.40% | 34.09% |
| FIT | Fitbit | | Instruments | 28.32 | 70 | 1.36% | 0.00% |
| SWKS | Skyworks | | Semiconductors | 77.36 | 70 | 1.34% | -10.74% |
| NTAP | Netapp | | Software - Infrastructure | 120.07 | 70 | 1.32% | 5.22% |
| PLUS | ePlus | | Software - | 72.79 | 70 | 1.31% | -1.64% |
| LBTYA | Liberty Global | | Telecom | 11.73 | 70 | 1.30% | -10.59% |
| QRVO | Qorvo | | Semiconductors | 91.54 | 70 | 1.18% | 31.22% |
| For chart view version of above stock list: Chart View ➞ 0 - 25 , 25 - 50 , 50 - 75 , 75 - 100 , 100 - 125 , 125 - 150 , 150 - 175 , 175 - 200 , 200 - 225 , 225 - 250 , 250 - 275 , 275 - 300 , 300 - 325 , 325 - 350 , 350 - 375 , 375 - 400 , 400 - 425 , 425 - 450 , 450 - 475 , 475 - 500 , 500 - 525 , 525 - 550 , 550 - 575 , 575 - 600 , 600 - 625 , 625 - 650 , 650 - 675 , 675 - 700 , 700 - 725 , 725 - 750 , 750 - 775 , 775 - 800 , 800 - 825 , 825 - 850 , 850 - 875 , 875 - 900 | ||
 | Click To Change The Sort Order: By Market Cap or Company Size Performance: Year-to-date, Week and Day |  |
|
Get the most comprehensive stock market coverage daily at 12Stocks.com ➞ Best Stocks Today ➞ Best Stocks Weekly ➞ Best Stocks Year-to-Date ➞ Best Stocks Trends ➞  Best Stocks Today 12Stocks.com Best Nasdaq Stocks ➞ Best S&P 500 Stocks ➞ Best Tech Stocks ➞ Best Biotech Stocks ➞ |
| Detailed Overview of Tech Stocks |
| Tech Technical Overview, Leaders & Laggards, Top Tech ETF Funds & Detailed Tech Stocks List, Charts, Trends & More |
| Tech Sector: Technical Analysis, Trends & YTD Performance | |
| Technology sector is composed of stocks
from semiconductors, software, web, social media
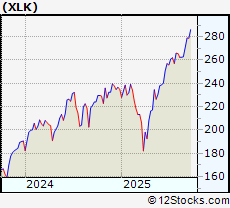
and services subsectors. Technology sector, as represented by XLK, an exchange-traded fund [ETF] that holds basket of tech stocks (e.g, Intel, Google) is up by 23.7823% and is currently outperforming the overall market by 9.0244% year-to-date. Below is a quick view of technical charts and trends: |
|
 XLK Weekly Chart |
|
| Long Term Trend: Very Good | |
| Medium Term Trend: Good | |
 XLK Daily Chart |
|
| Short Term Trend: Very Good | |
| Overall Trend Score: 100 | |
| YTD Performance: 23.7823% | |
| **Trend Scores & Views Are Only For Educational Purposes And Not For Investing | |
| 12Stocks.com: Top Performing Technology Sector Stocks | ||||||||||||||||||||||||||||||||||||||||||||||||
 The top performing Technology sector stocks year to date are
Now, more recently, over last week, the top performing Technology sector stocks on the move are


|
||||||||||||||||||||||||||||||||||||||||||||||||
| 12Stocks.com: Investing in Tech Sector using Exchange Traded Funds | |
|
The following table shows list of key exchange traded funds (ETF) that
help investors track Tech Index. For detailed view, check out our ETF Funds section of our website. Quick View: Move mouse or cursor over ETF symbol (ticker) to view short-term technical chart and over ETF name to view long term chart. Click on ticker or stock name for detailed view. Click on to add stock symbol to your watchlist and to view watchlist. |
12Stocks.com List of ETFs that track Tech Index
| Ticker | ETF Name | Watchlist | Recent Price | Smart Investing & Trading Score | Change % | Week % | Year-to-date % |
| IGN | Tech-Multimd Ntwk | | 53.86 | 40 | 0.918119 | -20.6435 | 0% |
| 12Stocks.com: Charts, Trends, Fundamental Data and Performances of Tech Stocks | |
|
We now take in-depth look at all Tech stocks including charts, multi-period performances and overall trends (as measured by Smart Investing & Trading Score). One can sort Tech stocks (click link to choose) by Daily, Weekly and by Year-to-Date performances. Also, one can sort by size of the company or by market capitalization. |
| Select Your Default Chart Type: | |||||
| |||||
| Click on stock symbol or name for detailed view. Click on to add stock symbol to your watchlist and to view watchlist. Quick View: Move mouse or cursor over "Daily" to quickly view daily technical stock chart and over "Weekly" to view weekly technical stock chart. | |||||


 | TTD Trade Desk Inc |
| Sector: Technology | |
| SubSector: Advertising Agencies | |
| MarketCap: 25459.3 Millions | |
| Recent Price: 50.89 Smart Investing & Trading Score: 70 | |
| Day Percent Change: 3.18329% Day Change: 1.59 | |
| Week Change: 8.57691% Year-to-date Change: -56.8% | |
| TTD Links: Profile News Message Board | |
| Charts:- Daily , Weekly | |
| Add TTD to Watchlist: View: Get Complete TTD Trend Analysis ➞ | |
 | MCHP Microchip Technology, Inc |
| Sector: Technology | |
| SubSector: Semiconductors | |
| MarketCap: 35575.7 Millions | |
| Recent Price: 66.13 Smart Investing & Trading Score: 70 | |
| Day Percent Change: 3.15083% Day Change: 1.97 | |
| Week Change: 0.425209% Year-to-date Change: 18.0% | |
| MCHP Links: Profile News Message Board | |
| Charts:- Daily , Weekly | |
| Add MCHP to Watchlist: View: Get Complete MCHP Trend Analysis ➞ | |
 | SQ Square, Inc. |
| Sector: Technology | |
| SubSector: Internet Software & Services | |
| MarketCap: 19323.1 Millions | |
| Recent Price: 89.50 Smart Investing & Trading Score: 70 | |
| Day Percent Change: 2.92088% Day Change: -9999 | |
| Week Change: 8.43227% Year-to-date Change: 3.2% | |
| SQ Links: Profile News Message Board | |
| Charts:- Daily , Weekly | |
| Add SQ to Watchlist: View: Get Complete SQ Trend Analysis ➞ | |
 | API Agora Inc ADR |
| Sector: Technology | |
| SubSector: Software - Application | |
| MarketCap: 254.69 Millions | |
| Recent Price: 3.85 Smart Investing & Trading Score: 70 | |
| Day Percent Change: 2.80749% Day Change: 0.07 | |
| Week Change: -2.16285% Year-to-date Change: -12.0% | |
| API Links: Profile News Message Board | |
| Charts:- Daily , Weekly | |
| Add API to Watchlist: View: Get Complete API Trend Analysis ➞ | |
 | VSH Vishay Intertechnology, Inc |
| Sector: Technology | |
| SubSector: Semiconductors | |
| MarketCap: 2109.72 Millions | |
| Recent Price: 15.82 Smart Investing & Trading Score: 70 | |
| Day Percent Change: 2.59403% Day Change: -0.23 | |
| Week Change: 3.87393% Year-to-date Change: -4.0% | |
| VSH Links: Profile News Message Board | |
| Charts:- Daily , Weekly | |
| Add VSH to Watchlist: View: Get Complete VSH Trend Analysis ➞ | |
 | PAYS PaySign Inc |
| Sector: Technology | |
| SubSector: Software - Infrastructure | |
| MarketCap: 285.87 Millions | |
| Recent Price: 6.25 Smart Investing & Trading Score: 70 | |
| Day Percent Change: 2.45902% Day Change: 0.03 | |
| Week Change: 10.8156% Year-to-date Change: 118.5% | |
| PAYS Links: Profile News Message Board | |
| Charts:- Daily , Weekly | |
| Add PAYS to Watchlist: View: Get Complete PAYS Trend Analysis ➞ | |
 | PRGS Progress Software Corp |
| Sector: Technology | |
| SubSector: Software - Infrastructure | |
| MarketCap: 1877.8 Millions | |
| Recent Price: 46.30 Smart Investing & Trading Score: 70 | |
| Day Percent Change: 2.38832% Day Change: 0.15 | |
| Week Change: 12.5425% Year-to-date Change: -28.5% | |
| PRGS Links: Profile News Message Board | |
| Charts:- Daily , Weekly | |
| Add PRGS to Watchlist: View: Get Complete PRGS Trend Analysis ➞ | |
 | MEI Methode Electronics, Inc |
| Sector: Technology | |
| SubSector: Electronic Components | |
| MarketCap: 250.32 Millions | |
| Recent Price: 7.78 Smart Investing & Trading Score: 70 | |
| Day Percent Change: 2.36842% Day Change: -0.02 | |
| Week Change: 0.387097% Year-to-date Change: -31.1% | |
| MEI Links: Profile News Message Board | |
| Charts:- Daily , Weekly | |
| Add MEI to Watchlist: View: Get Complete MEI Trend Analysis ➞ | |
 | TEO Telecom Argentina S.A. ADR |
| Sector: Technology | |
| SubSector: Telecom Services | |
| MarketCap: 1070.2 Millions | |
| Recent Price: 7.45 Smart Investing & Trading Score: 70 | |
| Day Percent Change: 2.33516% Day Change: 0.23 | |
| Week Change: -1.97368% Year-to-date Change: -46.0% | |
| TEO Links: Profile News Message Board | |
| Charts:- Daily , Weekly | |
| Add TEO to Watchlist: View: Get Complete TEO Trend Analysis ➞ | |
 | IMPV Imperva, Inc. |
| Sector: Technology | |
| SubSector: Application Software | |
| MarketCap: 1384.32 Millions | |
| Recent Price: 57.69 Smart Investing & Trading Score: 70 | |
| Day Percent Change: 2.23285% Day Change: -9999 | |
| Week Change: 315.934% Year-to-date Change: 0.0% | |
| IMPV Links: Profile News Message Board | |
| Charts:- Daily , Weekly | |
| Add IMPV to Watchlist: View: Get Complete IMPV Trend Analysis ➞ | |
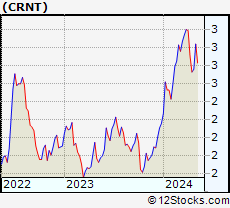 | CRNT Ceragon Networks Ltd |
| Sector: Technology | |
| SubSector: Communication Equipment | |
| MarketCap: 177.68 Millions | |
| Recent Price: 2.33 Smart Investing & Trading Score: 70 | |
| Day Percent Change: 2.19298% Day Change: 0.02 | |
| Week Change: -5.66802% Year-to-date Change: -52.1% | |
| CRNT Links: Profile News Message Board | |
| Charts:- Daily , Weekly | |
| Add CRNT to Watchlist: View: Get Complete CRNT Trend Analysis ➞ | |
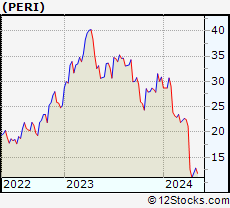 | PERI Perion Network Ltd |
| Sector: Technology | |
| SubSector: Internet Content & Information | |
| MarketCap: 412.54 Millions | |
| Recent Price: 9.65 Smart Investing & Trading Score: 70 | |
| Day Percent Change: 2.1164% Day Change: 0.11 | |
| Week Change: 1.25918% Year-to-date Change: 11.0% | |
| PERI Links: Profile News Message Board | |
| Charts:- Daily , Weekly | |
| Add PERI to Watchlist: View: Get Complete PERI Trend Analysis ➞ | |
 | QTM Quantum Corporation |
| Sector: Technology | |
| SubSector: Data Storage Devices | |
| MarketCap: 246.14 Millions | |
| Recent Price: 28.79 Smart Investing & Trading Score: 70 | |
| Day Percent Change: 2.05601% Day Change: -9999 | |
| Week Change: 55.6216% Year-to-date Change: 0.0% | |
| QTM Links: Profile News Message Board | |
| Charts:- Daily , Weekly | |
| Add QTM to Watchlist: View: Get Complete QTM Trend Analysis ➞ | |
 | BMI Badger Meter Inc |
| Sector: Technology | |
| SubSector: Scientific & Technical Instruments | |
| MarketCap: 5387.78 Millions | |
| Recent Price: 179.75 Smart Investing & Trading Score: 70 | |
| Day Percent Change: 1.74336% Day Change: -4.15 | |
| Week Change: 4.31175% Year-to-date Change: -14.8% | |
| BMI Links: Profile News Message Board | |
| Charts:- Daily , Weekly | |
| Add BMI to Watchlist: View: Get Complete BMI Trend Analysis ➞ | |
 | DGII Digi International, Inc |
| Sector: Technology | |
| SubSector: Communication Equipment | |
| MarketCap: 1287.77 Millions | |
| Recent Price: 36.95 Smart Investing & Trading Score: 70 | |
| Day Percent Change: 1.70658% Day Change: -0.47 | |
| Week Change: -0.296816% Year-to-date Change: 26.1% | |
| DGII Links: Profile News Message Board | |
| Charts:- Daily , Weekly | |
| Add DGII to Watchlist: View: Get Complete DGII Trend Analysis ➞ | |
 | MTSC MTS Systems Corporation |
| Sector: Technology | |
| SubSector: Scientific & Technical Instruments | |
| MarketCap: 357.353 Millions | |
| Recent Price: 85.84 Smart Investing & Trading Score: 70 | |
| Day Percent Change: 1.63391% Day Change: -9999 | |
| Week Change: -11.1663% Year-to-date Change: 0.0% | |
| MTSC Links: Profile News Message Board | |
| Charts:- Daily , Weekly | |
| Add MTSC to Watchlist: View: Get Complete MTSC Trend Analysis ➞ | |
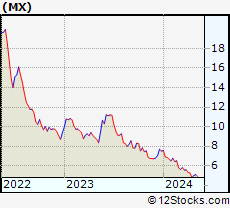 | MX MagnaChip Semiconductor Corp |
| Sector: Technology | |
| SubSector: Semiconductors | |
| MarketCap: 106.69 Millions | |
| Recent Price: 3.22 Smart Investing & Trading Score: 70 | |
| Day Percent Change: 1.57729% Day Change: 0.04 | |
| Week Change: -0.923077% Year-to-date Change: -19.9% | |
| MX Links: Profile News Message Board | |
| Charts:- Daily , Weekly | |
| Add MX to Watchlist: View: Get Complete MX Trend Analysis ➞ | |
 | AVGO Broadcom Inc |
| Sector: Technology | |
| SubSector: Semiconductors | |
| MarketCap: 1575150 Millions | |
| Recent Price: 338.18 Smart Investing & Trading Score: 70 | |
| Day Percent Change: 1.43676% Day Change: 7.16 | |
| Week Change: -0.333029% Year-to-date Change: 46.6% | |
| AVGO Links: Profile News Message Board | |
| Charts:- Daily , Weekly | |
| Add AVGO to Watchlist: View: Get Complete AVGO Trend Analysis ➞ | |
 | SITM SiTime Corp |
| Sector: Technology | |
| SubSector: Semiconductors | |
| MarketCap: 6104.95 Millions | |
| Recent Price: 299.84 Smart Investing & Trading Score: 70 | |
| Day Percent Change: 1.39664% Day Change: 2.29 | |
| Week Change: 2.09404% Year-to-date Change: 34.1% | |
| SITM Links: Profile News Message Board | |
| Charts:- Daily , Weekly | |
| Add SITM to Watchlist: View: Get Complete SITM Trend Analysis ➞ | |
 | FIT Fitbit, Inc. |
| Sector: Technology | |
| SubSector: Scientific & Technical Instruments | |
| MarketCap: 1652.63 Millions | |
| Recent Price: 28.32 Smart Investing & Trading Score: 70 | |
| Day Percent Change: 1.36006% Day Change: -9999 | |
| Week Change: 1.14286% Year-to-date Change: 0.0% | |
| FIT Links: Profile News Message Board | |
| Charts:- Daily , Weekly | |
| Add FIT to Watchlist: View: Get Complete FIT Trend Analysis ➞ | |
 | SWKS Skyworks Solutions, Inc |
| Sector: Technology | |
| SubSector: Semiconductors | |
| MarketCap: 11161.8 Millions | |
| Recent Price: 77.36 Smart Investing & Trading Score: 70 | |
| Day Percent Change: 1.33613% Day Change: 1.12 | |
| Week Change: -4.09125% Year-to-date Change: -10.7% | |
| SWKS Links: Profile News Message Board | |
| Charts:- Daily , Weekly | |
| Add SWKS to Watchlist: View: Get Complete SWKS Trend Analysis ➞ | |
 | NTAP Netapp Inc |
| Sector: Technology | |
| SubSector: Software - Infrastructure | |
| MarketCap: 23704.7 Millions | |
| Recent Price: 120.07 Smart Investing & Trading Score: 70 | |
| Day Percent Change: 1.32489% Day Change: 0.97 | |
| Week Change: -2.58012% Year-to-date Change: 5.2% | |
| NTAP Links: Profile News Message Board | |
| Charts:- Daily , Weekly | |
| Add NTAP to Watchlist: View: Get Complete NTAP Trend Analysis ➞ | |
 | PLUS ePlus Inc |
| Sector: Technology | |
| SubSector: Software - Application | |
| MarketCap: 1886.69 Millions | |
| Recent Price: 72.79 Smart Investing & Trading Score: 70 | |
| Day Percent Change: 1.30828% Day Change: -0.49 | |
| Week Change: 1.53438% Year-to-date Change: -1.6% | |
| PLUS Links: Profile News Message Board | |
| Charts:- Daily , Weekly | |
| Add PLUS to Watchlist: View: Get Complete PLUS Trend Analysis ➞ | |
 | LBTYA Liberty Global Ltd |
| Sector: Technology | |
| SubSector: Telecom Services | |
| MarketCap: 4080.38 Millions | |
| Recent Price: 11.73 Smart Investing & Trading Score: 70 | |
| Day Percent Change: 1.29534% Day Change: 0.12 | |
| Week Change: 1.82292% Year-to-date Change: -10.6% | |
| LBTYA Links: Profile News Message Board | |
| Charts:- Daily , Weekly | |
| Add LBTYA to Watchlist: View: Get Complete LBTYA Trend Analysis ➞ | |
 | QRVO Qorvo Inc |
| Sector: Technology | |
| SubSector: Semiconductors | |
| MarketCap: 8606.65 Millions | |
| Recent Price: 91.54 Smart Investing & Trading Score: 70 | |
| Day Percent Change: 1.18271% Day Change: 1.26 | |
| Week Change: -1.85483% Year-to-date Change: 31.2% | |
| QRVO Links: Profile News Message Board | |
| Charts:- Daily , Weekly | |
| Add QRVO to Watchlist: View: Get Complete QRVO Trend Analysis ➞ | |
| For tabular summary view of above stock list: Summary View ➞ 0 - 25 , 25 - 50 , 50 - 75 , 75 - 100 , 100 - 125 , 125 - 150 , 150 - 175 , 175 - 200 , 200 - 225 , 225 - 250 , 250 - 275 , 275 - 300 , 300 - 325 , 325 - 350 , 350 - 375 , 375 - 400 , 400 - 425 , 425 - 450 , 450 - 475 , 475 - 500 , 500 - 525 , 525 - 550 , 550 - 575 , 575 - 600 , 600 - 625 , 625 - 650 , 650 - 675 , 675 - 700 , 700 - 725 , 725 - 750 , 750 - 775 , 775 - 800 , 800 - 825 , 825 - 850 , 850 - 875 , 875 - 900 | ||
| Click To Change The Sort Order: By Market Cap or Company Size Performance: Year-to-date, Week and Day | |
| Select Chart Type: | ||
|
Best Stocks Today 12Stocks.com |
© 2025 12Stocks.com Terms & Conditions Privacy Contact Us
All Information Provided Only For Education And Not To Be Used For Investing or Trading. See Terms & Conditions


One More Thing ... Get Best Stocks Delivered Daily!
Never Ever Miss A Move With Our Top Ten Stocks Lists
Find Best Stocks In Any Market - Bull or Bear Market
Take A Peek At Our Top Ten Stocks Lists: Daily, Weekly, Year-to-Date & Top Trends
Find Best Stocks In Any Market - Bull or Bear Market
Take A Peek At Our Top Ten Stocks Lists: Daily, Weekly, Year-to-Date & Top Trends
Technology Stocks With Best Up Trends [0-bearish to 100-bullish]: Sony [100], Bakkt [100], Rigetti Computing[100], Fair Isaac[100], Arqit Quantum[100], D-Wave Quantum[100], Navitas Semiconductor[100], Shoals [100], Vuzix [100], Arteris [100], Lantronix [100]
Best Technology Stocks Year-to-Date:
Xunlei [370.476%], Sify [315.033%], Wolfspeed [307.01%], Digital Turbine[265.057%], EchoStar Corp[247.253%], CuriosityStream [241.605%], Viasat [224.029%], Pagaya [222.638%], Oneconnect Financial[209.053%], D-Wave Quantum[203.954%], CommScope Holding[203.101%] Best Technology Stocks This Week:
GTT [443626%], Barracuda Networks[71050%], Mobile TeleSystems[10483.5%], Nam Tai[5033.33%], Ebix [4200.85%], Fang [4150%], NantHealth [3114.02%], Hemisphere Media[2981.82%], Yandex N.V[2935.27%], Wolfspeed [1961.98%], Castlight Health[1751.96%] Best Technology Stocks Daily:
Sony [194.565%], Bakkt [28.6091%], Rigetti Computing[18.4925%], Fair Isaac[17.979%], Arqit Quantum[17.9369%], Marti [17%], Latch [16.6667%], Oclaro [14.734%], D-Wave Quantum[13.968%], Arbe Robotics[13.0178%], Navitas Semiconductor[12.3288%]