
 Login Sign Up


| |||||
 |  | ||||

| 12Stocks.com Market Intelligence |
Best SmallCap Stocks
|
| In a hurry? Small Cap Stock Lists: Performance Trends Table, Stock Charts
Sort Small Cap stocks: Daily, Weekly, Year-to-Date, Market Cap & Trends. Filter Small Cap stocks list by sector: Show all, Tech, Finance, Energy, Staples, Retail, Industrial, Materials, Utilities and HealthCare Filter Small Cap stocks list by size: All Large Medium Small and MicroCap |
| 12Stocks.com Small Cap Stocks Performances & Trends Daily | |||||||||
|
|  The overall Smart Investing & Trading Score is 76 (0-bearish to 100-bullish) which puts Small Cap index in short term neutral to bullish trend. The Smart Investing & Trading Score from previous trading session is 90 and hence a deterioration of trend.
| ||||||||
Here are the Smart Investing & Trading Scores of the most requested small cap stocks at 12Stocks.com (click stock name for detailed review):
|


| 12Stocks.com: Investing in Smallcap Index with Stocks | |
|
The following table helps investors and traders sort through current performance and trends (as measured by Smart Investing & Trading Score) of various
stocks in the Smallcap Index. Quick View: Move mouse or cursor over stock symbol (ticker) to view short-term technical chart and over stock name to view long term chart. Click on  to add stock symbol to your watchlist and to add stock symbol to your watchlist and  to view watchlist. Click on any ticker or stock name for detailed market intelligence report for that stock. to view watchlist. Click on any ticker or stock name for detailed market intelligence report for that stock. |
12Stocks.com Performance of Stocks in Smallcap Index
| Ticker | Stock Name | Watchlist | Category | Recent Price | Smart Investing & Trading Score | Change % | Weekly Change% |
| CNTY | Century Casinos |   | Services & Goods | 2.94 | 32 | -2.33% | -4.55% |
| MEC | Mayville Engineering | | Industrials | 15.50 | 68 | 0.19% | -4.56% |
| BW | Babcock & Wilcox Enterprises | | Industrials | 1.23 | 64 | 2.50% | -4.65% |
| MVIS | MicroVision | | Technology | 1.16 | 0 | -3.75% | -4.94% |
| TWI | Titan | | Industrials | 8.91 | 32 | -0.22% | -5.11% |
| TSQ | Townsquare Media | | Services & Goods | 11.55 | 49 | 0.17% | -5.17% |
| TZA | Direxion Daily | | Utilities | 17.35 | 17 | -0.17% | -5.29% |
| PRTH | Priority | | Industrials | 3.44 | 68 | -0.29% | -5.49% |
| BH | Biglari | | Services & Goods | 200.00 | 43 | -7.32% | -5.66% |
| VTNR | Vertex Energy | | Industrials | 1.14 | 32 | 0.44% | -5.81% |
| CMT | Core Molding | | Materials | 18.85 | 43 | -6.36% | -5.99% |
| CVGI | Commercial Vehicle | | Services & Goods | 5.28 | 25 | -1.49% | -6.22% |
| CTXR | Citius | | Health Care | 0.65 | 7 | -2.86% | -6.66% |
| LMB | Limbach | | Industrials | 47.75 | 32 | -1.26% | -7.08% |
| LCTX | Lineage Cell | | Health Care | 1.08 | 41 | 1.89% | -7.69% |
| NL | NL Industries | | Services & Goods | 7.27 | 68 | 4.01% | -7.74% |
| MG | Mistras Group | | Services & Goods | 8.38 | 17 | 0.48% | -8.42% |
| INFU | InfuSystem | | Health Care | 6.51 | 0 | -4.62% | -10.58% |
| DZSI | DASAN Zhone | | Technology | 1.52 | 76 | 0.00% | -10.59% |
| GRWG | GrowGeneration | | Materials | 2.61 | 46 | -9.69% | -10.62% |
| RRGB | Red Robin | | Services & Goods | 6.76 | 10 | -4.52% | -11.05% |
| XFOR | X4 | | Health Care | 0.93 | 10 | -3.26% | -11.58% |
| ATLC | Atlanticus | | Financials | 24.89 | 7 | 3.69% | -13.92% |
| FENC | Fennec | | Health Care | 7.04 | 0 | -1.12% | -27.79% |
| VOXX | VOXX | | Consumer Staples | 4.00 | 7 | 0.25% | -32.66% |
| For chart view version of above stock list: Chart View ➞ 0 - 25 , 25 - 50 , 50 - 75 , 75 - 100 , 100 - 125 , 125 - 150 , 150 - 175 , 175 - 200 | ||
 | Click To Change The Sort Order: By Market Cap or Company Size Performance: Year-to-date, Week and Day |  |
| Too many stocks? View smallcap stocks filtered by marketcap & sector |
| Marketcap: All SmallCap Stocks (default-no microcap), Large, Mid-Range, Small |
| Smallcap Sector: Tech, Finance, Energy, Staples, Retail, Industrial, Materials, & Medical |
|
Get the most comprehensive stock market coverage daily at 12Stocks.com ➞ Best Stocks Today ➞ Best Stocks Weekly ➞ Best Stocks Year-to-Date ➞ Best Stocks Trends ➞  Best Stocks Today 12Stocks.com Best Nasdaq Stocks ➞ Best S&P 500 Stocks ➞ Best Tech Stocks ➞ Best Biotech Stocks ➞ |
| Detailed Overview of SmallCap Stocks |
| SmallCap Technical Overview, Leaders & Laggards, Top SmallCap ETF Funds & Detailed SmallCap Stocks List, Charts, Trends & More |
| Smallcap: Technical Analysis, Trends & YTD Performance | |
| SmallCap segment as represented by
IWM, an exchange-traded fund [ETF], holds basket of thousands of smallcap stocks from across all major sectors of the US stock market. The smallcap index (contains stocks like Riverbed & Sotheby's) is up by 3.67% and is currently underperforming the overall market by -6.9% year-to-date. Below is a quick view of technical charts and trends: | |
 IWM Weekly Chart |
|
| Long Term Trend: Very Good | |
| Medium Term Trend: Very Good | |
 IWM Daily Chart |
|
| Short Term Trend: Good | |
| Overall Trend Score: 76 | |
| YTD Performance: 3.67% | |
| **Trend Scores & Views Are Only For Educational Purposes And Not For Investing | |
| 12Stocks.com: Top Performing Small Cap Index Stocks | ||||||||||||||||||||||||||||||||||||||||||||||||
 The top performing Small Cap Index stocks year to date are
Now, more recently, over last week, the top performing Small Cap Index stocks on the move are


|
||||||||||||||||||||||||||||||||||||||||||||||||
| 12Stocks.com: Investing in Smallcap Index using Exchange Traded Funds | |
|
The following table shows list of key exchange traded funds (ETF) that
help investors track Smallcap index. The following list also includes leveraged ETF funds that track twice or thrice the daily returns of Smallcap indices. Short or inverse ETF funds move in the opposite direction to the index they track and are useful during market pullbacks or during bear markets. Quick View: Move mouse or cursor over ETF symbol (ticker) to view short-term technical chart and over ETF name to view long term chart. Click on ticker or stock name for detailed view. Click on to add stock symbol to your watchlist and to view watchlist. |
12Stocks.com List of ETFs that track Smallcap Index
| Ticker | ETF Name | Watchlist | Recent Price | Smart Investing & Trading Score | Change % | Week % | Year-to-date % |
| IWM | iShares Russell 2000 | | 208.08 | 76 | 0.07 | 1.85 | 3.67% |
| VTWO | Vanguard Russell 2000 ETF | | 84.11 | 71 | 0.00 | 1.8 | 3.71% |
| IJR | iShares Core S&P Small-Cap | | 110.39 | 68 | -0.22 | 1.29 | 1.98% |
| IWN | iShares Russell 2000 Value | | 158.71 | 76 | -0.07 | 1.61 | 2.18% |
| IWO | iShares Russell 2000 Growth | | 265.15 | 63 | -0.75 | 2.01 | 5.13% |
| IJS | iShares S&P Small-Cap 600 Value | | 101.87 | 76 | -0.15 | 1.34 | -1.16% |
| IJT | iShares S&P Small-Cap 600 Growth | | 131.34 | 71 | 0.04 | 1.14 | 4.95% |
| XSLV | PowerShares S&P SmallCap Low Volatil ETF | | 44.48 | 83 | -0.01 | 0.55 | 0.74% |
| SAA | ProShares Ultra SmallCap600 | | 24.90 | 71 | 0.50 | 2.28 | -0.18% |
| SMLV | SPDR SSGA US Small Cap Low Volatil ETF | | 113.28 | 95 | 0.43 | 1.85 | 0.68% |
| SDD | ProShares UltraShort SmallCap600 | | 17.84 | 35 | 0.96 | -2.41 | -3.19% |
| SBB | ProShares Short SmallCap600 | | 15.77 | 25 | 0.41 | -1.14 | -0.98% |
| 12Stocks.com: Charts, Trends, Fundamental Data and Performances of SmallCap Stocks | |
|
We now take in-depth look at all SmallCap stocks including charts, multi-period performances and overall trends (as measured by Smart Investing & Trading Score). One can sort SmallCap stocks (click link to choose) by Daily, Weekly and by Year-to-Date performances. Also, one can sort by size of the company or by market capitalization. |
| Select Your Default Chart Type: | |||||
| |||||
| Click on stock symbol or name for detailed view. Click on to add stock symbol to your watchlist and to view watchlist. Quick View: Move mouse or cursor over "Daily" to quickly view daily technical stock chart and over "Weekly" to view weekly technical stock chart. | |||||

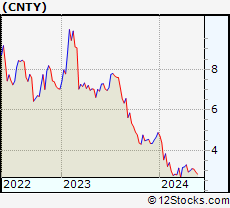 | CNTY Century Casinos, Inc. |
| Sector: Services & Goods | |
| SubSector: Resorts & Casinos | |
| MarketCap: 41.3794 Millions | |
| Recent Price: 2.94 Smart Investing & Trading Score: 32 | |
| Day Percent Change: -2.33% Day Change: -0.07 | |
| Week Change: -4.55% Year-to-date Change: -39.8% | |
| CNTY Links: Profile News Message Board | |
| Charts:- Daily , Weekly | |
| Add CNTY to Watchlist: View: Get Complete CNTY Trend Analysis ➞ | |
 | MEC Mayville Engineering Company, Inc. |
| Sector: Industrials | |
| SubSector: Metal Fabrication | |
| MarketCap: 143.55 Millions | |
| Recent Price: 15.50 Smart Investing & Trading Score: 68 | |
| Day Percent Change: 0.19% Day Change: 0.03 | |
| Week Change: -4.56% Year-to-date Change: 7.5% | |
| MEC Links: Profile News Message Board | |
| Charts:- Daily , Weekly | |
| Add MEC to Watchlist: View: Get Complete MEC Trend Analysis ➞ | |
 | BW Babcock & Wilcox Enterprises, Inc. |
| Sector: Industrials | |
| SubSector: Industrial Electrical Equipment | |
| MarketCap: 59.0879 Millions | |
| Recent Price: 1.23 Smart Investing & Trading Score: 64 | |
| Day Percent Change: 2.50% Day Change: 0.03 | |
| Week Change: -4.65% Year-to-date Change: -15.8% | |
| BW Links: Profile News Message Board | |
| Charts:- Daily , Weekly | |
| Add BW to Watchlist: View: Get Complete BW Trend Analysis ➞ | |
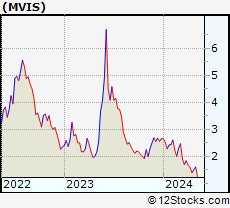 | MVIS MicroVision, Inc. |
| Sector: Technology | |
| SubSector: Scientific & Technical Instruments | |
| MarketCap: 32.1553 Millions | |
| Recent Price: 1.16 Smart Investing & Trading Score: 0 | |
| Day Percent Change: -3.75% Day Change: -0.04 | |
| Week Change: -4.94% Year-to-date Change: -56.6% | |
| MVIS Links: Profile News Message Board | |
| Charts:- Daily , Weekly | |
| Add MVIS to Watchlist: View: Get Complete MVIS Trend Analysis ➞ | |
 | TWI Titan International, Inc. |
| Sector: Industrials | |
| SubSector: Farm & Construction Machinery | |
| MarketCap: 104.607 Millions | |
| Recent Price: 8.91 Smart Investing & Trading Score: 32 | |
| Day Percent Change: -0.22% Day Change: -0.02 | |
| Week Change: -5.11% Year-to-date Change: -40.1% | |
| TWI Links: Profile News Message Board | |
| Charts:- Daily , Weekly | |
| Add TWI to Watchlist: View: Get Complete TWI Trend Analysis ➞ | |
 | TSQ Townsquare Media, Inc. |
| Sector: Services & Goods | |
| SubSector: Broadcasting - Radio | |
| MarketCap: 101.795 Millions | |
| Recent Price: 11.55 Smart Investing & Trading Score: 49 | |
| Day Percent Change: 0.17% Day Change: 0.02 | |
| Week Change: -5.17% Year-to-date Change: 9.4% | |
| TSQ Links: Profile News Message Board | |
| Charts:- Daily , Weekly | |
| Add TSQ to Watchlist: View: Get Complete TSQ Trend Analysis ➞ | |
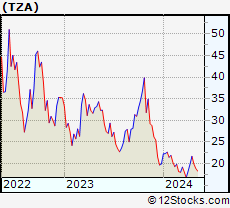 | TZA Direxion Daily Small Cap Bear 3X ETF |
| Sector: Utilities | |
| SubSector: Exchange Traded Fund | |
| MarketCap: 0 Millions | |
| Recent Price: 17.35 Smart Investing & Trading Score: 17 | |
| Day Percent Change: -0.17% Day Change: -0.03 | |
| Week Change: -5.29% Year-to-date Change: -13.0% | |
| TZA Links: Profile News Message Board | |
| Charts:- Daily , Weekly | |
| Add TZA to Watchlist: View: Get Complete TZA Trend Analysis ➞ | |
 | PRTH Priority Technology Holdings, Inc. |
| Sector: Industrials | |
| SubSector: Conglomerates | |
| MarketCap: 116.548 Millions | |
| Recent Price: 3.44 Smart Investing & Trading Score: 68 | |
| Day Percent Change: -0.29% Day Change: -0.01 | |
| Week Change: -5.49% Year-to-date Change: -3.4% | |
| PRTH Links: Profile News Message Board | |
| Charts:- Daily , Weekly | |
| Add PRTH to Watchlist: View: Get Complete PRTH Trend Analysis ➞ | |
 | BH Biglari Holdings Inc. |
| Sector: Services & Goods | |
| SubSector: Restaurants | |
| MarketCap: 149.07 Millions | |
| Recent Price: 200.00 Smart Investing & Trading Score: 43 | |
| Day Percent Change: -7.32% Day Change: -15.80 | |
| Week Change: -5.66% Year-to-date Change: 21.3% | |
| BH Links: Profile News Message Board | |
| Charts:- Daily , Weekly | |
| Add BH to Watchlist: View: Get Complete BH Trend Analysis ➞ | |
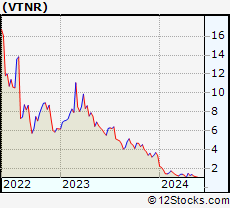 | VTNR Vertex Energy, Inc. |
| Sector: Industrials | |
| SubSector: Waste Management | |
| MarketCap: 29.7988 Millions | |
| Recent Price: 1.14 Smart Investing & Trading Score: 32 | |
| Day Percent Change: 0.44% Day Change: 0.01 | |
| Week Change: -5.81% Year-to-date Change: -66.5% | |
| VTNR Links: Profile News Message Board | |
| Charts:- Daily , Weekly | |
| Add VTNR to Watchlist: View: Get Complete VTNR Trend Analysis ➞ | |
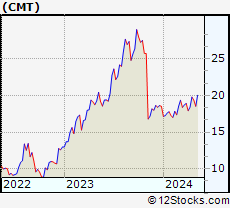 | CMT Core Molding Technologies, Inc. |
| Sector: Materials | |
| SubSector: Specialty Chemicals | |
| MarketCap: 13.4357 Millions | |
| Recent Price: 18.85 Smart Investing & Trading Score: 43 | |
| Day Percent Change: -6.36% Day Change: -1.28 | |
| Week Change: -5.99% Year-to-date Change: 1.7% | |
| CMT Links: Profile News Message Board | |
| Charts:- Daily , Weekly | |
| Add CMT to Watchlist: View: Get Complete CMT Trend Analysis ➞ | |
 | CVGI Commercial Vehicle Group, Inc. |
| Sector: Services & Goods | |
| SubSector: Auto Parts Wholesale | |
| MarketCap: 56.6 Millions | |
| Recent Price: 5.28 Smart Investing & Trading Score: 25 | |
| Day Percent Change: -1.49% Day Change: -0.08 | |
| Week Change: -6.22% Year-to-date Change: -24.7% | |
| CVGI Links: Profile News Message Board | |
| Charts:- Daily , Weekly | |
| Add CVGI to Watchlist: View: Get Complete CVGI Trend Analysis ➞ | |
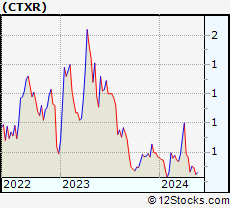 | CTXR Citius Pharmaceuticals, Inc. |
| Sector: Health Care | |
| SubSector: Biotechnology | |
| MarketCap: 17.5785 Millions | |
| Recent Price: 0.65 Smart Investing & Trading Score: 7 | |
| Day Percent Change: -2.86% Day Change: -0.02 | |
| Week Change: -6.66% Year-to-date Change: -15.7% | |
| CTXR Links: Profile News Message Board | |
| Charts:- Daily , Weekly | |
| Add CTXR to Watchlist: View: Get Complete CTXR Trend Analysis ➞ | |
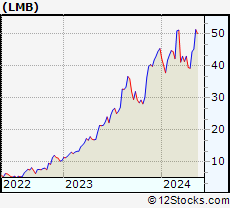 | LMB Limbach Holdings, Inc. |
| Sector: Industrials | |
| SubSector: Heavy Construction | |
| MarketCap: 27.3395 Millions | |
| Recent Price: 47.75 Smart Investing & Trading Score: 32 | |
| Day Percent Change: -1.26% Day Change: -0.61 | |
| Week Change: -7.08% Year-to-date Change: 5.0% | |
| LMB Links: Profile News Message Board | |
| Charts:- Daily , Weekly | |
| Add LMB to Watchlist: View: Get Complete LMB Trend Analysis ➞ | |
 | LCTX Lineage Cell Therapeutics, Inc. |
| Sector: Health Care | |
| SubSector: Biotechnology | |
| MarketCap: 141.285 Millions | |
| Recent Price: 1.08 Smart Investing & Trading Score: 41 | |
| Day Percent Change: 1.89% Day Change: 0.02 | |
| Week Change: -7.69% Year-to-date Change: -0.9% | |
| LCTX Links: Profile News Message Board | |
| Charts:- Daily , Weekly | |
| Add LCTX to Watchlist: View: Get Complete LCTX Trend Analysis ➞ | |
 | NL NL Industries, Inc. |
| Sector: Services & Goods | |
| SubSector: Industrial Equipment Wholesale | |
| MarketCap: 126.258 Millions | |
| Recent Price: 7.27 Smart Investing & Trading Score: 68 | |
| Day Percent Change: 4.01% Day Change: 0.28 | |
| Week Change: -7.74% Year-to-date Change: 29.6% | |
| NL Links: Profile News Message Board | |
| Charts:- Daily , Weekly | |
| Add NL to Watchlist: View: Get Complete NL Trend Analysis ➞ | |
 | MG Mistras Group, Inc. |
| Sector: Services & Goods | |
| SubSector: Security & Protection Services | |
| MarketCap: 136.903 Millions | |
| Recent Price: 8.38 Smart Investing & Trading Score: 17 | |
| Day Percent Change: 0.48% Day Change: 0.04 | |
| Week Change: -8.42% Year-to-date Change: 14.5% | |
| MG Links: Profile News Message Board | |
| Charts:- Daily , Weekly | |
| Add MG to Watchlist: View: Get Complete MG Trend Analysis ➞ | |
 | INFU InfuSystem Holdings Inc. |
| Sector: Health Care | |
| SubSector: Medical Instruments & Supplies | |
| MarketCap: 136.76 Millions | |
| Recent Price: 6.51 Smart Investing & Trading Score: 0 | |
| Day Percent Change: -4.62% Day Change: -0.32 | |
| Week Change: -10.58% Year-to-date Change: -38.2% | |
| INFU Links: Profile News Message Board | |
| Charts:- Daily , Weekly | |
| Add INFU to Watchlist: View: Get Complete INFU Trend Analysis ➞ | |
 | DZSI DASAN Zhone Solutions, Inc. |
| Sector: Technology | |
| SubSector: Communication Equipment | |
| MarketCap: 90.0539 Millions | |
| Recent Price: 1.52 Smart Investing & Trading Score: 76 | |
| Day Percent Change: 0.00% Day Change: 0.00 | |
| Week Change: -10.59% Year-to-date Change: -22.8% | |
| DZSI Links: Profile News Message Board | |
| Charts:- Daily , Weekly | |
| Add DZSI to Watchlist: View: Get Complete DZSI Trend Analysis ➞ | |
 | GRWG GrowGeneration Corp. |
| Sector: Materials | |
| SubSector: Agricultural Chemicals | |
| MarketCap: 118.429 Millions | |
| Recent Price: 2.61 Smart Investing & Trading Score: 46 | |
| Day Percent Change: -9.69% Day Change: -0.28 | |
| Week Change: -10.62% Year-to-date Change: 4.0% | |
| GRWG Links: Profile News Message Board | |
| Charts:- Daily , Weekly | |
| Add GRWG to Watchlist: View: Get Complete GRWG Trend Analysis ➞ | |
 | RRGB Red Robin Gourmet Burgers, Inc. |
| Sector: Services & Goods | |
| SubSector: Restaurants | |
| MarketCap: 121.57 Millions | |
| Recent Price: 6.76 Smart Investing & Trading Score: 10 | |
| Day Percent Change: -4.52% Day Change: -0.32 | |
| Week Change: -11.05% Year-to-date Change: -45.8% | |
| RRGB Links: Profile News Message Board | |
| Charts:- Daily , Weekly | |
| Add RRGB to Watchlist: View: Get Complete RRGB Trend Analysis ➞ | |
 | XFOR X4 Pharmaceuticals, Inc. |
| Sector: Health Care | |
| SubSector: Biotechnology | |
| MarketCap: 143.385 Millions | |
| Recent Price: 0.93 Smart Investing & Trading Score: 10 | |
| Day Percent Change: -3.26% Day Change: -0.03 | |
| Week Change: -11.58% Year-to-date Change: 10.7% | |
| XFOR Links: Profile News Message Board | |
| Charts:- Daily , Weekly | |
| Add XFOR to Watchlist: View: Get Complete XFOR Trend Analysis ➞ | |
 | ATLC Atlanticus Holdings Corporation |
| Sector: Financials | |
| SubSector: Credit Services | |
| MarketCap: 122.008 Millions | |
| Recent Price: 24.89 Smart Investing & Trading Score: 7 | |
| Day Percent Change: 3.69% Day Change: 0.89 | |
| Week Change: -13.92% Year-to-date Change: -35.7% | |
| ATLC Links: Profile News Message Board | |
| Charts:- Daily , Weekly | |
| Add ATLC to Watchlist: View: Get Complete ATLC Trend Analysis ➞ | |
 | FENC Fennec Pharmaceuticals Inc. |
| Sector: Health Care | |
| SubSector: Biotechnology | |
| MarketCap: 126.785 Millions | |
| Recent Price: 7.04 Smart Investing & Trading Score: 0 | |
| Day Percent Change: -1.12% Day Change: -0.08 | |
| Week Change: -27.79% Year-to-date Change: -37.3% | |
| FENC Links: Profile News Message Board | |
| Charts:- Daily , Weekly | |
| Add FENC to Watchlist: View: Get Complete FENC Trend Analysis ➞ | |
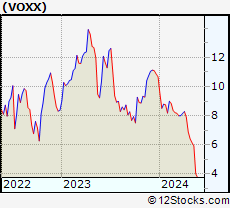 | VOXX VOXX International Corporation |
| Sector: Consumer Staples | |
| SubSector: Auto Parts | |
| MarketCap: 46.0939 Millions | |
| Recent Price: 4.00 Smart Investing & Trading Score: 7 | |
| Day Percent Change: 0.25% Day Change: 0.01 | |
| Week Change: -32.66% Year-to-date Change: -62.6% | |
| VOXX Links: Profile News Message Board | |
| Charts:- Daily , Weekly | |
| Add VOXX to Watchlist: View: Get Complete VOXX Trend Analysis ➞ | |
| For tabular summary view of above stock list: Summary View ➞ 0 - 25 , 25 - 50 , 50 - 75 , 75 - 100 , 100 - 125 , 125 - 150 , 150 - 175 , 175 - 200 | ||
| Click To Change The Sort Order: By Market Cap or Company Size Performance: Year-to-date, Week and Day | |
| Select Chart Type: | ||
| Too many stocks? View smallcap stocks filtered by marketcap & sector |
| Marketcap: All SmallCap Stocks (default-no microcap), Large, Mid-Range, Small & MicroCap |
| Sector: Tech, Finance, Energy, Staples, Retail, Industrial, Materials, Utilities & Medical |
|
Best Stocks Today 12Stocks.com |
© 2024 12Stocks.com Terms & Conditions Privacy Contact Us
All Information Provided Only For Education And Not To Be Used For Investing or Trading. See Terms & Conditions


One More Thing ... Get Best Stocks Delivered Daily!
Never Ever Miss A Move With Our Top Ten Stocks Lists
Find Best Stocks In Any Market - Bull or Bear Market
Take A Peek At Our Top Ten Stocks Lists: Daily, Weekly, Year-to-Date & Top Trends
Find Best Stocks In Any Market - Bull or Bear Market
Take A Peek At Our Top Ten Stocks Lists: Daily, Weekly, Year-to-Date & Top Trends
Smallcap Stocks With Best Up Trends [0-bearish to 100-bullish]: CommScope Holding[100], Coeur Mining[100], Hecla Mining[100], MicroStrategy [100], Enovix [100], Rayonier Advanced[100], Nurix [100], Energy Fuels[100], NovaGold Resources[100], Piedmont Lithium[100], Wave Life[100]
Best Smallcap Stocks Year-to-Date:
CareMax [495.88%], Bakkt [413.9%], Janux [338.34%], Viking [260.02%], Alpine Immune[241.23%], Longboard [238.63%], Avidity Biosciences[226.33%], Super Micro[212.35%], Arcutis Bio[184.83%], Sweetgreen [180.97%], Novavax [171.04%] Best Smallcap Stocks This Week:
Vaxxinity [58.82%], Novavax [46.51%], Vicarious Surgical[45.62%], Harrow Health[44.48%], ProKidney [44.31%], Workhorse Group[36.06%], Maxeon Solar[35.94%], Fossil Group[35.44%], Humacyte [34.68%], MicroStrategy [34.23%], Cadiz [33.48%] Best Smallcap Stocks Daily:
Vaxxinity [45.95%], Presto Automation[31.90%], Vicarious Surgical[27.93%], Orchestra BioMed[12.77%], CommScope Holding[11.86%], Coeur Mining[11.57%], Hecla Mining[11.11%], MicroStrategy [10.04%], Tenaya [9.65%], Bakkt [9.25%], Enovix [9.25%]