
 Login Sign Up


| |||||
 |  | ||||

| 12Stocks.com Market Intelligence |
Best SmallCap Stocks
|
| In a hurry? Small Cap Stock Lists: Performance Trends Table, Stock Charts
Sort Small Cap stocks: Daily, Weekly, Year-to-Date, Market Cap & Trends. Filter Small Cap stocks list by sector: Show all, Tech, Finance, Energy, Staples, Retail, Industrial, Materials, Utilities and HealthCare Filter Small Cap stocks list by size: All Large Medium Small and MicroCap |
| 12Stocks.com Small Cap Stocks Performances & Trends Daily | |||||||||
|
|  The overall Smart Investing & Trading Score is 76 (0-bearish to 100-bullish) which puts Small Cap index in short term neutral to bullish trend. The Smart Investing & Trading Score from previous trading session is 90 and hence a deterioration of trend.
| ||||||||
Here are the Smart Investing & Trading Scores of the most requested small cap stocks at 12Stocks.com (click stock name for detailed review):
|


| 12Stocks.com: Investing in Smallcap Index with Stocks | |
|
The following table helps investors and traders sort through current performance and trends (as measured by Smart Investing & Trading Score) of various
stocks in the Smallcap Index. Quick View: Move mouse or cursor over stock symbol (ticker) to view short-term technical chart and over stock name to view long term chart. Click on  to add stock symbol to your watchlist and to add stock symbol to your watchlist and  to view watchlist. Click on any ticker or stock name for detailed market intelligence report for that stock. to view watchlist. Click on any ticker or stock name for detailed market intelligence report for that stock. |
12Stocks.com Performance of Stocks in Smallcap Index
| Ticker | Stock Name | Watchlist | Category | Recent Price | Smart Investing & Trading Score | Change % | Weekly Change% |
| TLYS | Tilly s |   | Services & Goods | 6.07 | 32 | -2.57% | 0.50% |
| INTT | inTEST | | Technology | 10.12 | 18 | -3.53% | 0.40% |
| SMLR | Semler Scientific | | Health Care | 23.01 | 46 | -5.07% | 0.39% |
| CHMG | Chemung Financial | | Financials | 43.41 | 66 | -0.21% | 0.25% |
| CRMD | CorMedix | | Health Care | 5.18 | 46 | -0.58% | 0.19% |
| EGY | VAALCO Energy | | Energy | 6.21 | 54 | -0.88% | 0.16% |
| MACK | Merrimack | | Health Care | 15.13 | 55 | 0.00% | 0.07% |
| HEAR | Turtle Beach | | Technology | 15.99 | 58 | -0.90% | 0.06% |
| ALPN | Alpine Immune | | Health Care | 64.97 | 75 | 0.02% | 0.05% |
| MHLD | Maiden | | Financials | 2.20 | 65 | 0.00% | 0.00% |
| SLCA | U.S. Silica | | Materials | 15.52 | 43 | 0.06% | 0.00% |
| PSTL | Postal Realty | | Financials | 13.73 | 28 | -0.44% | -0.22% |
| LYTS | LSI Industries | | Industrials | 15.85 | 76 | 0.38% | -0.25% |
| CLPR | Clipper Realty | | Financials | 4.00 | 28 | 0.50% | -0.25% |
| PNRG | PrimeEnergy Resources | | Energy | 103.70 | 58 | -0.81% | -0.33% |
| KRUS | Kura Sushi | | Services & Goods | 111.46 | 61 | -3.98% | -0.39% |
| CELC | Celcuity | | Health Care | 16.76 | 49 | -5.10% | -0.42% |
| SM | SM Energy | | Energy | 48.95 | 46 | 1.03% | -0.43% |
| RICK | RCI Hospitality | | Services & Goods | 47.91 | 35 | -0.88% | -0.45% |
| CMBM | Cambium s | | Technology | 3.56 | 10 | -1.11% | -0.56% |
| PDSB | PDS | | Health Care | 3.49 | 32 | -1.13% | -0.57% |
| KFS | Kingsway Financial | | Financials | 7.95 | 10 | -0.50% | -0.63% |
| DHX | DHI Group | | Services & Goods | 2.45 | 10 | -1.21% | -0.81% |
| RM | Regional Management | | Financials | 29.75 | 75 | -0.17% | -0.83% |
| ESCA | Escalade | | Consumer Staples | 13.49 | 17 | -1.32% | -0.88% |
| For chart view version of above stock list: Chart View ➞ 0 - 25 , 25 - 50 , 50 - 75 , 75 - 100 , 100 - 125 , 125 - 150 , 150 - 175 , 175 - 200 | ||
 | Click To Change The Sort Order: By Market Cap or Company Size Performance: Year-to-date, Week and Day |  |
| Too many stocks? View smallcap stocks filtered by marketcap & sector |
| Marketcap: All SmallCap Stocks (default-no microcap), Large, Mid-Range, Small |
| Smallcap Sector: Tech, Finance, Energy, Staples, Retail, Industrial, Materials, & Medical |
|
Get the most comprehensive stock market coverage daily at 12Stocks.com ➞ Best Stocks Today ➞ Best Stocks Weekly ➞ Best Stocks Year-to-Date ➞ Best Stocks Trends ➞  Best Stocks Today 12Stocks.com Best Nasdaq Stocks ➞ Best S&P 500 Stocks ➞ Best Tech Stocks ➞ Best Biotech Stocks ➞ |
| Detailed Overview of SmallCap Stocks |
| SmallCap Technical Overview, Leaders & Laggards, Top SmallCap ETF Funds & Detailed SmallCap Stocks List, Charts, Trends & More |
| Smallcap: Technical Analysis, Trends & YTD Performance | |
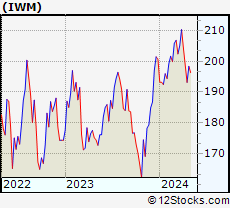
| SmallCap segment as represented by
IWM, an exchange-traded fund [ETF], holds basket of thousands of smallcap stocks from across all major sectors of the US stock market. The smallcap index (contains stocks like Riverbed & Sotheby's) is up by 3.67% and is currently underperforming the overall market by -6.9% year-to-date. Below is a quick view of technical charts and trends: | |
 IWM Weekly Chart |
|
| Long Term Trend: Very Good | |
| Medium Term Trend: Very Good | |
 IWM Daily Chart |
|
| Short Term Trend: Good | |
| Overall Trend Score: 76 | |
| YTD Performance: 3.67% | |
| **Trend Scores & Views Are Only For Educational Purposes And Not For Investing | |
| 12Stocks.com: Top Performing Small Cap Index Stocks | ||||||||||||||||||||||||||||||||||||||||||||||||
 The top performing Small Cap Index stocks year to date are
Now, more recently, over last week, the top performing Small Cap Index stocks on the move are


|
||||||||||||||||||||||||||||||||||||||||||||||||
| 12Stocks.com: Investing in Smallcap Index using Exchange Traded Funds | |
|
The following table shows list of key exchange traded funds (ETF) that
help investors track Smallcap index. The following list also includes leveraged ETF funds that track twice or thrice the daily returns of Smallcap indices. Short or inverse ETF funds move in the opposite direction to the index they track and are useful during market pullbacks or during bear markets. Quick View: Move mouse or cursor over ETF symbol (ticker) to view short-term technical chart and over ETF name to view long term chart. Click on ticker or stock name for detailed view. Click on to add stock symbol to your watchlist and to view watchlist. |
12Stocks.com List of ETFs that track Smallcap Index
| Ticker | ETF Name | Watchlist | Recent Price | Smart Investing & Trading Score | Change % | Week % | Year-to-date % |
| IWM | iShares Russell 2000 | | 208.08 | 76 | 0.07 | 1.85 | 3.67% |
| VTWO | Vanguard Russell 2000 ETF | | 84.11 | 71 | 0.00 | 1.8 | 3.71% |
| IJR | iShares Core S&P Small-Cap | | 110.39 | 68 | -0.22 | 1.29 | 1.98% |
| IWN | iShares Russell 2000 Value | | 158.71 | 76 | -0.07 | 1.61 | 2.18% |
| IWO | iShares Russell 2000 Growth | | 265.15 | 63 | -0.75 | 2.01 | 5.13% |
| IJS | iShares S&P Small-Cap 600 Value | | 101.87 | 76 | -0.15 | 1.34 | -1.16% |
| IJT | iShares S&P Small-Cap 600 Growth | | 131.34 | 71 | 0.04 | 1.14 | 4.95% |
| XSLV | PowerShares S&P SmallCap Low Volatil ETF | | 44.48 | 83 | -0.01 | 0.55 | 0.74% |
| SAA | ProShares Ultra SmallCap600 | | 24.90 | 71 | 0.50 | 2.28 | -0.18% |
| SMLV | SPDR SSGA US Small Cap Low Volatil ETF | | 113.28 | 95 | 0.43 | 1.85 | 0.68% |
| SDD | ProShares UltraShort SmallCap600 | | 17.84 | 35 | 0.96 | -2.41 | -3.19% |
| SBB | ProShares Short SmallCap600 | | 15.77 | 25 | 0.41 | -1.14 | -0.98% |
| 12Stocks.com: Charts, Trends, Fundamental Data and Performances of SmallCap Stocks | |
|
We now take in-depth look at all SmallCap stocks including charts, multi-period performances and overall trends (as measured by Smart Investing & Trading Score). One can sort SmallCap stocks (click link to choose) by Daily, Weekly and by Year-to-Date performances. Also, one can sort by size of the company or by market capitalization. |
| Select Your Default Chart Type: | |||||
| |||||
| Click on stock symbol or name for detailed view. Click on to add stock symbol to your watchlist and to view watchlist. Quick View: Move mouse or cursor over "Daily" to quickly view daily technical stock chart and over "Weekly" to view weekly technical stock chart. | |||||

 | TLYS Tilly s, Inc. |
| Sector: Services & Goods | |
| SubSector: Apparel Stores | |
| MarketCap: 127.408 Millions | |
| Recent Price: 6.07 Smart Investing & Trading Score: 32 | |
| Day Percent Change: -2.57% Day Change: -0.16 | |
| Week Change: 0.5% Year-to-date Change: -19.5% | |
| TLYS Links: Profile News Message Board | |
| Charts:- Daily , Weekly | |
| Add TLYS to Watchlist: View: Get Complete TLYS Trend Analysis ➞ | |
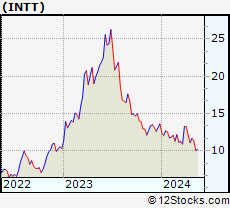 | INTT inTEST Corporation |
| Sector: Technology | |
| SubSector: Semiconductor - Integrated Circuits | |
| MarketCap: 27.251 Millions | |
| Recent Price: 10.12 Smart Investing & Trading Score: 18 | |
| Day Percent Change: -3.53% Day Change: -0.37 | |
| Week Change: 0.4% Year-to-date Change: -25.6% | |
| INTT Links: Profile News Message Board | |
| Charts:- Daily , Weekly | |
| Add INTT to Watchlist: View: Get Complete INTT Trend Analysis ➞ | |
 | SMLR Semler Scientific, Inc. |
| Sector: Health Care | |
| SubSector: Medical Appliances & Equipment | |
| MarketCap: 16.14 Millions | |
| Recent Price: 23.01 Smart Investing & Trading Score: 46 | |
| Day Percent Change: -5.07% Day Change: -1.23 | |
| Week Change: 0.39% Year-to-date Change: -48.1% | |
| SMLR Links: Profile News Message Board | |
| Charts:- Daily , Weekly | |
| Add SMLR to Watchlist: View: Get Complete SMLR Trend Analysis ➞ | |
 | CHMG Chemung Financial Corporation |
| Sector: Financials | |
| SubSector: Regional - Pacific Banks | |
| MarketCap: 142.229 Millions | |
| Recent Price: 43.41 Smart Investing & Trading Score: 66 | |
| Day Percent Change: -0.21% Day Change: -0.09 | |
| Week Change: 0.25% Year-to-date Change: -12.8% | |
| CHMG Links: Profile News Message Board | |
| Charts:- Daily , Weekly | |
| Add CHMG to Watchlist: View: Get Complete CHMG Trend Analysis ➞ | |
 | CRMD CorMedix, Inc. |
| Sector: Health Care | |
| SubSector: Biotechnology | |
| MarketCap: 90.7785 Millions | |
| Recent Price: 5.18 Smart Investing & Trading Score: 46 | |
| Day Percent Change: -0.58% Day Change: -0.03 | |
| Week Change: 0.19% Year-to-date Change: 37.8% | |
| CRMD Links: Profile News Message Board | |
| Charts:- Daily , Weekly | |
| Add CRMD to Watchlist: View: Get Complete CRMD Trend Analysis ➞ | |
 | EGY VAALCO Energy, Inc. |
| Sector: Energy | |
| SubSector: Independent Oil & Gas | |
| MarketCap: 59.5593 Millions | |
| Recent Price: 6.21 Smart Investing & Trading Score: 54 | |
| Day Percent Change: -0.88% Day Change: -0.05 | |
| Week Change: 0.16% Year-to-date Change: 38.3% | |
| EGY Links: Profile News Message Board | |
| Charts:- Daily , Weekly | |
| Add EGY to Watchlist: View: Get Complete EGY Trend Analysis ➞ | |
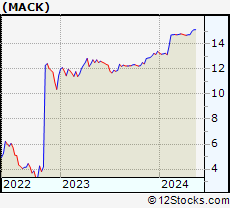 | MACK Merrimack Pharmaceuticals, Inc. |
| Sector: Health Care | |
| SubSector: Biotechnology | |
| MarketCap: 23.4785 Millions | |
| Recent Price: 15.13 Smart Investing & Trading Score: 55 | |
| Day Percent Change: 0.00% Day Change: 0.00 | |
| Week Change: 0.07% Year-to-date Change: 12.8% | |
| MACK Links: Profile News Message Board | |
| Charts:- Daily , Weekly | |
| Add MACK to Watchlist: View: Get Complete MACK Trend Analysis ➞ | |
 | HEAR Turtle Beach Corporation |
| Sector: Technology | |
| SubSector: Communication Equipment | |
| MarketCap: 73.0539 Millions | |
| Recent Price: 15.99 Smart Investing & Trading Score: 58 | |
| Day Percent Change: -0.90% Day Change: -0.15 | |
| Week Change: 0.06% Year-to-date Change: 46.0% | |
| HEAR Links: Profile News Message Board | |
| Charts:- Daily , Weekly | |
| Add HEAR to Watchlist: View: Get Complete HEAR Trend Analysis ➞ | |
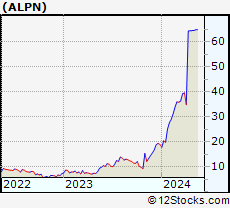 | ALPN Alpine Immune Sciences, Inc. |
| Sector: Health Care | |
| SubSector: Biotechnology | |
| MarketCap: 43.0785 Millions | |
| Recent Price: 64.97 Smart Investing & Trading Score: 75 | |
| Day Percent Change: 0.02% Day Change: 0.01 | |
| Week Change: 0.05% Year-to-date Change: 241.2% | |
| ALPN Links: Profile News Message Board | |
| Charts:- Daily , Weekly | |
| Add ALPN to Watchlist: View: Get Complete ALPN Trend Analysis ➞ | |
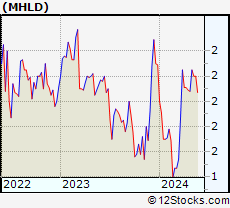 | MHLD Maiden Holdings, Ltd. |
| Sector: Financials | |
| SubSector: Property & Casualty Insurance | |
| MarketCap: 43.5812 Millions | |
| Recent Price: 2.20 Smart Investing & Trading Score: 65 | |
| Day Percent Change: 0.00% Day Change: 0.00 | |
| Week Change: 0% Year-to-date Change: -3.9% | |
| MHLD Links: Profile News Message Board | |
| Charts:- Daily , Weekly | |
| Add MHLD to Watchlist: View: Get Complete MHLD Trend Analysis ➞ | |
 | SLCA U.S. Silica Holdings, Inc. |
| Sector: Materials | |
| SubSector: Industrial Metals & Minerals | |
| MarketCap: 93 Millions | |
| Recent Price: 15.52 Smart Investing & Trading Score: 43 | |
| Day Percent Change: 0.06% Day Change: 0.01 | |
| Week Change: 0% Year-to-date Change: 37.2% | |
| SLCA Links: Profile News Message Board | |
| Charts:- Daily , Weekly | |
| Add SLCA to Watchlist: View: Get Complete SLCA Trend Analysis ➞ | |
 | PSTL Postal Realty Trust, Inc. |
| Sector: Financials | |
| SubSector: REIT - Office | |
| MarketCap: 82.9866 Millions | |
| Recent Price: 13.73 Smart Investing & Trading Score: 28 | |
| Day Percent Change: -0.44% Day Change: -0.06 | |
| Week Change: -0.22% Year-to-date Change: -5.7% | |
| PSTL Links: Profile News Message Board | |
| Charts:- Daily , Weekly | |
| Add PSTL to Watchlist: View: Get Complete PSTL Trend Analysis ➞ | |
 | LYTS LSI Industries Inc. |
| Sector: Industrials | |
| SubSector: Industrial Electrical Equipment | |
| MarketCap: 85.7879 Millions | |
| Recent Price: 15.85 Smart Investing & Trading Score: 76 | |
| Day Percent Change: 0.38% Day Change: 0.06 | |
| Week Change: -0.25% Year-to-date Change: 12.6% | |
| LYTS Links: Profile News Message Board | |
| Charts:- Daily , Weekly | |
| Add LYTS to Watchlist: View: Get Complete LYTS Trend Analysis ➞ | |
 | CLPR Clipper Realty Inc. |
| Sector: Financials | |
| SubSector: REIT - Diversified | |
| MarketCap: 113.253 Millions | |
| Recent Price: 4.00 Smart Investing & Trading Score: 28 | |
| Day Percent Change: 0.50% Day Change: 0.02 | |
| Week Change: -0.25% Year-to-date Change: -25.9% | |
| CLPR Links: Profile News Message Board | |
| Charts:- Daily , Weekly | |
| Add CLPR to Watchlist: View: Get Complete CLPR Trend Analysis ➞ | |
 | PNRG PrimeEnergy Resources Corporation |
| Sector: Energy | |
| SubSector: Independent Oil & Gas | |
| MarketCap: 112.593 Millions | |
| Recent Price: 103.70 Smart Investing & Trading Score: 58 | |
| Day Percent Change: -0.81% Day Change: -0.85 | |
| Week Change: -0.33% Year-to-date Change: -2.5% | |
| PNRG Links: Profile News Message Board | |
| Charts:- Daily , Weekly | |
| Add PNRG to Watchlist: View: Get Complete PNRG Trend Analysis ➞ | |
 | KRUS Kura Sushi USA, Inc. |
| Sector: Services & Goods | |
| SubSector: Restaurants | |
| MarketCap: 74.057 Millions | |
| Recent Price: 111.46 Smart Investing & Trading Score: 61 | |
| Day Percent Change: -3.98% Day Change: -4.62 | |
| Week Change: -0.39% Year-to-date Change: 46.5% | |
| KRUS Links: Profile News Message Board | |
| Charts:- Daily , Weekly | |
| Add KRUS to Watchlist: View: Get Complete KRUS Trend Analysis ➞ | |
 | CELC Celcuity Inc. |
| Sector: Health Care | |
| SubSector: Medical Laboratories & Research | |
| MarketCap: 70.53 Millions | |
| Recent Price: 16.76 Smart Investing & Trading Score: 49 | |
| Day Percent Change: -5.10% Day Change: -0.90 | |
| Week Change: -0.42% Year-to-date Change: 14.3% | |
| CELC Links: Profile News Message Board | |
| Charts:- Daily , Weekly | |
| Add CELC to Watchlist: View: Get Complete CELC Trend Analysis ➞ | |
 | SM SM Energy Company |
| Sector: Energy | |
| SubSector: Independent Oil & Gas | |
| MarketCap: 137.593 Millions | |
| Recent Price: 48.95 Smart Investing & Trading Score: 46 | |
| Day Percent Change: 1.03% Day Change: 0.50 | |
| Week Change: -0.43% Year-to-date Change: 26.4% | |
| SM Links: Profile News Message Board | |
| Charts:- Daily , Weekly | |
| Add SM to Watchlist: View: Get Complete SM Trend Analysis ➞ | |
 | RICK RCI Hospitality Holdings, Inc. |
| Sector: Services & Goods | |
| SubSector: Restaurants | |
| MarketCap: 93 Millions | |
| Recent Price: 47.91 Smart Investing & Trading Score: 35 | |
| Day Percent Change: -0.88% Day Change: -0.42 | |
| Week Change: -0.45% Year-to-date Change: -27.7% | |
| RICK Links: Profile News Message Board | |
| Charts:- Daily , Weekly | |
| Add RICK to Watchlist: View: Get Complete RICK Trend Analysis ➞ | |
 | CMBM Cambium Networks Corporation |
| Sector: Technology | |
| SubSector: Communication Equipment | |
| MarketCap: 143.739 Millions | |
| Recent Price: 3.56 Smart Investing & Trading Score: 10 | |
| Day Percent Change: -1.11% Day Change: -0.04 | |
| Week Change: -0.56% Year-to-date Change: -40.7% | |
| CMBM Links: Profile News Message Board | |
| Charts:- Daily , Weekly | |
| Add CMBM to Watchlist: View: Get Complete CMBM Trend Analysis ➞ | |
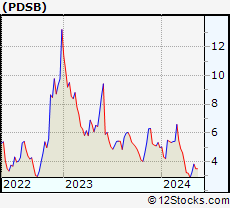 | PDSB PDS Biotechnology Corporation |
| Sector: Health Care | |
| SubSector: Biotechnology | |
| MarketCap: 9.72785 Millions | |
| Recent Price: 3.49 Smart Investing & Trading Score: 32 | |
| Day Percent Change: -1.13% Day Change: -0.04 | |
| Week Change: -0.57% Year-to-date Change: -30.0% | |
| PDSB Links: Profile News Message Board | |
| Charts:- Daily , Weekly | |
| Add PDSB to Watchlist: View: Get Complete PDSB Trend Analysis ➞ | |
 | KFS Kingsway Financial Services Inc. |
| Sector: Financials | |
| SubSector: Property & Casualty Insurance | |
| MarketCap: 47.5812 Millions | |
| Recent Price: 7.95 Smart Investing & Trading Score: 10 | |
| Day Percent Change: -0.50% Day Change: -0.04 | |
| Week Change: -0.63% Year-to-date Change: -5.4% | |
| KFS Links: Profile News Message Board | |
| Charts:- Daily , Weekly | |
| Add KFS to Watchlist: View: Get Complete KFS Trend Analysis ➞ | |
 | DHX DHI Group, Inc. |
| Sector: Services & Goods | |
| SubSector: Staffing & Outsourcing Services | |
| MarketCap: 144.728 Millions | |
| Recent Price: 2.45 Smart Investing & Trading Score: 10 | |
| Day Percent Change: -1.21% Day Change: -0.03 | |
| Week Change: -0.81% Year-to-date Change: -5.4% | |
| DHX Links: Profile News Message Board | |
| Charts:- Daily , Weekly | |
| Add DHX to Watchlist: View: Get Complete DHX Trend Analysis ➞ | |
 | RM Regional Management Corp. |
| Sector: Financials | |
| SubSector: Credit Services | |
| MarketCap: 148.008 Millions | |
| Recent Price: 29.75 Smart Investing & Trading Score: 75 | |
| Day Percent Change: -0.17% Day Change: -0.05 | |
| Week Change: -0.83% Year-to-date Change: 18.6% | |
| RM Links: Profile News Message Board | |
| Charts:- Daily , Weekly | |
| Add RM to Watchlist: View: Get Complete RM Trend Analysis ➞ | |
 | ESCA Escalade, Incorporated |
| Sector: Consumer Staples | |
| SubSector: Sporting Goods | |
| MarketCap: 87.8144 Millions | |
| Recent Price: 13.49 Smart Investing & Trading Score: 17 | |
| Day Percent Change: -1.32% Day Change: -0.18 | |
| Week Change: -0.88% Year-to-date Change: -32.9% | |
| ESCA Links: Profile News Message Board | |
| Charts:- Daily , Weekly | |
| Add ESCA to Watchlist: View: Get Complete ESCA Trend Analysis ➞ | |
| For tabular summary view of above stock list: Summary View ➞ 0 - 25 , 25 - 50 , 50 - 75 , 75 - 100 , 100 - 125 , 125 - 150 , 150 - 175 , 175 - 200 | ||
| Click To Change The Sort Order: By Market Cap or Company Size Performance: Year-to-date, Week and Day | |
| Select Chart Type: | ||
| Too many stocks? View smallcap stocks filtered by marketcap & sector |
| Marketcap: All SmallCap Stocks (default-no microcap), Large, Mid-Range, Small & MicroCap |
| Sector: Tech, Finance, Energy, Staples, Retail, Industrial, Materials, Utilities & Medical |
|
Best Stocks Today 12Stocks.com |
© 2024 12Stocks.com Terms & Conditions Privacy Contact Us
All Information Provided Only For Education And Not To Be Used For Investing or Trading. See Terms & Conditions


One More Thing ... Get Best Stocks Delivered Daily!
Never Ever Miss A Move With Our Top Ten Stocks Lists
Find Best Stocks In Any Market - Bull or Bear Market
Take A Peek At Our Top Ten Stocks Lists: Daily, Weekly, Year-to-Date & Top Trends
Find Best Stocks In Any Market - Bull or Bear Market
Take A Peek At Our Top Ten Stocks Lists: Daily, Weekly, Year-to-Date & Top Trends
Smallcap Stocks With Best Up Trends [0-bearish to 100-bullish]: CommScope Holding[100], Coeur Mining[100], Hecla Mining[100], MicroStrategy [100], Enovix [100], Rayonier Advanced[100], Nurix [100], Energy Fuels[100], NovaGold Resources[100], Piedmont Lithium[100], Wave Life[100]
Best Smallcap Stocks Year-to-Date:
CareMax [495.88%], Bakkt [413.9%], Janux [338.34%], Viking [260.02%], Alpine Immune[241.23%], Longboard [238.63%], Avidity Biosciences[226.33%], Super Micro[212.35%], Arcutis Bio[184.83%], Sweetgreen [180.97%], Novavax [171.04%] Best Smallcap Stocks This Week:
Vaxxinity [58.82%], Novavax [46.51%], Vicarious Surgical[45.62%], Harrow Health[44.48%], ProKidney [44.31%], Workhorse Group[36.06%], Maxeon Solar[35.94%], Fossil Group[35.44%], Humacyte [34.68%], MicroStrategy [34.23%], Cadiz [33.48%] Best Smallcap Stocks Daily:
Vaxxinity [45.95%], Presto Automation[31.90%], Vicarious Surgical[27.93%], Orchestra BioMed[12.77%], CommScope Holding[11.86%], Coeur Mining[11.57%], Hecla Mining[11.11%], MicroStrategy [10.04%], Tenaya [9.65%], Bakkt [9.25%], Enovix [9.25%]