
 Login Sign Up


| |||||
 |  | ||||

| 12Stocks.com Market Intelligence |
Best SmallCap Stocks
|
| In a hurry? Small Cap Stock Lists: Performance Trends Table, Stock Charts
Sort Small Cap stocks: Daily, Weekly, Year-to-Date, Market Cap & Trends. Filter Small Cap stocks list by sector: Show all, Tech, Finance, Energy, Staples, Retail, Industrial, Materials, Utilities and HealthCare Filter Small Cap stocks list by size: All Large Medium Small and MicroCap |
| 12Stocks.com Small Cap Stocks Performances & Trends Daily | |||||||||
|
|  The overall Smart Investing & Trading Score is 49 (0-bearish to 100-bullish) which puts Small Cap index in short term neutral trend. The Smart Investing & Trading Score from previous trading session is 14 and hence an improvement of trend.
| ||||||||
Here are the Smart Investing & Trading Scores of the most requested small cap stocks at 12Stocks.com (click stock name for detailed review):
|


| 12Stocks.com: Investing in Smallcap Index with Stocks | |
|
The following table helps investors and traders sort through current performance and trends (as measured by Smart Investing & Trading Score) of various
stocks in the Smallcap Index. Quick View: Move mouse or cursor over stock symbol (ticker) to view short-term technical chart and over stock name to view long term chart. Click on  to add stock symbol to your watchlist and to add stock symbol to your watchlist and  to view watchlist. Click on any ticker or stock name for detailed market intelligence report for that stock. to view watchlist. Click on any ticker or stock name for detailed market intelligence report for that stock. |
12Stocks.com Performance of Stocks in Smallcap Index
| Ticker | Stock Name | Watchlist | Category | Recent Price | Smart Investing & Trading Score | Change % | YTD Change% |
| NYMT | New York |   | Financials | 6.27 | 0 | -10.68% | -26.49% |
| AX | Axos Financial | | Financials | 57.29 | 100 | 3.23% | 4.93% |
| THRM | Gentherm | | Consumer Staples | 51.42 | 57 | -0.96% | -1.80% |
| IGT | Game | | Services & Goods | 19.92 | 30 | 0.10% | -27.33% |
| KRG | Kite Realty | | Financials | 21.39 | 76 | -0.14% | -6.43% |
| OLO | Olo | | Technology | 4.83 | 38 | -1.83% | -15.56% |
| JOE | St. Joe | | Financials | 57.80 | 68 | 1.47% | -3.95% |
| TTMI | TTM | | Technology | 16.63 | 100 | 12.59% | 5.19% |
| DLX | Deluxe | | Services & Goods | 21.57 | 95 | 8.45% | 0.56% |
| ODP | Office Depot | | Services & Goods | 50.86 | 37 | 0.02% | -9.66% |
| INVA | Innoviva | | Health Care | 15.37 | 39 | 0.89% | -4.21% |
| TGTX | TG | | Health Care | 16.41 | 74 | 3.34% | -3.92% |
| JELD | JELD-WEN Holding | | Industrials | 19.65 | 41 | -1.65% | 4.08% |
| CNXN | PC Connection | | Technology | 59.18 | 0 | -4.49% | -11.95% |
| MNTK | Montauk Renewables | | Utilities | 3.72 | 44 | 0.54% | -58.44% |
| RLJ | RLJ Lodging | | Financials | 10.70 | 0 | -2.37% | -8.70% |
| ATNI | ATN | | Technology | 20.99 | 32 | 4.12% | -46.14% |
| MRTN | Marten Transport | | Transports | 17.23 | 57 | 1.32% | -17.85% |
| INNV | InnovAge Holding | | Health Care | 3.78 | 45 | -3.69% | -33.68% |
| PRFT | Perficient | | Technology | 48.78 | 49 | 3.27% | -25.88% |
| MMI | Marcus & Millichap | | Financials | 32.56 | 49 | 3.46% | -25.46% |
| ADNT | Adient | | Consumer Staples | 30.22 | 49 | 2.65% | -16.89% |
| FWRG | First Watch | | Services & Goods | 25.32 | 90 | 1.48% | 27.04% |
| ENTA | Enanta | | Health Care | 13.88 | 49 | 2.36% | 47.50% |
| ADUS | Addus HomeCare | | Health Care | 98.33 | 75 | -0.08% | 5.90% |


| Too many stocks? View smallcap stocks filtered by marketcap & sector |
| Marketcap: All SmallCap Stocks (default-no microcap), Large, Mid-Range, Small |
| Smallcap Sector: Tech, Finance, Energy, Staples, Retail, Industrial, Materials, & Medical |
|
Get the most comprehensive stock market coverage daily at 12Stocks.com ➞ Best Stocks Today ➞ Best Stocks Weekly ➞ Best Stocks Year-to-Date ➞ Best Stocks Trends ➞  Best Stocks Today 12Stocks.com Best Nasdaq Stocks ➞ Best S&P 500 Stocks ➞ Best Tech Stocks ➞ Best Biotech Stocks ➞ |
| Detailed Overview of SmallCap Stocks |
| SmallCap Technical Overview, Leaders & Laggards, Top SmallCap ETF Funds & Detailed SmallCap Stocks List, Charts, Trends & More |
| Smallcap: Technical Analysis, Trends & YTD Performance | |
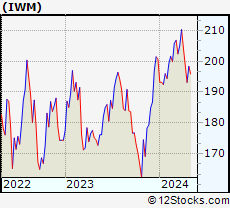
| SmallCap segment as represented by
IWM, an exchange-traded fund [ETF], holds basket of thousands of smallcap stocks from across all major sectors of the US stock market. The smallcap index (contains stocks like Riverbed & Sotheby's) is down by -0.39% and is currently underperforming the overall market by -6.01% year-to-date. Below is a quick view of technical charts and trends: | |
 IWM Weekly Chart |
|
| Long Term Trend: Not Good | |
| Medium Term Trend: Good | |
 IWM Daily Chart |
|
| Short Term Trend: Deteriorating | |
| Overall Trend Score: 49 | |
| YTD Performance: -0.39% | |
| **Trend Scores & Views Are Only For Educational Purposes And Not For Investing | |
| 12Stocks.com: Top Performing Small Cap Index Stocks | ||||||||||||||||||||||||||||||||||||||||||||||||
 The top performing Small Cap Index stocks year to date are
Now, more recently, over last week, the top performing Small Cap Index stocks on the move are


|
||||||||||||||||||||||||||||||||||||||||||||||||
| 12Stocks.com: Investing in Smallcap Index using Exchange Traded Funds | |
|
The following table shows list of key exchange traded funds (ETF) that
help investors track Smallcap index. The following list also includes leveraged ETF funds that track twice or thrice the daily returns of Smallcap indices. Short or inverse ETF funds move in the opposite direction to the index they track and are useful during market pullbacks or during bear markets. Quick View: Move mouse or cursor over ETF symbol (ticker) to view short-term technical chart and over ETF name to view long term chart. Click on ticker or stock name for detailed view. Click on to add stock symbol to your watchlist and to view watchlist. |
12Stocks.com List of ETFs that track Smallcap Index
| Ticker | ETF Name | Watchlist | Recent Price | Smart Investing & Trading Score | Change % | Week % | Year-to-date % |
| IWM | iShares Russell 2000 | | 199.92 | 49 | 1.84 | 0.77 | -0.39% |
| IJR | iShares Core S&P Small-Cap | | 106.33 | 50 | 1.52 | 0.64 | -1.77% |
| VTWO | Vanguard Russell 2000 ETF | | 80.83 | 7 | 1.85 | 0.76 | -0.33% |
| IWN | iShares Russell 2000 Value | | 152.88 | 57 | 2.04 | 1.15 | -1.58% |
| IWO | iShares Russell 2000 Growth | | 254.34 | 17 | 1.91 | 0.49 | 0.84% |
| IJS | iShares S&P Small-Cap 600 Value | | 98.02 | 13 | 1.68 | 0.85 | -4.9% |
| IJT | iShares S&P Small-Cap 600 Growth | | 126.47 | 20 | 1.22 | 0.3 | 1.06% |
| XSLV | PowerShares S&P SmallCap Low Volatil ETF | | 43.19 | 42 | 0.84 | 1.1 | -2.17% |
| SDD | ProShares UltraShort SmallCap600 | | 19.31 | 61 | -2.02 | -0.21 | 4.79% |
| SMLV | SPDR SSGA US Small Cap Low Volatil ETF | | 108.83 | 44 | 1.30 | 1.22 | -3.27% |
| SAA | ProShares Ultra SmallCap600 | | 22.93 | 32 | 1.56 | -0.46 | -8.08% |
| SBB | ProShares Short SmallCap600 | | 16.37 | 71 | -1.14 | -0.09 | 2.76% |
| 12Stocks.com: Charts, Trends, Fundamental Data and Performances of SmallCap Stocks | |
|
We now take in-depth look at all SmallCap stocks including charts, multi-period performances and overall trends (as measured by Smart Investing & Trading Score). One can sort SmallCap stocks (click link to choose) by Daily, Weekly and by Year-to-Date performances. Also, one can sort by size of the company or by market capitalization. |
| Select Your Default Chart Type: | |||||
| |||||
| Click on stock symbol or name for detailed view. Click on to add stock symbol to your watchlist and to view watchlist. Quick View: Move mouse or cursor over "Daily" to quickly view daily technical stock chart and over "Weekly" to view weekly technical stock chart. | |||||

 | NYMT New York Mortgage Trust, Inc. |
| Sector: Financials | |
| SubSector: Mortgage Investment | |
| MarketCap: 1038.39 Millions | |
| Recent Price: 6.27 Smart Investing & Trading Score: 0 | |
| Day Percent Change: -10.68% Day Change: -0.75 | |
| Week Change: -10.94% Year-to-date Change: -26.5% | |
| NYMT Links: Profile News Message Board | |
| Charts:- Daily , Weekly | |
| Add NYMT to Watchlist: View: Get Complete NYMT Trend Analysis ➞ | |
 | AX Axos Financial, Inc. |
| Sector: Financials | |
| SubSector: Savings & Loans | |
| MarketCap: 1037.3 Millions | |
| Recent Price: 57.29 Smart Investing & Trading Score: 100 | |
| Day Percent Change: 3.23% Day Change: 1.79 | |
| Week Change: 7.99% Year-to-date Change: 4.9% | |
| AX Links: Profile News Message Board | |
| Charts:- Daily , Weekly | |
| Add AX to Watchlist: View: Get Complete AX Trend Analysis ➞ | |
 | THRM Gentherm Incorporated |
| Sector: Consumer Staples | |
| SubSector: Auto Parts | |
| MarketCap: 1032.59 Millions | |
| Recent Price: 51.42 Smart Investing & Trading Score: 57 | |
| Day Percent Change: -0.96% Day Change: -0.50 | |
| Week Change: 1.64% Year-to-date Change: -1.8% | |
| THRM Links: Profile News Message Board | |
| Charts:- Daily , Weekly | |
| Add THRM to Watchlist: View: Get Complete THRM Trend Analysis ➞ | |
 | IGT International Game Technology PLC |
| Sector: Services & Goods | |
| SubSector: Gaming Activities | |
| MarketCap: 1030.89 Millions | |
| Recent Price: 19.92 Smart Investing & Trading Score: 30 | |
| Day Percent Change: 0.10% Day Change: 0.02 | |
| Week Change: -1.87% Year-to-date Change: -27.3% | |
| IGT Links: Profile News Message Board | |
| Charts:- Daily , Weekly | |
| Add IGT to Watchlist: View: Get Complete IGT Trend Analysis ➞ | |
 | KRG Kite Realty Group Trust |
| Sector: Financials | |
| SubSector: REIT - Retail | |
| MarketCap: 1030.14 Millions | |
| Recent Price: 21.39 Smart Investing & Trading Score: 76 | |
| Day Percent Change: -0.14% Day Change: -0.03 | |
| Week Change: 0.61% Year-to-date Change: -6.4% | |
| KRG Links: Profile News Message Board | |
| Charts:- Daily , Weekly | |
| Add KRG to Watchlist: View: Get Complete KRG Trend Analysis ➞ | |
 | OLO Olo Inc. |
| Sector: Technology | |
| SubSector: Software - Application | |
| MarketCap: 1030 Millions | |
| Recent Price: 4.83 Smart Investing & Trading Score: 38 | |
| Day Percent Change: -1.83% Day Change: -0.09 | |
| Week Change: -3.4% Year-to-date Change: -15.6% | |
| OLO Links: Profile News Message Board | |
| Charts:- Daily , Weekly | |
| Add OLO to Watchlist: View: Get Complete OLO Trend Analysis ➞ | |
 | JOE The St. Joe Company |
| Sector: Financials | |
| SubSector: Real Estate Development | |
| MarketCap: 1029.39 Millions | |
| Recent Price: 57.80 Smart Investing & Trading Score: 68 | |
| Day Percent Change: 1.47% Day Change: 0.84 | |
| Week Change: -1.25% Year-to-date Change: -4.0% | |
| JOE Links: Profile News Message Board | |
| Charts:- Daily , Weekly | |
| Add JOE to Watchlist: View: Get Complete JOE Trend Analysis ➞ | |
 | TTMI TTM Technologies, Inc. |
| Sector: Technology | |
| SubSector: Printed Circuit Boards | |
| MarketCap: 1028.35 Millions | |
| Recent Price: 16.63 Smart Investing & Trading Score: 100 | |
| Day Percent Change: 12.59% Day Change: 1.86 | |
| Week Change: 9.91% Year-to-date Change: 5.2% | |
| TTMI Links: Profile News Message Board | |
| Charts:- Daily , Weekly | |
| Add TTMI to Watchlist: View: Get Complete TTMI Trend Analysis ➞ | |
 | DLX Deluxe Corporation |
| Sector: Services & Goods | |
| SubSector: Business Services | |
| MarketCap: 1025.82 Millions | |
| Recent Price: 21.57 Smart Investing & Trading Score: 95 | |
| Day Percent Change: 8.45% Day Change: 1.68 | |
| Week Change: 6% Year-to-date Change: 0.6% | |
| DLX Links: Profile News Message Board | |
| Charts:- Daily , Weekly | |
| Add DLX to Watchlist: View: Get Complete DLX Trend Analysis ➞ | |
 | ODP Office Depot, Inc. |
| Sector: Services & Goods | |
| SubSector: Specialty Retail, Other | |
| MarketCap: 1024.44 Millions | |
| Recent Price: 50.86 Smart Investing & Trading Score: 37 | |
| Day Percent Change: 0.02% Day Change: 0.01 | |
| Week Change: -1.03% Year-to-date Change: -9.7% | |
| ODP Links: Profile News Message Board | |
| Charts:- Daily , Weekly | |
| Add ODP to Watchlist: View: Get Complete ODP Trend Analysis ➞ | |
 | INVA Innoviva, Inc. |
| Sector: Health Care | |
| SubSector: Biotechnology | |
| MarketCap: 1023.15 Millions | |
| Recent Price: 15.37 Smart Investing & Trading Score: 39 | |
| Day Percent Change: 0.89% Day Change: 0.13 | |
| Week Change: 0.69% Year-to-date Change: -4.2% | |
| INVA Links: Profile News Message Board | |
| Charts:- Daily , Weekly | |
| Add INVA to Watchlist: View: Get Complete INVA Trend Analysis ➞ | |
 | TGTX TG Therapeutics, Inc. |
| Sector: Health Care | |
| SubSector: Biotechnology | |
| MarketCap: 1022.85 Millions | |
| Recent Price: 16.41 Smart Investing & Trading Score: 74 | |
| Day Percent Change: 3.34% Day Change: 0.53 | |
| Week Change: 21.83% Year-to-date Change: -3.9% | |
| TGTX Links: Profile News Message Board | |
| Charts:- Daily , Weekly | |
| Add TGTX to Watchlist: View: Get Complete TGTX Trend Analysis ➞ | |
 | JELD JELD-WEN Holding, Inc. |
| Sector: Industrials | |
| SubSector: General Building Materials | |
| MarketCap: 1022.53 Millions | |
| Recent Price: 19.65 Smart Investing & Trading Score: 41 | |
| Day Percent Change: -1.65% Day Change: -0.33 | |
| Week Change: -8.18% Year-to-date Change: 4.1% | |
| JELD Links: Profile News Message Board | |
| Charts:- Daily , Weekly | |
| Add JELD to Watchlist: View: Get Complete JELD Trend Analysis ➞ | |
 | CNXN PC Connection, Inc. |
| Sector: Technology | |
| SubSector: Computers Wholesale | |
| MarketCap: 1020.19 Millions | |
| Recent Price: 59.18 Smart Investing & Trading Score: 0 | |
| Day Percent Change: -4.49% Day Change: -2.78 | |
| Week Change: -7.08% Year-to-date Change: -12.0% | |
| CNXN Links: Profile News Message Board | |
| Charts:- Daily , Weekly | |
| Add CNXN to Watchlist: View: Get Complete CNXN Trend Analysis ➞ | |
 | MNTK Montauk Renewables, Inc. |
| Sector: Utilities | |
| SubSector: Utilities - Diversified | |
| MarketCap: 1020 Millions | |
| Recent Price: 3.72 Smart Investing & Trading Score: 44 | |
| Day Percent Change: 0.54% Day Change: 0.02 | |
| Week Change: -2.36% Year-to-date Change: -58.4% | |
| MNTK Links: Profile News Message Board | |
| Charts:- Daily , Weekly | |
| Add MNTK to Watchlist: View: Get Complete MNTK Trend Analysis ➞ | |
 | RLJ RLJ Lodging Trust |
| Sector: Financials | |
| SubSector: REIT - Hotel/Motel | |
| MarketCap: 1019.34 Millions | |
| Recent Price: 10.70 Smart Investing & Trading Score: 0 | |
| Day Percent Change: -2.37% Day Change: -0.26 | |
| Week Change: -3.69% Year-to-date Change: -8.7% | |
| RLJ Links: Profile News Message Board | |
| Charts:- Daily , Weekly | |
| Add RLJ to Watchlist: View: Get Complete RLJ Trend Analysis ➞ | |
 | ATNI ATN International, Inc. |
| Sector: Technology | |
| SubSector: Telecom Services - Domestic | |
| MarketCap: 1014.77 Millions | |
| Recent Price: 20.99 Smart Investing & Trading Score: 32 | |
| Day Percent Change: 4.12% Day Change: 0.83 | |
| Week Change: 7.53% Year-to-date Change: -46.1% | |
| ATNI Links: Profile News Message Board | |
| Charts:- Daily , Weekly | |
| Add ATNI to Watchlist: View: Get Complete ATNI Trend Analysis ➞ | |
 | MRTN Marten Transport, Ltd. |
| Sector: Transports | |
| SubSector: Trucking | |
| MarketCap: 1012.15 Millions | |
| Recent Price: 17.23 Smart Investing & Trading Score: 57 | |
| Day Percent Change: 1.32% Day Change: 0.22 | |
| Week Change: 1.74% Year-to-date Change: -17.9% | |
| MRTN Links: Profile News Message Board | |
| Charts:- Daily , Weekly | |
| Add MRTN to Watchlist: View: Get Complete MRTN Trend Analysis ➞ | |
 | INNV InnovAge Holding Corp. |
| Sector: Health Care | |
| SubSector: Medical Care Facilities | |
| MarketCap: 1010 Millions | |
| Recent Price: 3.78 Smart Investing & Trading Score: 45 | |
| Day Percent Change: -3.69% Day Change: -0.15 | |
| Week Change: -0.53% Year-to-date Change: -33.7% | |
| INNV Links: Profile News Message Board | |
| Charts:- Daily , Weekly | |
| Add INNV to Watchlist: View: Get Complete INNV Trend Analysis ➞ | |
 | PRFT Perficient, Inc. |
| Sector: Technology | |
| SubSector: Information Technology Services | |
| MarketCap: 1005.68 Millions | |
| Recent Price: 48.78 Smart Investing & Trading Score: 49 | |
| Day Percent Change: 3.27% Day Change: 1.54 | |
| Week Change: 13.48% Year-to-date Change: -25.9% | |
| PRFT Links: Profile News Message Board | |
| Charts:- Daily , Weekly | |
| Add PRFT to Watchlist: View: Get Complete PRFT Trend Analysis ➞ | |
 | MMI Marcus & Millichap, Inc. |
| Sector: Financials | |
| SubSector: Real Estate Development | |
| MarketCap: 1005.19 Millions | |
| Recent Price: 32.56 Smart Investing & Trading Score: 49 | |
| Day Percent Change: 3.46% Day Change: 1.09 | |
| Week Change: 0.9% Year-to-date Change: -25.5% | |
| MMI Links: Profile News Message Board | |
| Charts:- Daily , Weekly | |
| Add MMI to Watchlist: View: Get Complete MMI Trend Analysis ➞ | |
 | ADNT Adient plc |
| Sector: Consumer Staples | |
| SubSector: Auto Parts | |
| MarketCap: 1003.39 Millions | |
| Recent Price: 30.22 Smart Investing & Trading Score: 49 | |
| Day Percent Change: 2.65% Day Change: 0.78 | |
| Week Change: -0.66% Year-to-date Change: -16.9% | |
| ADNT Links: Profile News Message Board | |
| Charts:- Daily , Weekly | |
| Add ADNT to Watchlist: View: Get Complete ADNT Trend Analysis ➞ | |
 | FWRG First Watch Restaurant Group, Inc. |
| Sector: Services & Goods | |
| SubSector: Restaurants | |
| MarketCap: 1000 Millions | |
| Recent Price: 25.32 Smart Investing & Trading Score: 90 | |
| Day Percent Change: 1.48% Day Change: 0.37 | |
| Week Change: 7.11% Year-to-date Change: 27.0% | |
| FWRG Links: Profile News Message Board | |
| Charts:- Daily , Weekly | |
| Add FWRG to Watchlist: View: Get Complete FWRG Trend Analysis ➞ | |
 | ENTA Enanta Pharmaceuticals, Inc. |
| Sector: Health Care | |
| SubSector: Biotechnology | |
| MarketCap: 998.385 Millions | |
| Recent Price: 13.88 Smart Investing & Trading Score: 49 | |
| Day Percent Change: 2.36% Day Change: 0.32 | |
| Week Change: 12.21% Year-to-date Change: 47.5% | |
| ENTA Links: Profile News Message Board | |
| Charts:- Daily , Weekly | |
| Add ENTA to Watchlist: View: Get Complete ENTA Trend Analysis ➞ | |
 | ADUS Addus HomeCare Corporation |
| Sector: Health Care | |
| SubSector: Home Health Care | |
| MarketCap: 994.795 Millions | |
| Recent Price: 98.33 Smart Investing & Trading Score: 75 | |
| Day Percent Change: -0.08% Day Change: -0.08 | |
| Week Change: 4% Year-to-date Change: 5.9% | |
| ADUS Links: Profile News Message Board | |
| Charts:- Daily , Weekly | |
| Add ADUS to Watchlist: View: Get Complete ADUS Trend Analysis ➞ | |
| Too many stocks? View smallcap stocks filtered by marketcap & sector |
| Marketcap: All SmallCap Stocks (default-no microcap), Large, Mid-Range, Small & MicroCap |
| Sector: Tech, Finance, Energy, Staples, Retail, Industrial, Materials, Utilities & Medical |
|
Best Stocks Today 12Stocks.com |
© 2024 12Stocks.com Terms & Conditions Privacy Contact Us
All Information Provided Only For Education And Not To Be Used For Investing or Trading. See Terms & Conditions


One More Thing ... Get Best Stocks Delivered Daily!
Never Ever Miss A Move With Our Top Ten Stocks Lists
Find Best Stocks In Any Market - Bull or Bear Market
Take A Peek At Our Top Ten Stocks Lists: Daily, Weekly, Year-to-Date & Top Trends
Find Best Stocks In Any Market - Bull or Bear Market
Take A Peek At Our Top Ten Stocks Lists: Daily, Weekly, Year-to-Date & Top Trends
Smallcap Stocks With Best Up Trends [0-bearish to 100-bullish]: Emergent BioSolutions[100], Aspen Aerogels[100], Perdoceo Education[100], Gannett Co[100], Pitney Bowes[100], Benchmark Electronics[100], Origin Materials[100], FormFactor [100], Lantheus [100], Q2 [100], Blueprint Medicines[100]
Best Smallcap Stocks Year-to-Date:
Janux [440.16%], Viking [307.15%], Longboard [273.98%], Alpine Immune[239.23%], Bakkt [187.89%], Avidity Biosciences[182.96%], Vera [170.74%], Cullinan Oncology[169.74%], Super Micro[168.13%], Arcutis Bio[166.1%], Y-mAbs [153.08%] Best Smallcap Stocks This Week:
Deciphera [73.17%], Emergent BioSolutions[71.88%], Eyenovia [48.36%], Aspen Aerogels[47.89%], P3 Health[38.51%], Carvana Co[38.18%], Cue Biopharma[36.26%], Origin Materials[36.24%], TransMedics Group[35.13%], Seres [33.33%], Enovix [32.07%] Best Smallcap Stocks Daily:
Emergent BioSolutions[70.98%], Aspen Aerogels[56.44%], Carvana Co[33.77%], Perdoceo Education[31.79%], Enovix [31.06%], Office Properties[29.00%], Gannett Co[26.97%], Sunnova Energy[25.21%], Pitney Bowes[24.70%], Pulmonx [21.37%], CommScope Holding[20.38%]