
 Login Sign Up


| |||||
 |  | ||||

| 12Stocks.com Market Intelligence |
Best SmallCap Stocks
|
| In a hurry? Small Cap Stock Lists: Performance Trends Table, Stock Charts
Sort Small Cap stocks: Daily, Weekly, Year-to-Date, Market Cap & Trends. Filter Small Cap stocks list by sector: Show all, Tech, Finance, Energy, Staples, Retail, Industrial, Materials, Utilities and HealthCare Filter Small Cap stocks list by size: All Large Medium Small and MicroCap |
| 12Stocks.com Small Cap Stocks Performances & Trends Daily | |||||||||
|
|  The overall Smart Investing & Trading Score is 23 (0-bearish to 100-bullish) which puts Small Cap index in short term bearish to neutral trend. The Smart Investing & Trading Score from previous trading session is 13 and an improvement of trend continues.
| ||||||||
Here are the Smart Investing & Trading Scores of the most requested small cap stocks at 12Stocks.com (click stock name for detailed review):
|


| 12Stocks.com: Investing in Smallcap Index with Stocks | |
|
The following table helps investors and traders sort through current performance and trends (as measured by Smart Investing & Trading Score) of various
stocks in the Smallcap Index. Quick View: Move mouse or cursor over stock symbol (ticker) to view short-term technical chart and over stock name to view long term chart. Click on  to add stock symbol to your watchlist and to add stock symbol to your watchlist and  to view watchlist. Click on any ticker or stock name for detailed market intelligence report for that stock. to view watchlist. Click on any ticker or stock name for detailed market intelligence report for that stock. |
12Stocks.com Performance of Stocks in Smallcap Index
| Ticker | Stock Name | Watchlist | Category | Recent Price | Smart Investing & Trading Score | Change % | YTD Change% |
| ENFN | Enfusion |   | Technology | 9.15 | 36 | -1.08% | -7.13% |
| MGRC | McGrath RentCorp | | Transports | 110.17 | 10 | -0.45% | -7.90% |
| IBP | Installed Building | | Industrials | 219.14 | 44 | -2.43% | 19.87% |
| SIX | Six Flags | | Services & Goods | 23.42 | 10 | -0.68% | -6.62% |
| RNST | Renasant | | Financials | 29.39 | 52 | 2.16% | -12.74% |
| FWRD | Forward Air | | Transports | 23.54 | 37 | 3.47% | -62.56% |
| ATGE | Adtalem Global | | Services & Goods | 46.20 | 35 | 0.13% | -21.63% |
| NWBI | Northwest Bancshares | | Financials | 10.99 | 52 | 1.99% | -11.90% |
| VRRM | Verra Mobility | | Services & Goods | 23.39 | 0 | -0.21% | 1.56% |
| CBT | Cabot | | Materials | 91.41 | 36 | 0.79% | 9.47% |
| EMBC | Embecta | | Health Care | 10.57 | 42 | 0.33% | -44.67% |
| MLI | Mueller Industries | | Industrials | 52.01 | 61 | -0.59% | 10.31% |
| ALX | Alexander s | | Financials | 208.10 | 23 | 1.28% | -2.56% |
| KBH | KB Home | | Industrials | 60.92 | 44 | 0.84% | -2.47% |
| OPI | Office Properties | | Financials | 1.90 | 28 | 0.80% | -74.11% |
| LUMN | Lumen | | Technology | 1.30 | 46 | -1.14% | -28.49% |
| ATRI | Atrion | | Health Care | 402.68 | 46 | 4.40% | 6.31% |
| RGNX | REGENXBIO | | Health Care | 15.37 | 36 | -4.62% | -14.40% |
| KN | Knowles | | Technology | 15.23 | 0 | -0.29% | -14.99% |
| NUS | Nu Skin | | Consumer Staples | 13.01 | 52 | 2.44% | -33.01% |
| SNCY | Sun Country | | Industrials | 14.79 | 71 | -1.99% | -6.48% |
| AVNS | Avanos Medical | | Health Care | 18.83 | 42 | 0.70% | -16.05% |
| SBH | Sally Beauty | | Services & Goods | 10.49 | 32 | -0.66% | -21.01% |
| CORT | Corcept | | Health Care | 22.70 | 36 | 0.18% | -30.11% |
| IDCC | InterDigital | | Technology | 96.01 | 18 | 0.37% | -11.54% |


| Too many stocks? View smallcap stocks filtered by marketcap & sector |
| Marketcap: All SmallCap Stocks (default-no microcap), Large, Mid-Range, Small |
| Smallcap Sector: Tech, Finance, Energy, Staples, Retail, Industrial, Materials, & Medical |
|
Get the most comprehensive stock market coverage daily at 12Stocks.com ➞ Best Stocks Today ➞ Best Stocks Weekly ➞ Best Stocks Year-to-Date ➞ Best Stocks Trends ➞  Best Stocks Today 12Stocks.com Best Nasdaq Stocks ➞ Best S&P 500 Stocks ➞ Best Tech Stocks ➞ Best Biotech Stocks ➞ |
| Detailed Overview of SmallCap Stocks |
| SmallCap Technical Overview, Leaders & Laggards, Top SmallCap ETF Funds & Detailed SmallCap Stocks List, Charts, Trends & More |
| Smallcap: Technical Analysis, Trends & YTD Performance | |
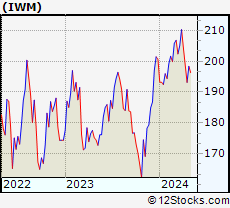
| SmallCap segment as represented by
IWM, an exchange-traded fund [ETF], holds basket of thousands of smallcap stocks from across all major sectors of the US stock market. The smallcap index (contains stocks like Riverbed & Sotheby's) is down by -4.52% and is currently underperforming the overall market by -7.67% year-to-date. Below is a quick view of technical charts and trends: | |
 IWM Weekly Chart |
|
| Long Term Trend: Not Good | |
| Medium Term Trend: Not Good | |
 IWM Daily Chart |
|
| Short Term Trend: Not Good | |
| Overall Trend Score: 23 | |
| YTD Performance: -4.52% | |
| **Trend Scores & Views Are Only For Educational Purposes And Not For Investing | |
| 12Stocks.com: Top Performing Small Cap Index Stocks | ||||||||||||||||||||||||||||||||||||||||||||||||
 The top performing Small Cap Index stocks year to date are
Now, more recently, over last week, the top performing Small Cap Index stocks on the move are


|
||||||||||||||||||||||||||||||||||||||||||||||||
| 12Stocks.com: Investing in Smallcap Index using Exchange Traded Funds | |
|
The following table shows list of key exchange traded funds (ETF) that
help investors track Smallcap index. The following list also includes leveraged ETF funds that track twice or thrice the daily returns of Smallcap indices. Short or inverse ETF funds move in the opposite direction to the index they track and are useful during market pullbacks or during bear markets. Quick View: Move mouse or cursor over ETF symbol (ticker) to view short-term technical chart and over ETF name to view long term chart. Click on ticker or stock name for detailed view. Click on to add stock symbol to your watchlist and to view watchlist. |
12Stocks.com List of ETFs that track Smallcap Index
| Ticker | ETF Name | Watchlist | Recent Price | Smart Investing & Trading Score | Change % | Week % | Year-to-date % |
| IWM | iShares Russell 2000 | | 191.63 | 23 | -0.63 | -3.55 | -4.52% |
| IWN | iShares Russell 2000 Value | | 146.63 | 10 | 0.21 | -2.49 | -5.6% |
| IJR | iShares Core S&P Small-Cap | | 102.51 | 10 | 0.16 | -1.92 | -5.31% |
| VTWO | Vanguard Russell 2000 ETF | | 77.48 | 23 | -0.60 | -3.53 | -4.46% |
| IWO | iShares Russell 2000 Growth | | 243.13 | 36 | -1.54 | -4.79 | -3.6% |
| IJS | iShares S&P Small-Cap 600 Value | | 95.00 | 17 | 0.52 | -1.22 | -7.83% |
| IJT | iShares S&P Small-Cap 600 Growth | | 122.10 | 23 | 0.44 | -2.15 | -2.43% |
| SAA | ProShares Ultra SmallCap600 | | 21.91 | 18 | 1.34 | -2.88 | -12.18% |
| XSLV | PowerShares S&P SmallCap Low Volatil ETF | | 42.07 | 17 | 1.01 | -0.05 | -4.71% |
| SMLV | SPDR SSGA US Small Cap Low Volatil ETF | | 105.89 | 32 | 1.98 | 0.84 | -5.89% |
| SDD | ProShares UltraShort SmallCap600 | | 20.32 | 76 | -1.79 | 2.47 | 10.28% |
| SBB | ProShares Short SmallCap600 | | 16.78 | 76 | -1.18 | 1.41 | 5.34% |
| 12Stocks.com: Charts, Trends, Fundamental Data and Performances of SmallCap Stocks | |
|
We now take in-depth look at all SmallCap stocks including charts, multi-period performances and overall trends (as measured by Smart Investing & Trading Score). One can sort SmallCap stocks (click link to choose) by Daily, Weekly and by Year-to-Date performances. Also, one can sort by size of the company or by market capitalization. |
| Select Your Default Chart Type: | |||||
| |||||
| Click on stock symbol or name for detailed view. Click on to add stock symbol to your watchlist and to view watchlist. Quick View: Move mouse or cursor over "Daily" to quickly view daily technical stock chart and over "Weekly" to view weekly technical stock chart. | |||||

 | ENFN Enfusion, Inc. |
| Sector: Technology | |
| SubSector: Software - Application | |
| MarketCap: 1290 Millions | |
| Recent Price: 9.15 Smart Investing & Trading Score: 36 | |
| Day Percent Change: -1.08% Day Change: -0.10 | |
| Week Change: -4.34% Year-to-date Change: -7.1% | |
| ENFN Links: Profile News Message Board | |
| Charts:- Daily , Weekly | |
| Add ENFN to Watchlist: View: Get Complete ENFN Trend Analysis ➞ | |
 | MGRC McGrath RentCorp |
| Sector: Transports | |
| SubSector: Rental & Leasing Services | |
| MarketCap: 1289.04 Millions | |
| Recent Price: 110.17 Smart Investing & Trading Score: 10 | |
| Day Percent Change: -0.45% Day Change: -0.50 | |
| Week Change: -4.2% Year-to-date Change: -7.9% | |
| MGRC Links: Profile News Message Board | |
| Charts:- Daily , Weekly | |
| Add MGRC to Watchlist: View: Get Complete MGRC Trend Analysis ➞ | |
 | IBP Installed Building Products, Inc. |
| Sector: Industrials | |
| SubSector: General Building Materials | |
| MarketCap: 1284.23 Millions | |
| Recent Price: 219.14 Smart Investing & Trading Score: 44 | |
| Day Percent Change: -2.43% Day Change: -5.45 | |
| Week Change: -8.98% Year-to-date Change: 19.9% | |
| IBP Links: Profile News Message Board | |
| Charts:- Daily , Weekly | |
| Add IBP to Watchlist: View: Get Complete IBP Trend Analysis ➞ | |
 | SIX Six Flags Entertainment Corporation |
| Sector: Services & Goods | |
| SubSector: General Entertainment | |
| MarketCap: 1282.69 Millions | |
| Recent Price: 23.42 Smart Investing & Trading Score: 10 | |
| Day Percent Change: -0.68% Day Change: -0.16 | |
| Week Change: -2.46% Year-to-date Change: -6.6% | |
| SIX Links: Profile News Message Board | |
| Charts:- Daily , Weekly | |
| Add SIX to Watchlist: View: Get Complete SIX Trend Analysis ➞ | |
 | RNST Renasant Corporation |
| Sector: Financials | |
| SubSector: Money Center Banks | |
| MarketCap: 1279.39 Millions | |
| Recent Price: 29.39 Smart Investing & Trading Score: 52 | |
| Day Percent Change: 2.16% Day Change: 0.62 | |
| Week Change: 2.05% Year-to-date Change: -12.7% | |
| RNST Links: Profile News Message Board | |
| Charts:- Daily , Weekly | |
| Add RNST to Watchlist: View: Get Complete RNST Trend Analysis ➞ | |
 | FWRD Forward Air Corporation |
| Sector: Transports | |
| SubSector: Air Delivery & Freight Services | |
| MarketCap: 1278.88 Millions | |
| Recent Price: 23.54 Smart Investing & Trading Score: 37 | |
| Day Percent Change: 3.47% Day Change: 0.79 | |
| Week Change: -14.71% Year-to-date Change: -62.6% | |
| FWRD Links: Profile News Message Board | |
| Charts:- Daily , Weekly | |
| Add FWRD to Watchlist: View: Get Complete FWRD Trend Analysis ➞ | |
 | ATGE Adtalem Global Education Inc. |
| Sector: Services & Goods | |
| SubSector: Education & Training Services | |
| MarketCap: 1273.86 Millions | |
| Recent Price: 46.20 Smart Investing & Trading Score: 35 | |
| Day Percent Change: 0.13% Day Change: 0.06 | |
| Week Change: -0.13% Year-to-date Change: -21.6% | |
| ATGE Links: Profile News Message Board | |
| Charts:- Daily , Weekly | |
| Add ATGE to Watchlist: View: Get Complete ATGE Trend Analysis ➞ | |
 | NWBI Northwest Bancshares, Inc. |
| Sector: Financials | |
| SubSector: Savings & Loans | |
| MarketCap: 1266.3 Millions | |
| Recent Price: 10.99 Smart Investing & Trading Score: 52 | |
| Day Percent Change: 1.99% Day Change: 0.21 | |
| Week Change: 1.62% Year-to-date Change: -11.9% | |
| NWBI Links: Profile News Message Board | |
| Charts:- Daily , Weekly | |
| Add NWBI to Watchlist: View: Get Complete NWBI Trend Analysis ➞ | |
 | VRRM Verra Mobility Corporation |
| Sector: Services & Goods | |
| SubSector: Security & Protection Services | |
| MarketCap: 1265.03 Millions | |
| Recent Price: 23.39 Smart Investing & Trading Score: 0 | |
| Day Percent Change: -0.21% Day Change: -0.05 | |
| Week Change: -4.18% Year-to-date Change: 1.6% | |
| VRRM Links: Profile News Message Board | |
| Charts:- Daily , Weekly | |
| Add VRRM to Watchlist: View: Get Complete VRRM Trend Analysis ➞ | |
 | CBT Cabot Corporation |
| Sector: Materials | |
| SubSector: Specialty Chemicals | |
| MarketCap: 1261.47 Millions | |
| Recent Price: 91.41 Smart Investing & Trading Score: 36 | |
| Day Percent Change: 0.79% Day Change: 0.72 | |
| Week Change: -1.99% Year-to-date Change: 9.5% | |
| CBT Links: Profile News Message Board | |
| Charts:- Daily , Weekly | |
| Add CBT to Watchlist: View: Get Complete CBT Trend Analysis ➞ | |
 | EMBC Embecta Corp. |
| Sector: Health Care | |
| SubSector: Medical Instruments & Supplies | |
| MarketCap: 1260 Millions | |
| Recent Price: 10.57 Smart Investing & Trading Score: 42 | |
| Day Percent Change: 0.33% Day Change: 0.04 | |
| Week Change: 3.12% Year-to-date Change: -44.7% | |
| EMBC Links: Profile News Message Board | |
| Charts:- Daily , Weekly | |
| Add EMBC to Watchlist: View: Get Complete EMBC Trend Analysis ➞ | |
 | MLI Mueller Industries, Inc. |
| Sector: Industrials | |
| SubSector: Metal Fabrication | |
| MarketCap: 1259.5 Millions | |
| Recent Price: 52.01 Smart Investing & Trading Score: 61 | |
| Day Percent Change: -0.59% Day Change: -0.31 | |
| Week Change: 0.56% Year-to-date Change: 10.3% | |
| MLI Links: Profile News Message Board | |
| Charts:- Daily , Weekly | |
| Add MLI to Watchlist: View: Get Complete MLI Trend Analysis ➞ | |
 | ALX Alexander s, Inc. |
| Sector: Financials | |
| SubSector: REIT - Retail | |
| MarketCap: 1251.54 Millions | |
| Recent Price: 208.10 Smart Investing & Trading Score: 23 | |
| Day Percent Change: 1.28% Day Change: 2.64 | |
| Week Change: -3.94% Year-to-date Change: -2.6% | |
| ALX Links: Profile News Message Board | |
| Charts:- Daily , Weekly | |
| Add ALX to Watchlist: View: Get Complete ALX Trend Analysis ➞ | |
 | KBH KB Home |
| Sector: Industrials | |
| SubSector: Residential Construction | |
| MarketCap: 1249.66 Millions | |
| Recent Price: 60.92 Smart Investing & Trading Score: 44 | |
| Day Percent Change: 0.84% Day Change: 0.51 | |
| Week Change: -4.96% Year-to-date Change: -2.5% | |
| KBH Links: Profile News Message Board | |
| Charts:- Daily , Weekly | |
| Add KBH to Watchlist: View: Get Complete KBH Trend Analysis ➞ | |
 | OPI Office Properties Income Trust |
| Sector: Financials | |
| SubSector: REIT - Office | |
| MarketCap: 1245.66 Millions | |
| Recent Price: 1.90 Smart Investing & Trading Score: 28 | |
| Day Percent Change: 0.80% Day Change: 0.02 | |
| Week Change: -7.11% Year-to-date Change: -74.1% | |
| OPI Links: Profile News Message Board | |
| Charts:- Daily , Weekly | |
| Add OPI to Watchlist: View: Get Complete OPI Trend Analysis ➞ | |
 | LUMN Lumen Technologies, Inc. |
| Sector: Technology | |
| SubSector: Telecom Services - Domestic | |
| MarketCap: 1242 Millions | |
| Recent Price: 1.30 Smart Investing & Trading Score: 46 | |
| Day Percent Change: -1.14% Day Change: -0.02 | |
| Week Change: -5.43% Year-to-date Change: -28.5% | |
| LUMN Links: Profile News Message Board | |
| Charts:- Daily , Weekly | |
| Add LUMN to Watchlist: View: Get Complete LUMN Trend Analysis ➞ | |
 | ATRI Atrion Corporation |
| Sector: Health Care | |
| SubSector: Medical Instruments & Supplies | |
| MarketCap: 1234.6 Millions | |
| Recent Price: 402.68 Smart Investing & Trading Score: 46 | |
| Day Percent Change: 4.40% Day Change: 16.98 | |
| Week Change: 0.83% Year-to-date Change: 6.3% | |
| ATRI Links: Profile News Message Board | |
| Charts:- Daily , Weekly | |
| Add ATRI to Watchlist: View: Get Complete ATRI Trend Analysis ➞ | |
 | RGNX REGENXBIO Inc. |
| Sector: Health Care | |
| SubSector: Biotechnology | |
| MarketCap: 1232.85 Millions | |
| Recent Price: 15.37 Smart Investing & Trading Score: 36 | |
| Day Percent Change: -4.62% Day Change: -0.74 | |
| Week Change: -15.06% Year-to-date Change: -14.4% | |
| RGNX Links: Profile News Message Board | |
| Charts:- Daily , Weekly | |
| Add RGNX to Watchlist: View: Get Complete RGNX Trend Analysis ➞ | |
 | KN Knowles Corporation |
| Sector: Technology | |
| SubSector: Communication Equipment | |
| MarketCap: 1231.39 Millions | |
| Recent Price: 15.23 Smart Investing & Trading Score: 0 | |
| Day Percent Change: -0.29% Day Change: -0.04 | |
| Week Change: -3.7% Year-to-date Change: -15.0% | |
| KN Links: Profile News Message Board | |
| Charts:- Daily , Weekly | |
| Add KN to Watchlist: View: Get Complete KN Trend Analysis ➞ | |
 | NUS Nu Skin Enterprises, Inc. |
| Sector: Consumer Staples | |
| SubSector: Personal Products | |
| MarketCap: 1230.85 Millions | |
| Recent Price: 13.01 Smart Investing & Trading Score: 52 | |
| Day Percent Change: 2.44% Day Change: 0.31 | |
| Week Change: 7.97% Year-to-date Change: -33.0% | |
| NUS Links: Profile News Message Board | |
| Charts:- Daily , Weekly | |
| Add NUS to Watchlist: View: Get Complete NUS Trend Analysis ➞ | |
 | SNCY Sun Country Airlines Holdings, Inc. |
| Sector: Industrials | |
| SubSector: Airlines | |
| MarketCap: 1230 Millions | |
| Recent Price: 14.79 Smart Investing & Trading Score: 71 | |
| Day Percent Change: -1.99% Day Change: -0.30 | |
| Week Change: 3.72% Year-to-date Change: -6.5% | |
| SNCY Links: Profile News Message Board | |
| Charts:- Daily , Weekly | |
| Add SNCY to Watchlist: View: Get Complete SNCY Trend Analysis ➞ | |
 | AVNS Avanos Medical, Inc. |
| Sector: Health Care | |
| SubSector: Medical Instruments & Supplies | |
| MarketCap: 1229.6 Millions | |
| Recent Price: 18.83 Smart Investing & Trading Score: 42 | |
| Day Percent Change: 0.70% Day Change: 0.13 | |
| Week Change: 1.73% Year-to-date Change: -16.1% | |
| AVNS Links: Profile News Message Board | |
| Charts:- Daily , Weekly | |
| Add AVNS to Watchlist: View: Get Complete AVNS Trend Analysis ➞ | |
 | SBH Sally Beauty Holdings, Inc. |
| Sector: Services & Goods | |
| SubSector: Specialty Retail, Other | |
| MarketCap: 1229.44 Millions | |
| Recent Price: 10.49 Smart Investing & Trading Score: 32 | |
| Day Percent Change: -0.66% Day Change: -0.07 | |
| Week Change: -3.94% Year-to-date Change: -21.0% | |
| SBH Links: Profile News Message Board | |
| Charts:- Daily , Weekly | |
| Add SBH to Watchlist: View: Get Complete SBH Trend Analysis ➞ | |
 | CORT Corcept Therapeutics Incorporated |
| Sector: Health Care | |
| SubSector: Biotechnology | |
| MarketCap: 1228.45 Millions | |
| Recent Price: 22.70 Smart Investing & Trading Score: 36 | |
| Day Percent Change: 0.18% Day Change: 0.04 | |
| Week Change: -3.45% Year-to-date Change: -30.1% | |
| CORT Links: Profile News Message Board | |
| Charts:- Daily , Weekly | |
| Add CORT to Watchlist: View: Get Complete CORT Trend Analysis ➞ | |
 | IDCC InterDigital, Inc. |
| Sector: Technology | |
| SubSector: Wireless Communications | |
| MarketCap: 1225.27 Millions | |
| Recent Price: 96.01 Smart Investing & Trading Score: 18 | |
| Day Percent Change: 0.37% Day Change: 0.35 | |
| Week Change: -0.56% Year-to-date Change: -11.5% | |
| IDCC Links: Profile News Message Board | |
| Charts:- Daily , Weekly | |
| Add IDCC to Watchlist: View: Get Complete IDCC Trend Analysis ➞ | |
| Too many stocks? View smallcap stocks filtered by marketcap & sector |
| Marketcap: All SmallCap Stocks (default-no microcap), Large, Mid-Range, Small & MicroCap |
| Sector: Tech, Finance, Energy, Staples, Retail, Industrial, Materials, Utilities & Medical |
|
Best Stocks Today 12Stocks.com |
© 2024 12Stocks.com Terms & Conditions Privacy Contact Us
All Information Provided Only For Education And Not To Be Used For Investing or Trading. See Terms & Conditions


One More Thing ... Get Best Stocks Delivered Daily!
Never Ever Miss A Move With Our Top Ten Stocks Lists
Find Best Stocks In Any Market - Bull or Bear Market
Take A Peek At Our Top Ten Stocks Lists: Daily, Weekly, Year-to-Date & Top Trends
Find Best Stocks In Any Market - Bull or Bear Market
Take A Peek At Our Top Ten Stocks Lists: Daily, Weekly, Year-to-Date & Top Trends
Smallcap Stocks With Best Up Trends [0-bearish to 100-bullish]: Humacyte [100], Victory Capital[100], Cricut [100], Old Second[100], United Fire[100], Century Aluminum[100], Portland General[100], Tejon Ranch[100], Gannett Co[100], Lantheus [100], Target Hospitality[100]
Best Smallcap Stocks Year-to-Date:
Agenus [519.64%], CareMax [423.71%], Janux [336.95%], Alpine Immune[238.42%], Viking [231.81%], Longboard [194.11%], Arcutis Bio[184.06%], Super Micro[155.54%], Avidity Biosciences[153.65%], Vera [138.18%], Stoke [121.48%] Best Smallcap Stocks This Week:
Macatawa Bank[45.99%], Vertex Energy[43.75%], Snap One[29.61%], Vanda [24.76%], Humacyte [23.78%], ALX Oncology[22.49%], ContextLogic [20%], ProKidney [16.57%], Badger Meter[15.82%], Calavo Growers[14.44%], Accolade [13.45%] Best Smallcap Stocks Daily:
Origin Materials[20.44%], Metropolitan Bank[17.73%], Tellurian [17.66%], Vertex Energy[14.12%], Fossil Group[10.55%], Genelux [10.37%], Humacyte [9.86%], Riot Blockchain[9.11%], Cohen & Steers[8.81%], Chemung Financial[8.68%], Urban One[8.21%]