
 Login Sign Up


| |||||
 |  | ||||

| 12Stocks.com Market Intelligence |
Best SmallCap Stocks
|
| In a hurry? Small Cap Stock Lists: Performance Trends Table, Stock Charts
Sort Small Cap stocks: Daily, Weekly, Year-to-Date, Market Cap & Trends. Filter Small Cap stocks list by sector: Show all, Tech, Finance, Energy, Staples, Retail, Industrial, Materials, Utilities and HealthCare Filter Small Cap stocks list by size: All Large Medium Small and MicroCap |
| 12Stocks.com Small Cap Stocks Performances & Trends Daily | |||||||||
|
|  The overall Smart Investing & Trading Score is 26 (0-bearish to 100-bullish) which puts Small Cap index in short term bearish to neutral trend. The Smart Investing & Trading Score from previous trading session is 31 and a deterioration of trend continues.
| ||||||||
Here are the Smart Investing & Trading Scores of the most requested small cap stocks at 12Stocks.com (click stock name for detailed review):
|


| 12Stocks.com: Investing in Smallcap Index with Stocks | |
|
The following table helps investors and traders sort through current performance and trends (as measured by Smart Investing & Trading Score) of various
stocks in the Smallcap Index. Quick View: Move mouse or cursor over stock symbol (ticker) to view short-term technical chart and over stock name to view long term chart. Click on  to add stock symbol to your watchlist and to add stock symbol to your watchlist and  to view watchlist. Click on any ticker or stock name for detailed market intelligence report for that stock. to view watchlist. Click on any ticker or stock name for detailed market intelligence report for that stock. |
12Stocks.com Performance of Stocks in Smallcap Index
| Ticker | Stock Name | Watchlist | Category | Recent Price | Smart Investing & Trading Score | Change % | YTD Change% |
| PIII | P3 Health |   | Health Care | 0.47 | 20 | -3.81% | -67.96% |
| ROIC | Retail Opportunity | | Financials | 12.09 | 0 | -1.91% | -13.86% |
| INFN | Infinera | | Technology | 4.72 | 10 | 4.07% | -0.53% |
| MEI | Methode Electronics | | Technology | 12.30 | 42 | -2.15% | -45.89% |
| FLWS | 1-800-FLOWERS.COM | | Services & Goods | 8.72 | 10 | -0.57% | -19.11% |
| SKWD | Skyward Specialty | | Financials | 35.80 | 36 | 0.08% | 5.45% |
| MLAB | Mesa | | Technology | 102.26 | 50 | -2.10% | -2.40% |
| CVGW | Calavo Growers | | Consumer Staples | 24.90 | 18 | 1.06% | -15.33% |
| PRIM | Primoris Services | | Industrials | 44.45 | 51 | -0.70% | 33.83% |
| PRM | Perimeter Solutions | | Materials | 7.11 | 46 | -0.07% | 54.62% |
| GRND | Grindr | | Technology | 9.94 | 46 | -0.90% | 10.94% |
| SCLX | Scilex Holding | | Health Care | 1.15 | 10 | -10.55% | -41.58% |
| GTY | Getty Realty | | Financials | 26.31 | 10 | -1.13% | -9.96% |
| GPI | Group 1 | | Services & Goods | 269.24 | 26 | 0.50% | -11.65% |
| WHD | Cactus | | Energy | 50.22 | 51 | -0.22% | 10.62% |
| MTTR | Matterport | | Technology | 1.81 | 15 | -2.16% | -32.96% |
| PMT | PennyMac Mortgage | | Financials | 13.28 | 10 | -0.64% | -11.20% |
| ALTI | AlTi Global | | Financials | 4.50 | 10 | -0.22% | -50.39% |
| SKY | Skyline Champion | | Industrials | 76.32 | 26 | -2.32% | 2.77% |
| BKE | Buckle | | Services & Goods | 35.90 | 0 | -1.72% | -24.45% |
| MD | MEDNAX | | Health Care | 9.01 | 10 | -1.80% | -3.17% |
| ATI | Allegheny | | Industrials | 51.09 | 43 | 0.00% | 12.36% |
| FBP | First Ban | | Financials | 16.36 | 0 | -1.48% | -0.58% |
| SMP | Standard Motor | | Consumer Staples | 32.10 | 10 | 0.25% | -19.37% |
| EGBN | Eagle Bancorp | | Financials | 20.97 | 10 | -1.60% | -30.42% |


| Too many stocks? View smallcap stocks filtered by marketcap & sector |
| Marketcap: All SmallCap Stocks (default-no microcap), Large, Mid-Range, Small |
| Smallcap Sector: Tech, Finance, Energy, Staples, Retail, Industrial, Materials, & Medical |
|
Get the most comprehensive stock market coverage daily at 12Stocks.com ➞ Best Stocks Today ➞ Best Stocks Weekly ➞ Best Stocks Year-to-Date ➞ Best Stocks Trends ➞  Best Stocks Today 12Stocks.com Best Nasdaq Stocks ➞ Best S&P 500 Stocks ➞ Best Tech Stocks ➞ Best Biotech Stocks ➞ |
| Detailed Overview of SmallCap Stocks |
| SmallCap Technical Overview, Leaders & Laggards, Top SmallCap ETF Funds & Detailed SmallCap Stocks List, Charts, Trends & More |
| Smallcap: Technical Analysis, Trends & YTD Performance | |
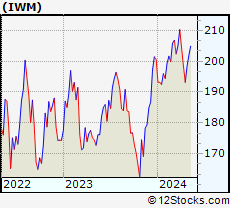
| SmallCap segment as represented by
IWM, an exchange-traded fund [ETF], holds basket of thousands of smallcap stocks from across all major sectors of the US stock market. The smallcap index (contains stocks like Riverbed & Sotheby's) is down by -2.84% and is currently underperforming the overall market by -7.97% year-to-date. Below is a quick view of technical charts and trends: | |
 IWM Weekly Chart |
|
| Long Term Trend: Good | |
| Medium Term Trend: Not Good | |
 IWM Daily Chart |
|
| Short Term Trend: Not Good | |
| Overall Trend Score: 26 | |
| YTD Performance: -2.84% | |
| **Trend Scores & Views Are Only For Educational Purposes And Not For Investing | |
| 12Stocks.com: Top Performing Small Cap Index Stocks | ||||||||||||||||||||||||||||||||||||||||||||||||
 The top performing Small Cap Index stocks year to date are
Now, more recently, over last week, the top performing Small Cap Index stocks on the move are


|
||||||||||||||||||||||||||||||||||||||||||||||||
| 12Stocks.com: Investing in Smallcap Index using Exchange Traded Funds | |
|
The following table shows list of key exchange traded funds (ETF) that
help investors track Smallcap index. The following list also includes leveraged ETF funds that track twice or thrice the daily returns of Smallcap indices. Short or inverse ETF funds move in the opposite direction to the index they track and are useful during market pullbacks or during bear markets. Quick View: Move mouse or cursor over ETF symbol (ticker) to view short-term technical chart and over ETF name to view long term chart. Click on ticker or stock name for detailed view. Click on to add stock symbol to your watchlist and to view watchlist. |
12Stocks.com List of ETFs that track Smallcap Index
| Ticker | ETF Name | Watchlist | Recent Price | Smart Investing & Trading Score | Change % | Week % | Year-to-date % |
| IWM | iShares Russell 2000 | | 195.01 | 26 | -0.40 | -1.85 | -2.84% |
| IJR | iShares Core S&P Small-Cap | | 102.72 | 0 | -0.79 | -1.71 | -5.1% |
| VTWO | Vanguard Russell 2000 ETF | | 78.70 | 26 | -0.67 | -2.02 | -2.96% |
| IWN | iShares Russell 2000 Value | | 147.16 | 13 | -0.97 | -2.14 | -5.26% |
| IWO | iShares Russell 2000 Growth | | 250.26 | 26 | -0.31 | -2 | -0.78% |
| IJS | iShares S&P Small-Cap 600 Value | | 94.41 | 0 | -0.83 | -1.83 | -8.4% |
| IJT | iShares S&P Small-Cap 600 Growth | | 122.23 | 13 | -1.04 | -2.04 | -2.33% |
| SBB | ProShares Short SmallCap600 | | 16.84 | 100 | 2.62 | 1.77 | 5.71% |
| SDD | ProShares UltraShort SmallCap600 | | 20.23 | 100 | 0.00 | 2.01 | 9.79% |
| SAA | ProShares Ultra SmallCap600 | | 21.81 | 0 | -2.76 | -3.33 | -12.59% |
| SMLV | SPDR SSGA US Small Cap Low Volatil ETF | | 103.84 | 0 | -0.85 | -1.12 | -7.71% |
| XSLV | PowerShares S&P SmallCap Low Volatil ETF | | 41.62 | 0 | -0.63 | -1.13 | -5.74% |
| 12Stocks.com: Charts, Trends, Fundamental Data and Performances of SmallCap Stocks | |
|
We now take in-depth look at all SmallCap stocks including charts, multi-period performances and overall trends (as measured by Smart Investing & Trading Score). One can sort SmallCap stocks (click link to choose) by Daily, Weekly and by Year-to-Date performances. Also, one can sort by size of the company or by market capitalization. |
| Select Your Default Chart Type: | |||||
| |||||
| Click on stock symbol or name for detailed view. Click on to add stock symbol to your watchlist and to view watchlist. Quick View: Move mouse or cursor over "Daily" to quickly view daily technical stock chart and over "Weekly" to view weekly technical stock chart. | |||||

 | PIII P3 Health Partners Inc. |
| Sector: Health Care | |
| SubSector: Medical Care Facilities | |
| MarketCap: 944 Millions | |
| Recent Price: 0.47 Smart Investing & Trading Score: 20 | |
| Day Percent Change: -3.81% Day Change: -0.02 | |
| Week Change: -18.9% Year-to-date Change: -68.0% | |
| PIII Links: Profile News Message Board | |
| Charts:- Daily , Weekly | |
| Add PIII to Watchlist: View: Get Complete PIII Trend Analysis ➞ | |
 | ROIC Retail Opportunity Investments Corp. |
| Sector: Financials | |
| SubSector: REIT - Retail | |
| MarketCap: 943.414 Millions | |
| Recent Price: 12.09 Smart Investing & Trading Score: 0 | |
| Day Percent Change: -1.91% Day Change: -0.23 | |
| Week Change: -2.78% Year-to-date Change: -13.9% | |
| ROIC Links: Profile News Message Board | |
| Charts:- Daily , Weekly | |
| Add ROIC to Watchlist: View: Get Complete ROIC Trend Analysis ➞ | |
 | INFN Infinera Corporation |
| Sector: Technology | |
| SubSector: Communication Equipment | |
| MarketCap: 943 Millions | |
| Recent Price: 4.72 Smart Investing & Trading Score: 10 | |
| Day Percent Change: 4.07% Day Change: 0.18 | |
| Week Change: -1.36% Year-to-date Change: -0.5% | |
| INFN Links: Profile News Message Board | |
| Charts:- Daily , Weekly | |
| Add INFN to Watchlist: View: Get Complete INFN Trend Analysis ➞ | |
 | MEI Methode Electronics, Inc. |
| Sector: Technology | |
| SubSector: Diversified Electronics | |
| MarketCap: 941.896 Millions | |
| Recent Price: 12.30 Smart Investing & Trading Score: 42 | |
| Day Percent Change: -2.15% Day Change: -0.27 | |
| Week Change: -1.76% Year-to-date Change: -45.9% | |
| MEI Links: Profile News Message Board | |
| Charts:- Daily , Weekly | |
| Add MEI to Watchlist: View: Get Complete MEI Trend Analysis ➞ | |
 | FLWS 1-800-FLOWERS.COM, Inc. |
| Sector: Services & Goods | |
| SubSector: Specialty Retail, Other | |
| MarketCap: 940 Millions | |
| Recent Price: 8.72 Smart Investing & Trading Score: 10 | |
| Day Percent Change: -0.57% Day Change: -0.05 | |
| Week Change: -2.46% Year-to-date Change: -19.1% | |
| FLWS Links: Profile News Message Board | |
| Charts:- Daily , Weekly | |
| Add FLWS to Watchlist: View: Get Complete FLWS Trend Analysis ➞ | |
 | SKWD Skyward Specialty Insurance Group, Inc. |
| Sector: Financials | |
| SubSector: Insurance - Property & Casualty | |
| MarketCap: 936 Millions | |
| Recent Price: 35.80 Smart Investing & Trading Score: 36 | |
| Day Percent Change: 0.08% Day Change: 0.03 | |
| Week Change: -0.08% Year-to-date Change: 5.5% | |
| SKWD Links: Profile News Message Board | |
| Charts:- Daily , Weekly | |
| Add SKWD to Watchlist: View: Get Complete SKWD Trend Analysis ➞ | |
 | MLAB Mesa Laboratories, Inc. |
| Sector: Technology | |
| SubSector: Scientific & Technical Instruments | |
| MarketCap: 935.453 Millions | |
| Recent Price: 102.26 Smart Investing & Trading Score: 50 | |
| Day Percent Change: -2.10% Day Change: -2.20 | |
| Week Change: -2.62% Year-to-date Change: -2.4% | |
| MLAB Links: Profile News Message Board | |
| Charts:- Daily , Weekly | |
| Add MLAB to Watchlist: View: Get Complete MLAB Trend Analysis ➞ | |
 | CVGW Calavo Growers, Inc. |
| Sector: Consumer Staples | |
| SubSector: Farm Products | |
| MarketCap: 935.287 Millions | |
| Recent Price: 24.90 Smart Investing & Trading Score: 18 | |
| Day Percent Change: 1.06% Day Change: 0.26 | |
| Week Change: 1.88% Year-to-date Change: -15.3% | |
| CVGW Links: Profile News Message Board | |
| Charts:- Daily , Weekly | |
| Add CVGW to Watchlist: View: Get Complete CVGW Trend Analysis ➞ | |
 | PRIM Primoris Services Corporation |
| Sector: Industrials | |
| SubSector: Heavy Construction | |
| MarketCap: 931.895 Millions | |
| Recent Price: 44.45 Smart Investing & Trading Score: 51 | |
| Day Percent Change: -0.70% Day Change: -0.31 | |
| Week Change: -2.32% Year-to-date Change: 33.8% | |
| PRIM Links: Profile News Message Board | |
| Charts:- Daily , Weekly | |
| Add PRIM to Watchlist: View: Get Complete PRIM Trend Analysis ➞ | |
 | PRM Perimeter Solutions, SA |
| Sector: Materials | |
| SubSector: Specialty Chemicals | |
| MarketCap: 930 Millions | |
| Recent Price: 7.11 Smart Investing & Trading Score: 46 | |
| Day Percent Change: -0.07% Day Change: 0.00 | |
| Week Change: -2% Year-to-date Change: 54.6% | |
| PRM Links: Profile News Message Board | |
| Charts:- Daily , Weekly | |
| Add PRM to Watchlist: View: Get Complete PRM Trend Analysis ➞ | |
 | GRND Grindr Inc. |
| Sector: Technology | |
| SubSector: Software - Application | |
| MarketCap: 929 Millions | |
| Recent Price: 9.94 Smart Investing & Trading Score: 46 | |
| Day Percent Change: -0.90% Day Change: -0.09 | |
| Week Change: -2.93% Year-to-date Change: 10.9% | |
| GRND Links: Profile News Message Board | |
| Charts:- Daily , Weekly | |
| Add GRND to Watchlist: View: Get Complete GRND Trend Analysis ➞ | |
 | SCLX Scilex Holding Company |
| Sector: Health Care | |
| SubSector: Drug Manufacturers - General | |
| MarketCap: 927 Millions | |
| Recent Price: 1.15 Smart Investing & Trading Score: 10 | |
| Day Percent Change: -10.55% Day Change: -0.14 | |
| Week Change: -13.91% Year-to-date Change: -41.6% | |
| SCLX Links: Profile News Message Board | |
| Charts:- Daily , Weekly | |
| Add SCLX to Watchlist: View: Get Complete SCLX Trend Analysis ➞ | |
 | GTY Getty Realty Corp. |
| Sector: Financials | |
| SubSector: REIT - Retail | |
| MarketCap: 926.114 Millions | |
| Recent Price: 26.31 Smart Investing & Trading Score: 10 | |
| Day Percent Change: -1.13% Day Change: -0.30 | |
| Week Change: -0.68% Year-to-date Change: -10.0% | |
| GTY Links: Profile News Message Board | |
| Charts:- Daily , Weekly | |
| Add GTY to Watchlist: View: Get Complete GTY Trend Analysis ➞ | |
 | GPI Group 1 Automotive, Inc. |
| Sector: Services & Goods | |
| SubSector: Auto Dealerships | |
| MarketCap: 921.021 Millions | |
| Recent Price: 269.24 Smart Investing & Trading Score: 26 | |
| Day Percent Change: 0.50% Day Change: 1.33 | |
| Week Change: -0.07% Year-to-date Change: -11.7% | |
| GPI Links: Profile News Message Board | |
| Charts:- Daily , Weekly | |
| Add GPI to Watchlist: View: Get Complete GPI Trend Analysis ➞ | |
 | WHD Cactus, Inc. |
| Sector: Energy | |
| SubSector: Oil & Gas Equipment & Services | |
| MarketCap: 920.261 Millions | |
| Recent Price: 50.22 Smart Investing & Trading Score: 51 | |
| Day Percent Change: -0.22% Day Change: -0.11 | |
| Week Change: -1.39% Year-to-date Change: 10.6% | |
| WHD Links: Profile News Message Board | |
| Charts:- Daily , Weekly | |
| Add WHD to Watchlist: View: Get Complete WHD Trend Analysis ➞ | |
 | MTTR Matterport, Inc. |
| Sector: Technology | |
| SubSector: Software - Application | |
| MarketCap: 920 Millions | |
| Recent Price: 1.81 Smart Investing & Trading Score: 15 | |
| Day Percent Change: -2.16% Day Change: -0.04 | |
| Week Change: -6.22% Year-to-date Change: -33.0% | |
| MTTR Links: Profile News Message Board | |
| Charts:- Daily , Weekly | |
| Add MTTR to Watchlist: View: Get Complete MTTR Trend Analysis ➞ | |
 | PMT PennyMac Mortgage Investment Trust |
| Sector: Financials | |
| SubSector: Mortgage Investment | |
| MarketCap: 917.639 Millions | |
| Recent Price: 13.28 Smart Investing & Trading Score: 10 | |
| Day Percent Change: -0.64% Day Change: -0.08 | |
| Week Change: -2.03% Year-to-date Change: -11.2% | |
| PMT Links: Profile News Message Board | |
| Charts:- Daily , Weekly | |
| Add PMT to Watchlist: View: Get Complete PMT Trend Analysis ➞ | |
 | ALTI AlTi Global, Inc. |
| Sector: Financials | |
| SubSector: Asset Management | |
| MarketCap: 917 Millions | |
| Recent Price: 4.50 Smart Investing & Trading Score: 10 | |
| Day Percent Change: -0.22% Day Change: -0.01 | |
| Week Change: -4.26% Year-to-date Change: -50.4% | |
| ALTI Links: Profile News Message Board | |
| Charts:- Daily , Weekly | |
| Add ALTI to Watchlist: View: Get Complete ALTI Trend Analysis ➞ | |
 | SKY Skyline Champion Corporation |
| Sector: Industrials | |
| SubSector: Manufactured Housing | |
| MarketCap: 915.145 Millions | |
| Recent Price: 76.32 Smart Investing & Trading Score: 26 | |
| Day Percent Change: -2.32% Day Change: -1.81 | |
| Week Change: -3.62% Year-to-date Change: 2.8% | |
| SKY Links: Profile News Message Board | |
| Charts:- Daily , Weekly | |
| Add SKY to Watchlist: View: Get Complete SKY Trend Analysis ➞ | |
 | BKE The Buckle, Inc. |
| Sector: Services & Goods | |
| SubSector: Apparel Stores | |
| MarketCap: 913.808 Millions | |
| Recent Price: 35.90 Smart Investing & Trading Score: 0 | |
| Day Percent Change: -1.72% Day Change: -0.63 | |
| Week Change: -2.53% Year-to-date Change: -24.5% | |
| BKE Links: Profile News Message Board | |
| Charts:- Daily , Weekly | |
| Add BKE to Watchlist: View: Get Complete BKE Trend Analysis ➞ | |
 | MD MEDNAX, Inc. |
| Sector: Health Care | |
| SubSector: Specialized Health Services | |
| MarketCap: 913.656 Millions | |
| Recent Price: 9.01 Smart Investing & Trading Score: 10 | |
| Day Percent Change: -1.80% Day Change: -0.16 | |
| Week Change: -2.54% Year-to-date Change: -3.2% | |
| MD Links: Profile News Message Board | |
| Charts:- Daily , Weekly | |
| Add MD to Watchlist: View: Get Complete MD Trend Analysis ➞ | |
 | ATI Allegheny Technologies Incorporated |
| Sector: Industrials | |
| SubSector: Metal Fabrication | |
| MarketCap: 913.35 Millions | |
| Recent Price: 51.09 Smart Investing & Trading Score: 43 | |
| Day Percent Change: 0.00% Day Change: 0.00 | |
| Week Change: -1.07% Year-to-date Change: 12.4% | |
| ATI Links: Profile News Message Board | |
| Charts:- Daily , Weekly | |
| Add ATI to Watchlist: View: Get Complete ATI Trend Analysis ➞ | |
 | FBP First BanCorp. |
| Sector: Financials | |
| SubSector: Foreign Regional Banks | |
| MarketCap: 913.079 Millions | |
| Recent Price: 16.36 Smart Investing & Trading Score: 0 | |
| Day Percent Change: -1.48% Day Change: -0.25 | |
| Week Change: -1.77% Year-to-date Change: -0.6% | |
| FBP Links: Profile News Message Board | |
| Charts:- Daily , Weekly | |
| Add FBP to Watchlist: View: Get Complete FBP Trend Analysis ➞ | |
 | SMP Standard Motor Products, Inc. |
| Sector: Consumer Staples | |
| SubSector: Auto Parts | |
| MarketCap: 909.939 Millions | |
| Recent Price: 32.10 Smart Investing & Trading Score: 10 | |
| Day Percent Change: 0.25% Day Change: 0.08 | |
| Week Change: -0.06% Year-to-date Change: -19.4% | |
| SMP Links: Profile News Message Board | |
| Charts:- Daily , Weekly | |
| Add SMP to Watchlist: View: Get Complete SMP Trend Analysis ➞ | |
 | EGBN Eagle Bancorp, Inc. |
| Sector: Financials | |
| SubSector: Regional - Mid-Atlantic Banks | |
| MarketCap: 906.559 Millions | |
| Recent Price: 20.97 Smart Investing & Trading Score: 10 | |
| Day Percent Change: -1.60% Day Change: -0.34 | |
| Week Change: -1.69% Year-to-date Change: -30.4% | |
| EGBN Links: Profile News Message Board | |
| Charts:- Daily , Weekly | |
| Add EGBN to Watchlist: View: Get Complete EGBN Trend Analysis ➞ | |
| Too many stocks? View smallcap stocks filtered by marketcap & sector |
| Marketcap: All SmallCap Stocks (default-no microcap), Large, Mid-Range, Small & MicroCap |
| Sector: Tech, Finance, Energy, Staples, Retail, Industrial, Materials, Utilities & Medical |
|
Best Stocks Today 12Stocks.com |
© 2024 12Stocks.com Terms & Conditions Privacy Contact Us
All Information Provided Only For Education And Not To Be Used For Investing or Trading. See Terms & Conditions


One More Thing ... Get Best Stocks Delivered Daily!
Never Ever Miss A Move With Our Top Ten Stocks Lists
Find Best Stocks In Any Market - Bull or Bear Market
Take A Peek At Our Top Ten Stocks Lists: Daily, Weekly, Year-to-Date & Top Trends
Find Best Stocks In Any Market - Bull or Bear Market
Take A Peek At Our Top Ten Stocks Lists: Daily, Weekly, Year-to-Date & Top Trends
Smallcap Stocks With Best Up Trends [0-bearish to 100-bullish]: Macatawa Bank[100], Intra-Cellular Therapies[100], Warrior Met[100], Argan [100], Boot Barn[100], Encore Wire[100], Core Molding[100], Phibro Animal[95], Theravance Biopharma[95], Integer [88], Aclaris [88]
Best Smallcap Stocks Year-to-Date:
CareMax [510.31%], Janux [374.64%], Viking [259.22%], Alpine Immune[238.39%], Super Micro[230.09%], Arcutis Bio[210.99%], Longboard [199.1%], Vera [179.91%], Avidity Biosciences[164.6%], Veritone [153.02%], Stoke [140.02%] Best Smallcap Stocks This Week:
Macatawa Bank[43.01%], ProKidney [41.71%], Snap One[29.3%], Intra-Cellular Therapies[21.25%], Encore Wire[11.1%], Piedmont Lithium[8.12%], Envestnet [8.12%], Warrior Met[7.61%], United Homes[7.32%], NextNav [7.22%], Avid Bioservices[6.97%] Best Smallcap Stocks Daily:
Macatawa Bank[38.12%], Intra-Cellular Therapies[23.35%], System1 [20.59%], ProKidney [18.66%], NextNav [12.62%], Envestnet [9.57%], Allbirds [9.40%], Nuvectis Pharma[8.11%], ALX Oncology[7.68%], Big Lots[7.14%], Warrior Met[7.08%]